| A DRAFT Report On the State of Sandy Lake, the Historical Trends and its Future Trajectory
Feb 23, 2021 Author Summary: Web Page | PDF Revisions/Updates |
PDFs for printing N (Not updated after 23Feb2021)
– Background & Highlights (4 pages): SandyLakeDRAFTSummary23Feb021
– Full Report: SandyLakeDRAFTReport23Feb2021
– More Details: SandyLkMoreDetails23Feb2021
Contents

1. INTRODUCTION
2 SURFACE WATERS & BIODIVERSITY
2.1 Major Streams & Lake Bathymetry
2.2 Watercourse Wetlands
2.3 Aquatic Life
2.4 Riparian Habitat
3 SETTLEMENT AND ITS IMPACTS
3.1 Existing, Approved and Potential Future Settlement
3.2 Proposed Regional Park
3.3 Temporal Trends in Total P
3.4 Temporal Trends in pH
3.5 Acid Slate Hazard
3.6 Limnological Profiles
3.7 Temporal Trends in EC (salt)
3.8 Spatial Variation in EC and pH
3.9 Clearcutting & Other Physical Disturbances
3.10 Coliforms and Algae
4 FUTURE TRAJECTORY
4.1 AECOM 2014 Predictions
4.2 Critique of Predictions/No Followup Monitoing
–Criteria to apply the model were not met
–WQO not justified
–Inappropriate fix for the model
–Further monitoring not conducted
4.3 Relevance of information gathered or made available after 2014
–Low oxygen in deep water
–Climate warming
–Algal bloom
–Road Salts
4.4 Some questions, and comments on further monitoring
5 CONCLUSION
Postscript Notes
More Details:
– Critique of Predictions/No Followup Monitoring
– Mirror Lake – Sandy Lake comparison
| For simplicity, Tables, Graphs, Charts and Maps are all referred to as “Figures” and are numbered sequentially (Fig SL 1, Fig SL 2…). Click on images on this page for larger versions. “P” refers to phosphorus; “Total P”, to Total Phosphorus. EC refers to Electrical Conductivity; as measured and cited herein, it is the same as Specific Conductance. |
1. INTRODUCTION
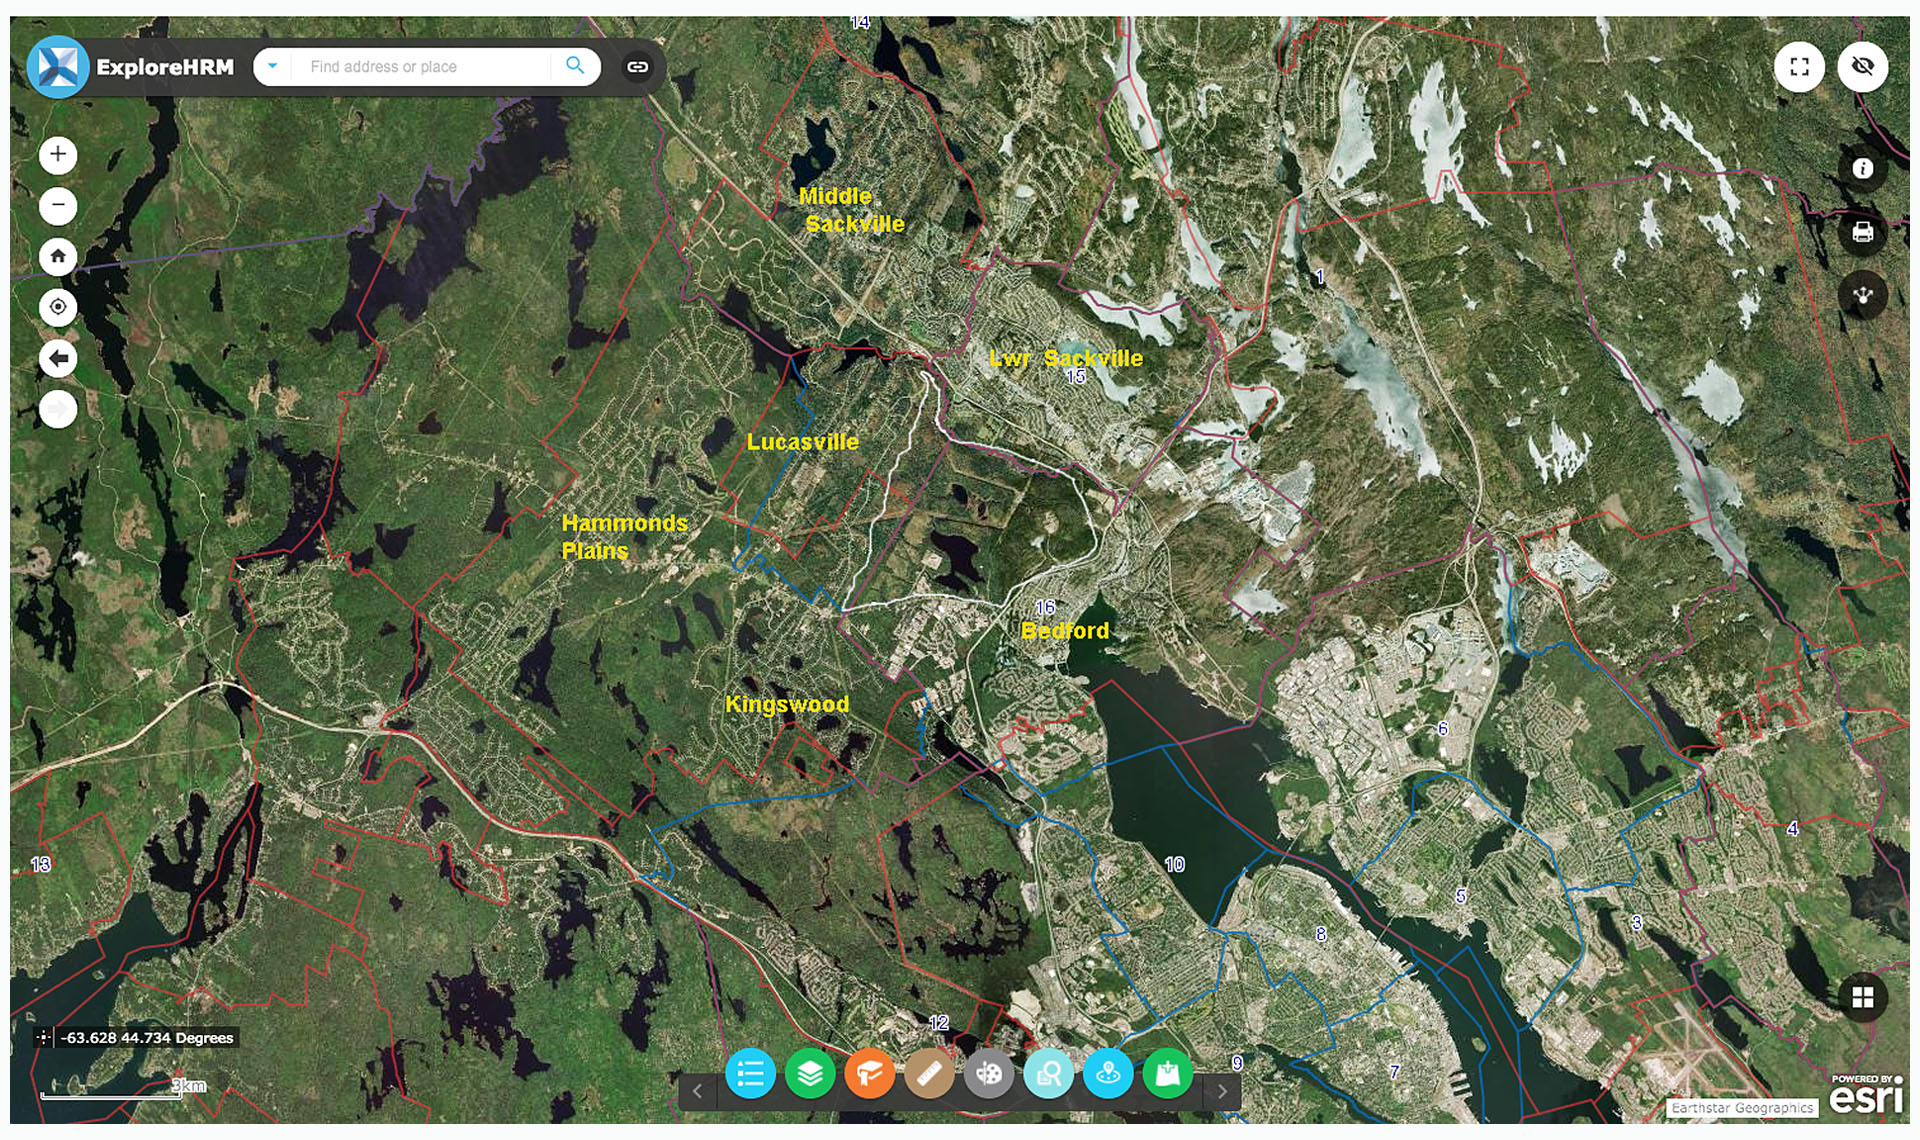
There are three lakes in the area encompassed by Sandy Lake and Environs/the proposed Sandy Lake-Sackville River Regional Park: Sandy Lake, Marsh Lake and Jack Lake.
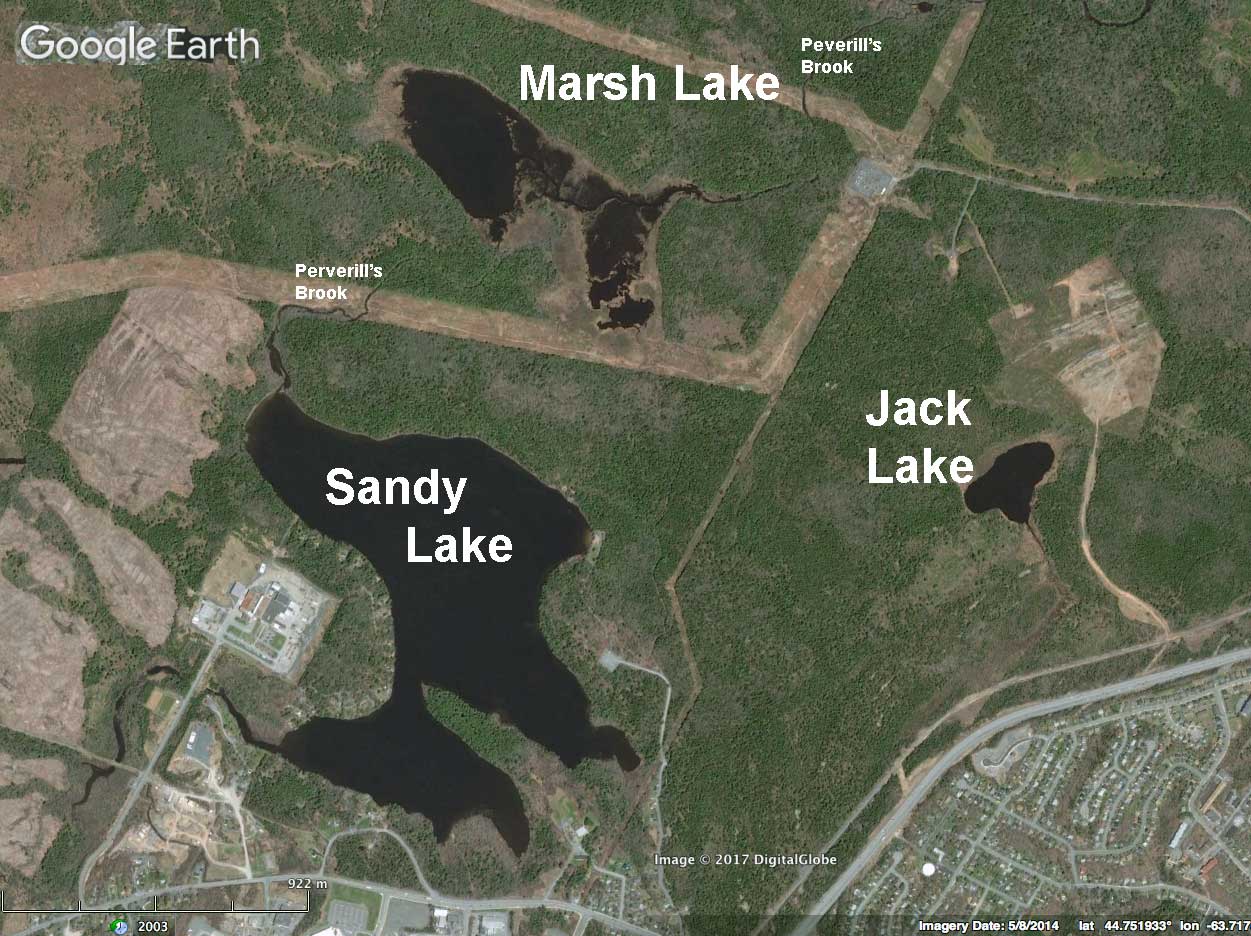
SL Fig 1: The three lakes of Sandy Lake & Environs shown on Google Earth. Sandy Lake flows into Marsh Lake and thence into the Sackville River. Jack lake is in a separate watershed. Sandy Lake, but not Marsh Lake and Jack Lake receives waters from storm sewers. View image of larger area
Sandy Lake, the largest and deepest, is a headwater lake in the Sackville River watershed. It drains into Marsh Lake and thence into the Sackville River. The Sandy lake watershed (22.4 sq kilometers, 2422 ha), which includes Marsh Lake, is the largest or second largest sub-watershed within the Sackville River watershed, the order depending on how the streams and lakes are aggregated. Jack Lake is a headwater lake on the Papermill Lake Watershed.
Some morphometric and water chemistry data for the three lakes from the Jack Lake CHMC/NSDH Report (1986) are given below:
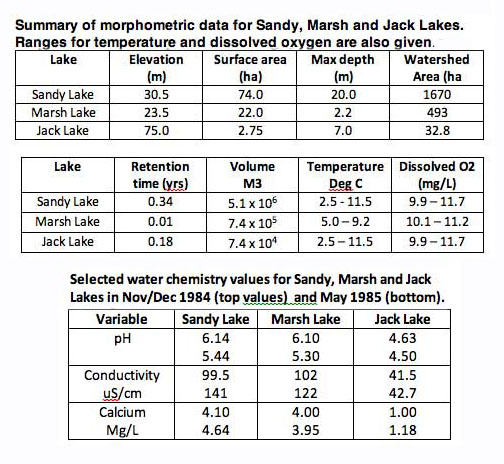
SL Fig 2: Morphometric (above) and chemical (below) stats for the three lakes. From Jack Lake Environmental Evaluation Final Report. Canada Mortgage and Housing Corporation & Nova Scotia Department of Housing, 1986.
So these are quite different lakes. Sandy Lake is relatively deep, Marsh Lake shallow, and Jack Lake very small and acidic. Sandy Lake and Jack Lake are deep enough to stratify (according to Brylinski, 2004, such lakes are larger than 1 ha and generally >3 m depth for brown-water lakes and >6 m for clear-water lakes). Jack Lake is a brownish water lake, Sandy Lake has very little colour, likewise for Marsh Lake.* Sandy Lake receives waters from storm sewers emptying into streams that enter the lake; Marsh Lake receives such waters secondarily. Jack Lake receives no such waters.
____________________
*Colour TCU for Sandy Lake 12.5 (Sep 2, 1998); Marsh Lake 7.5 (Jul 25, 2007): Jack 36.7 (Dec 7, 1984); for comparison, Hubley Lake, a large brown water lake: 65.0 (Dec 14, 1984). Data from Nova Scotia Lake Survey Program
Mandel (1994) calculated urban land use percentages within the Sandy Lake watershed for 1967 and 1986 as 0 and 21.09% respectively. He associated the change with loss in forest cover which he estimated as 100% in 1967 (except for surface waters). I have estimated the % settlement of the Sandy Lake Watershed in 2014 as 29.2%. Most of this settlement drains into streams and groundwater entering Sandy Lake. There is no settlement close to Marsh Lake. Settlement has likely increased only marginally since 2014, but major development has been approved south of Hammonds Plains Road – Bedford West Sub-area 12 – and major development has been proposed north of Hammonds Plains Road on lands just west of the lake (see AECOM 2014). Both areas drain into Sandy Lake. Together those developments could increase the settled area to perhaps 45 % of the Sandy lake watershed.
Such development will inevitably have direct impacts on Sandy Lake and indirectly on Marsh Lake, and could have impacts on the sea-going fish (salmon, some speckled trout, gaspereau, eel) that spend part of their lives in Sandy Lake, aquatic biodiversity more generally, and the recreational value of the lake.*
________________
*Potentially, there could also be impacts on annual flooding within the Sackville River floodplain. Remarkably, a recent study of the possible impacts of development and climate change on flooding within the Sackville River floodplain did not examine the potential impacts of further development within the Sandy Lake watershed.
Since June of 2017, I have been conducting observations on the plant communities of the surface waters and forests in the area of Sandy Lake (Bedford, NS) as a volunteer for the Sandy Lake Conservation Association. Derek Sarty, Bruce Sarty, and Ed Glover have assisted in collecting these observations. The results and related literature, links etc. are compiled on this website.
On this page, I provide an overview of state of Sandy Lake and the historical trends in water quality by integrating what’s available in the literature – most notably in AECOM (2014) which provides a detailed, comprehensive overview of the state of Sandy Lake based on all information they could gather at the time – with my observations. I then consider the AECOM 2014 predictions of the future trajectory of the lake and the impacts of proposed development and how I think those predictions might be reconsidered or revised in the light of subsequent field observations.
While I am fairly familiar with some of the techniques and literature of limnology, it was not my professional area of research; thus review and critique of this Draft are invited and appreciated.
– David Patriquin
Professor of Biology
Dalhousie University (retired 2008)
Feb 19, 2021Update Mar 2022: Two respected limnologists have reviewed these materials and had no concerns; they agreed with the gist of the conclusions.
WHAT IS “AECOM (2014)”?
The full title:
Halifax Regional Municipality Sandy Lake Watershed Study Final Report
Prepared by AECOM Canada Ltd., submitted August 25, 2014. 64 pages + Appendices (66 pages).“This body of work represents our current understanding of the environmental conditions in the watershed with a focus on lake water quality. The application of a phosphorus load model (Lake Capacity Model) provides a numerical narrative of how development may impact water quality. We identify several methods that can be utilized to mitigate water quality impacts.” The report provides a valuable compilation of information about Sandy Lake and the larger watershed, including many maps. The report is available here (from the Sandy Lake Conservation Association). Except for a few samples of lake water, the AECOM 2014 was entirely a desktop study (as requested by HRM).
2. SURFACE WATERS & BIODIVERSITY
2.1 Major Streams & Lake Bathymetry
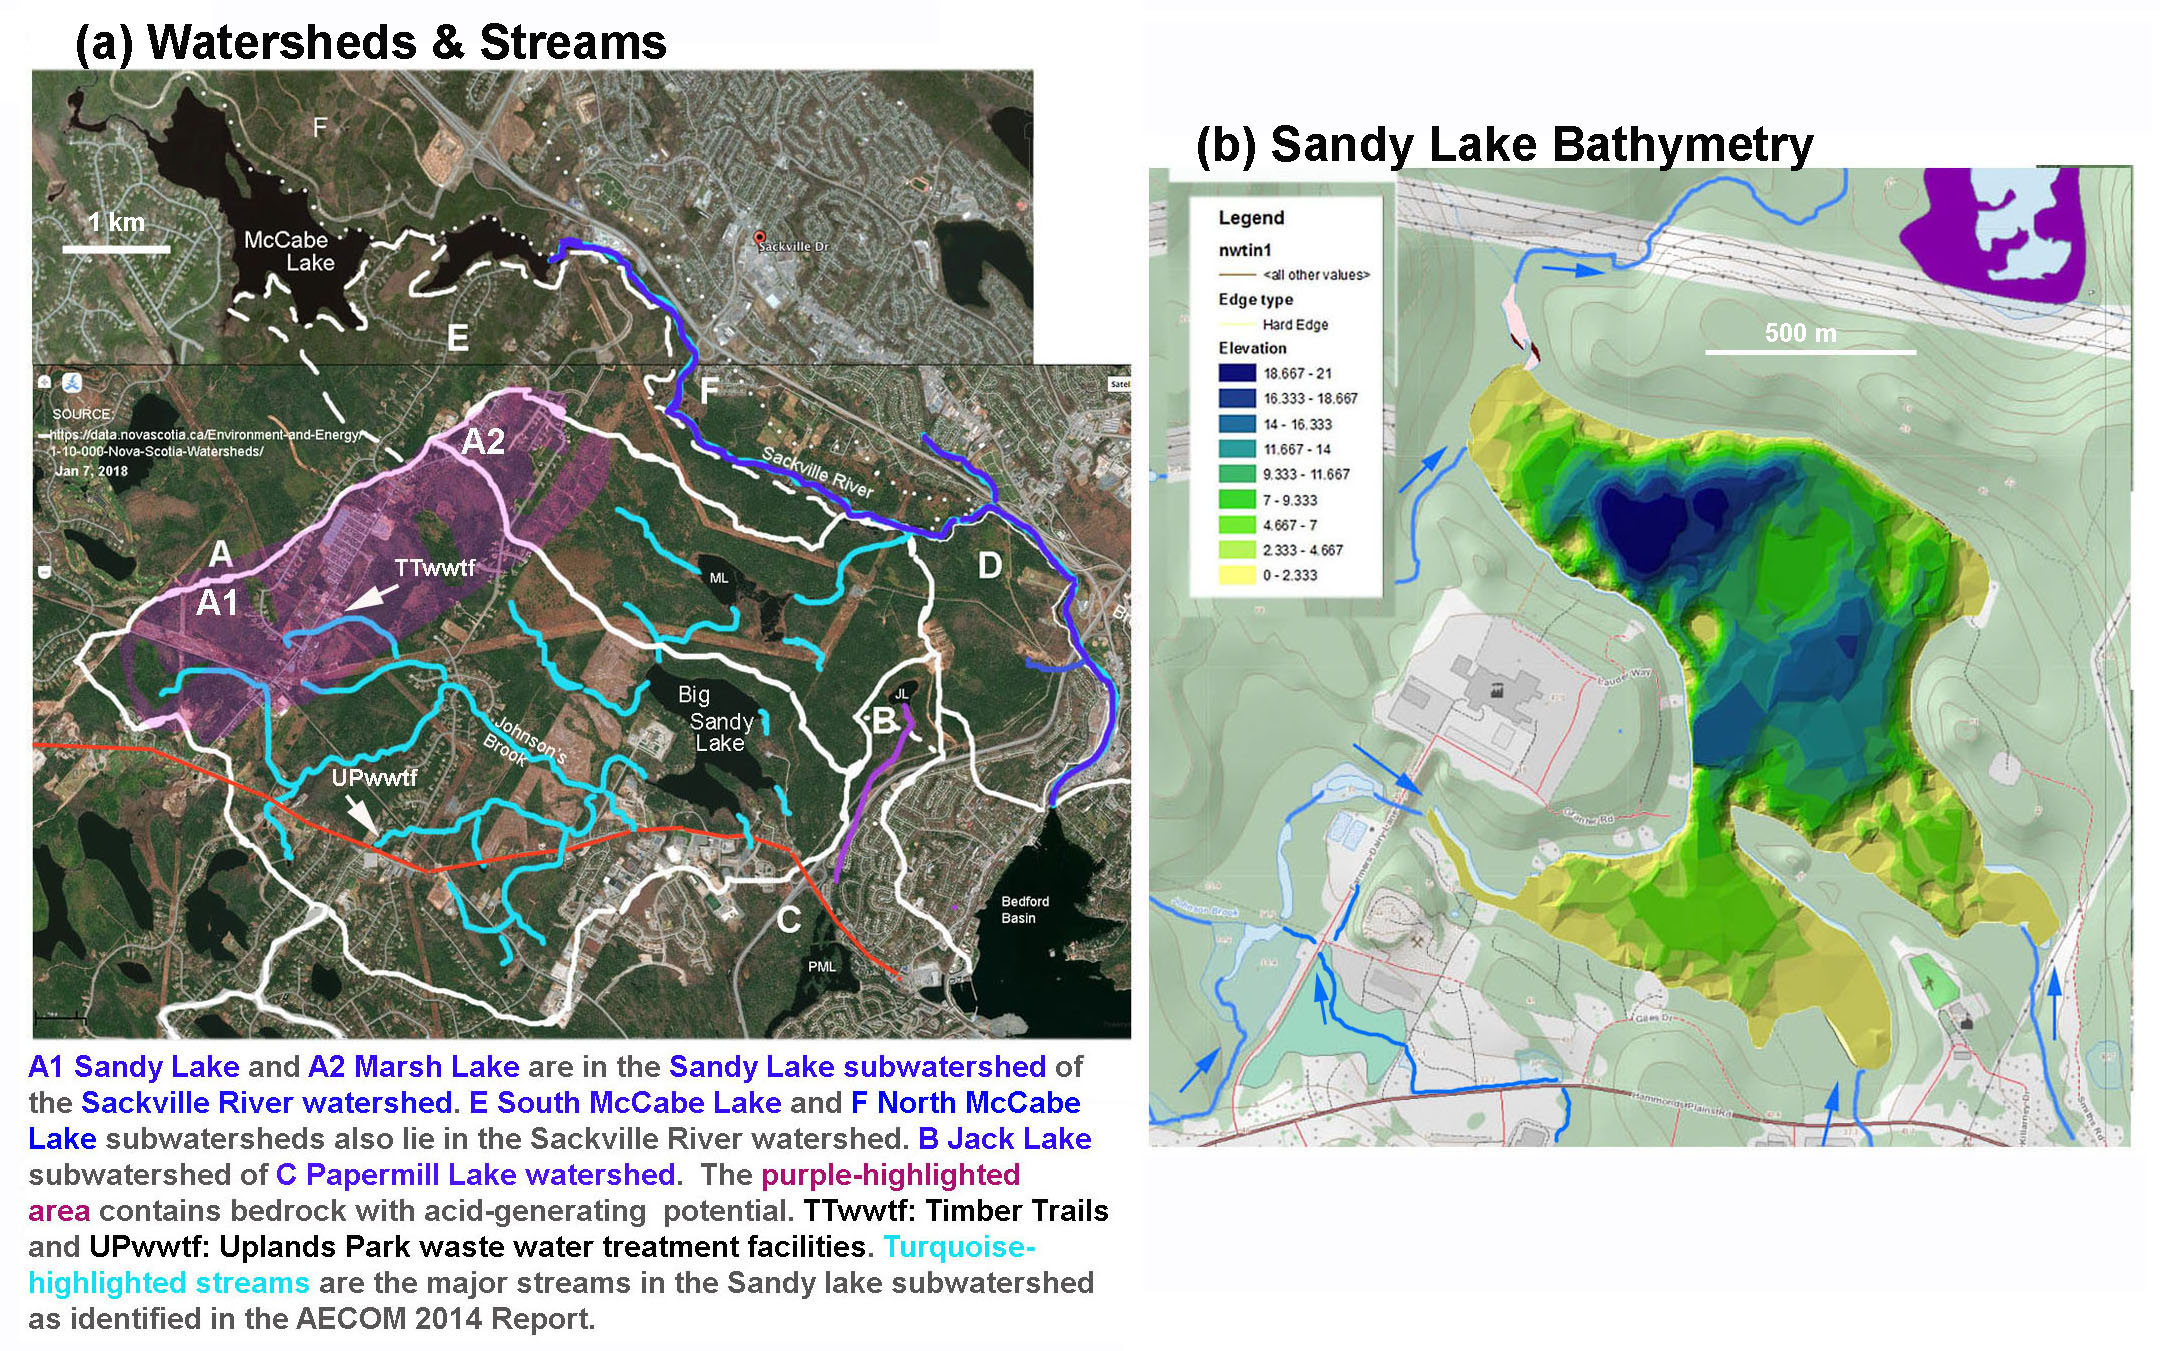
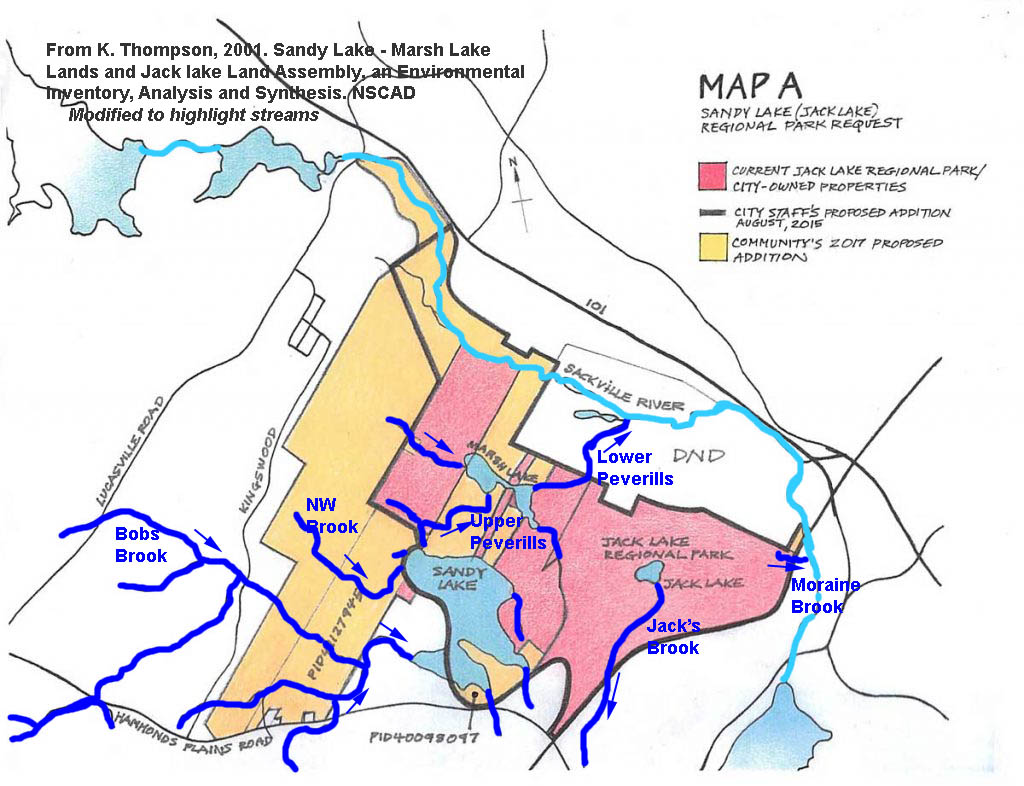
SL Fig 3:
(a) Watersheds of Sandy Lake & Environs and Major Streams of the Sandy Lake sub-watershed (b) Ed Glover’s Bathymetric Map of Sandy Lake superimposed on PLV Map. PLV refers to the Nova Scotia Provincial Landscape Viewer; blue highlighting and directional arrows are inserted on the PLV map. The Ed Glover map is based on depth soundings in 2006.
(Click on image for larger version.)
Above Left: Most of the surface water enters Sandy Lake via streams on the west side of the lake, with the greatest concentration converging on the southwest corner of the lake. The (sub-sub) watersheds for each and all of the major streams flowing into Sandy Lake include settled areas, however currently the lands closest to the lake and the major streams are lightly settled or not not settled. Acid slates occur at the outer reaches of the watershed on the western side of Sandy Lake.
Above Right: There are three deep spots in Sandy Lake with maximum depths of 21.7 m (northernmost), ~19 m and ~18 m. The lake is normally dimictic, thermally stratifying in winter and summer and turning over in the spring and in the fall. Also view map from Damon et al.(2002).
2.2 Watercourse Wetlands
Wetlands associated with watercourses can have a big influence on water quality and flows of water downstream, e.g., by removing nutrients and sediment, they improve water quality; by storing water and releasing it slowly, they reduce peak flows and downstream flooding (view Leibowitz et al., 2018 and Golden et al., 2019 for reviews). They are also very important as habitat – in Nova Scotia “53.8 per cent of species protected under the provincial law are dependent on wetlands for survival” (NS L&F Document May 31, 2019).
These features are well recognized as issues to be addressed when open (wild, undeveloped) lands are developed, and so there are legal requirements to protect watercourses and any associated wetlands.
According to AECOM (2014) “Approximately 85 ha of the watershed are wetlands, which make up about 3.5 % of the watershed area”, commenting “This is a small proportion relative to the size of the watershed and suggests the watershed is well drained.” However their identification of wetlands (AECOM 2014, Fig 3) does not include
(i) significant wetlands around the 4 major inlets to Sandy Lake;
(ii) NIA (no-information available) patches on watercourses, most of which are likely wetlands; these areas are included under Type I Constraints- Watercourses, Wetlands and Riparian Buffers in AECOM (2014) Fig 7.
Of particular note are wetlands labelled in SL Fig 4 below as NIA 1 (approx 3.5 ha) and NIA2 (approx 3 ha) which lie on the watercourse leading from the Upland Park Waste Water Treatment Facility to Sandy Lake, as those could remove significant amounts of phosphorus. NIA1 also holds a lot of water and is identified in AECOM 2014, Fig 6 as an area of high groundwater recharge.
For more about the NIA1 and NIA2 wetlands, view
– W and SW of S. Lake 2Oct2020 & the PART II Photo Album referenced on that page;
– Wetlands SW of Sandy Lake.

SL Fig 4: Wetland Inventory for area southwest of Sandy Lake. The base map is from a screenshot of the wetland layer in the PLV (Provincial Landscape Viewer). Streams (“WAM Predicted Flows”) feeding Sandy Lake are highlighted. The names “HP South Brook” and “Western Brook” are my identifiers for these streams. Johnson’s Brook is also known as “Bob’s Brook”. Coloured polygons are wetlands with vegetation as indicated by the key at top right. The areas in hectares are given at bottom right; those values are revealed when you click on the polygon in the PLV. NIA1,2 and 3 are “No Information Available” polygons; no values are given for the areas of the NIA polygons, the values above are my approximate estimates. Smaller NIAs are not shown – see those in Wetlands W Fig 1
The largest wetland close to Sandy Lake that is identified by AECOM (2014) – S5 in the map above – is highly degraded and could be contributing significant amounts pollutants to Sandy Lake. That condition was not recognized in AECOM (2014). For more about it, view Swamp 5 (degraded).
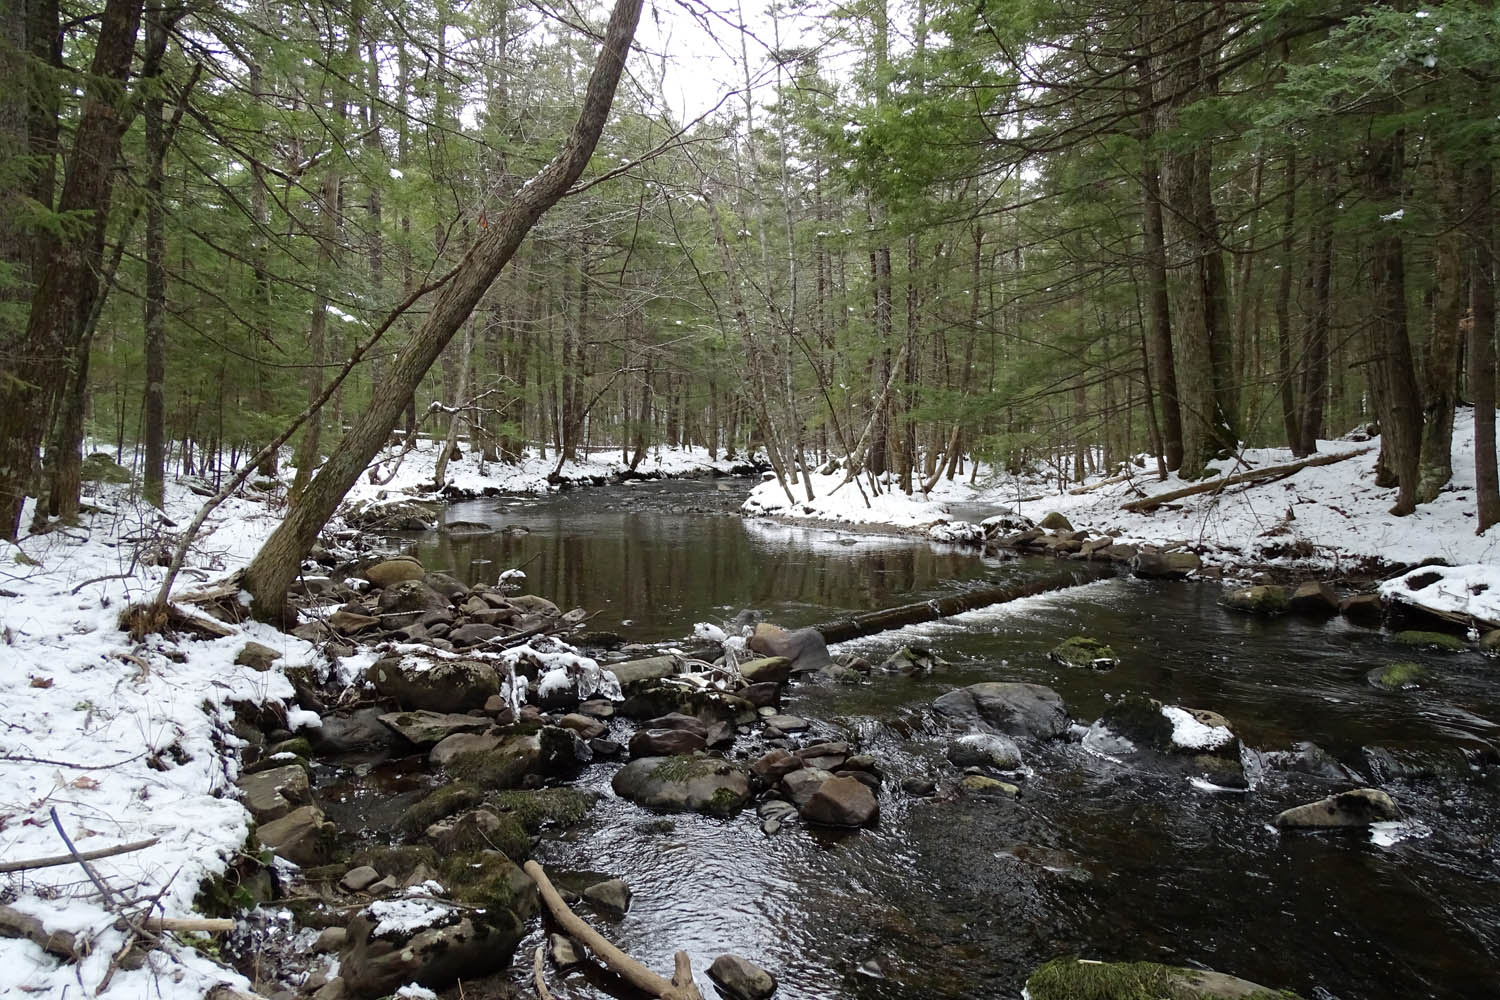
Digger Log on Upper Peverill’s Brook, Feb 1, 2021
2.3 Aquatic Life
Sandy Lake hosts seagoing fish (Atlantic salmon, speckled trout, gaspereau, American eel). All are considered desirable species but are Species-at-Risk (Atlantic salmon and Amerian eel, the latter considered threatened by COSEWIC federally and secure or may-be-at-risk by NS), or have undergone steep declines in some areas (speckled trout, due to competition from invasive species and decline in habitat quality; gaspereau in some areas due to logging and dams). The Sackville Rivers Association has been working since the late 198os to bring back salmon through habitat restoration and salmon stocking. They have installed digger logs at a dozen sites on Peverill’s Brook which drains from Sandy Lake through Marsh lake and into the Sackville River; those efforts improve conditions for all migratory species. Salmon grilse have been sighted in Sandy Lake the last 2 years and salmon were present in the lake historically. American Eel have also been observed within the past two years and historically. Gaspereau are regularly observed in the shallows in the spring months. Trout are still caught in the lake.
Smallmouth bass invaded Sandy Lake some time ago and are the major species taken today by recreational fishers.
The wetlands fringing Sandy Lake support large populations of frogs, mostly green frogs and bullfrogs, also breeding toads; and snapping turtles (endangered).
Sandy Lake has supported two pairs of common loons in the past, in recent years, 1 pair. There are also beavers and river otters. Beavers regularly build dams on some of the inflowing streams, also on Peverill’s Brook, and maintain lodges on Sandy Lake. The freshwater mussel Pyganodon cataracta occurs in abundance at Sandy Lake.
View About the Lake Fauna and submenus for more information; also Common Snapping Turtle and Species Lists.
2.4 Riparian Habitat.
The NWCF Report (2020) on Avian and Species at Risk Surveys of the proposed Sandy Lake-Sackville River Regional Park identified “a dozen smaller [wildlife] corridors containing important riparian and/or wetland habitats.” [Perhaps that number should be 10 rather than 12, there were 12 corridors in total, two of the the major corridors; 10 are identified as smaller scale corridors]. Seven of those occur on lands that could be developed; six of those are riparian habitats around streams entering Sandy Lake or Marsh Lake and are also within the lands that could be developed. One of them was observed to be an important route of movement of the common snapping turtle (a Threatened Species for NS) to and from Sandy Lake, and it was suspected that other of these local corridors are also important for snapping turtle. They are also vital habit for many other species.
The riparian habitats running through the regens contain many species that often use the regens for feeding purposes. The conjunction of these two habitats currently represent the highest bird densities found in the proposed park area and is the best location in the park for viewing the often-elusive Winter Wren – NWCF Report.
3 SETTLEMENT AND ITS IMPACTS
3.1 Existing, Approved and Potential Future Settlement
Mandel 1994 calculated urban land use percentages for 1967 and 1986 as 0 and 21.09%, and attributed the change to loss in forest cover; he estimated forest cover as 100% (except for surface waters) in 1967. I estimated the % settlement of the Sandy Lake Watershed in 2014 as 29.2% (view Land Use). It probably hasn’t increased more than a percentage or two since then, but significant new development in the Sandy Lake watershed has been approved southwest of Sandy Lake below Hammonds Plains Road, and more has been proposed just west of Sandy Lake.

SL Fig 5: Locations of impending and proposed major developments in the Sandy Lake sub-watershed and location of the proposed Sandy Lake-Sackville River Regional Park. A: Bedford West Development Sub-Area 12. B: Proposed development – see AECOM (2014) for details Coloured: Proposed Sandy Lake-Sackville River Regional Park. DND: lands belonging to Dept of National Defence (mostly mature/old growth forest). White boundaries are those of watersheds wA, wE etc. (see SL Fig 3). TTwwtf & UPwwtf: Locations of Timber Trails and Uplands Park Waste Water Treatment Facilities.
The watershed includes serviced and unserviced lots, the latter mostly in areas north of Hammonds Plains Road. There are two waste water treatment facilities from which effluent (UPwwtf) or seepage (TTwwtf) drain into Sandy Lake, detailed in AECOM 2014. Stormwater enters the lake or streams going into the lake via storm sewers and ditches. The Farmer’s Dairy facility which lies close to the lake has a self contained treatment system and all effluent goes into the Halifax Water system.
Area A has been approved for development (Bedford West subarea 12) but is currently largely undeveloped. 17,000 people are anticipated for all of Bedford West (CBCL 2009). Subarea 12 is about 1/7th of the total settlement area ( Schedule BW6, p 14 in Bedford West Secondary Planning Strategy), so subarea 12 would accommodate circa 2400 people occupying circa 150 ha including greenspace.
Development accommodating up to 15,000 people has been anticipated for Area B (CBCL 2009), occupying circa 350 ha; with both of these areas fully developed, the percentage of the watershed that is developed would be circa 45%. Both Area A and Area B include significant portions of the streams that converge on the major inlet at the southwest end of Sandy Lake. They also include significant watercourse wetlands.
The lakeshore itself remains lightly settled on the west and south sides. From AECOM (2014): ” In the Sandy Lake watershed there are no residences on Marsh Lake and there are approximately 20 residences situated within 300 m of Sandy Lake and approximately 200 residences within 300 m of watercourses. These residences rely on private septic systems to treat residential wastewater.”
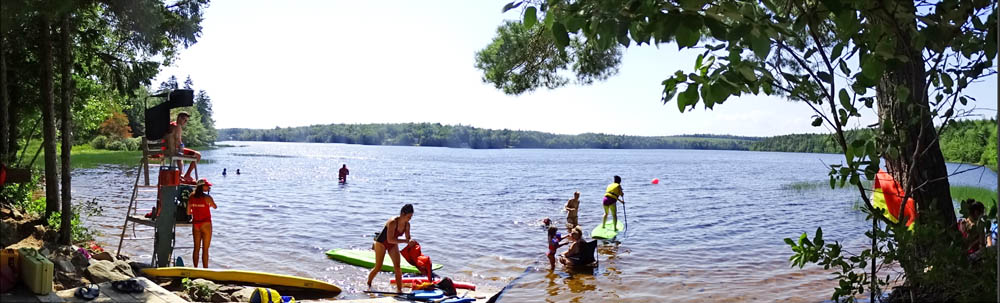
Public access to the lake is provided by the Sandy Lake Lion’s Park and Beach which was opened in 2003. It has changing rooms and compost toilets. The. shallow, sandy beach is well used by families with children, and HRM offers swimming programs there. There is a large parking lot situated well away from the Beach. Off-leash trails through the forest are popular with dog-walkers. Currently there are only one or two larger motor boats on the lake. There are a few sail boats, and paddle boards and canoes are commonly seen during summer.
3.2 Proposed Sandy Lake-Sackville River Regional Park
The coloured lands in SL Fig. 5 are those of the proposed Sandy Lake-Sackville River Regional Park (approx. 2800 acres/1133 ha in total); approx. 1000 acres/405 ha currently belong to HRM. View the RP + 10 submissions for details. The Park would provide a large recreational area to communities all around it (view map) and protect significant terrestrial habitat and wildlife corridors (see Avian & SAR Report 2020 and submenus on this website). The degree to which it might help protect water quality in the Sandy Lake watershed and Sandy Lake in particular is the issue at hand.
3.3 Temporal Trends in Total P
Based on Total P values which have increased over time, AECOM 2014 concluded that Sandy Lake has “transitioned from a generally oligotrophic state to a mesotrophic state.”
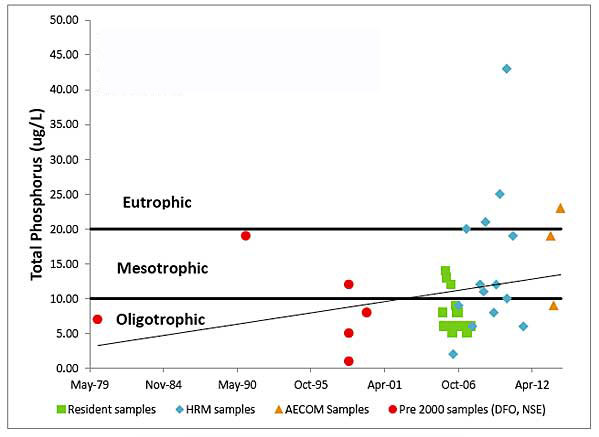
SL Fig 6: Historical Total P values for Sandy Lake. This is a screen capture of Figure 9 from the Halifax Regional Municipality Sandy Lake Watershed Study Final Report (AECOM 2014). Click on image for the report.
Not included on the chart above: Mandell (1994) reported a mean annual Total P value for 1991/92 of 9 ug/L.
3.4 Temporal Trends in pH
The interpretation of pH changes is complicated by the influence of acid rain and the lack of values earlier than 1955. Historically pH must have been high enough to support salmon. There has been an overall trend upwards since 1977.
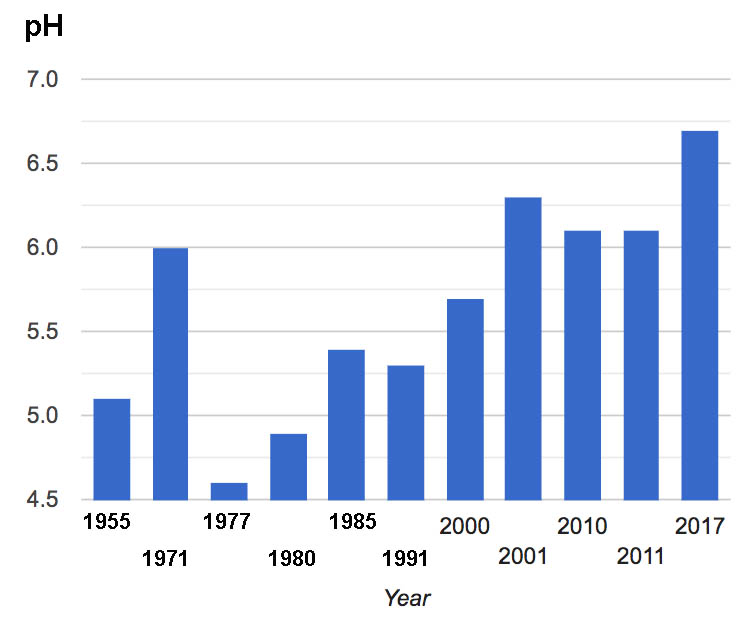
SL Fig 7: Historical values of Sandy Lake pH. Values are for near-surface samples on single days in each of the years shown. View sources
From the mid-1950’s through to 1980s average lake pH in Nova Scotia at large dropped 1-1.5 units1 due to acid rain. The values for Sandy Lake in 1977 and 1980 are below requirements for salmon (~5.0 and greater for adults, >5,4 for fry 2), while the 1955 value is close to the lower limits for salmon.
As salmon were in the Sackville River system/Sandy Lake historically, it seems that pH values favourable for Atlantic salmon must have existed in Sandy Lake prior to the era of increasing acid rain. Emission controls were implemented in the 1990s and reductions in stream acidity in northeastern NA began to be observed in the 2000s, although not in much of Nova Scotia on soils developed on slates and granite.3
Increases in pH (decreases in acidity) have been reported recently for the Pockwock and Lake Major water reservoirs.4 As sugar maple, a calcium-demanding species 5, occurs on on the thick drumlins by Sandy Lake, it can be inferred that the forests/drumlins by Sandy Lake (also Marsh Lake) provide some watershed buffering of lake pH. (See AECOM 2014, Fig 5 for distribution of drumlins.)
pH of surface water tends to increase with the urbanization/the degree of development within a watershed e.g. though runoff of lawn fertilizers including lime, so some or most of the more recent increase in pH could be associated with more settlement and roads.6, 7
_________________
1. Ginn et al. 2007. Assessing pH changes since pre-industrial times in 51 low-alkalinity lakes in Nova Scotia, Canada Can. J. Fish. Aquat. Sci. 64: 1043–1054.
2. Also, pH in the range 4.5 to 5 is cited by White et.al 1981 for Sandy Lake in 1980; liming had only a transitory effect (White et.al 1981. On the feasibility of rehabilitating acidified Atlantic salmon habitat in Nova Scotia by the addition of lime. Fisheries Vol 9(1):1-3). Salmon fry are highly sensitive to ph 5.4 and below, adults to pH <5.0, but it depends on the source of acidity, tolerance being less when the acidity is derived from sulphates in acid rain than from naturally occurring humic acids. Critical pH values for brook trout are cited as pH 4.7 to 5.2. Farmer, G. Effects of low environmental pH on Atlantic salmon in Nova Scotia. 2000. Canadian Stock Assessment Research Document 2000/050. Baldigo and Lawrence 2001. Effects of stream acidification and habitat on fish populations of a North American river. Aquat.Sci.63 (2001) 196–222.
3. Clair, T.A., Dennis, I.F., and Vet, R. 2011. Water chemistry and dissolved organic carbon trends in lakes from Canada’s Atlantic provinces: no recovery from acidification measured after 25 years of lake monitoring. Can. J. Fish. Aquat. Sci. 68(4): 663–674.
4. L.E. Anderson et al., 2017.Lake Recovery Through Reduced Sulfate Deposition: A New Paradigm for Drinking Water Treatment. Environ. Sci. Technol., 2017, 51 (3), pp 1414–1422.
5. Long, R.P. et al. 2009. Sugar maple growth in relation to nutrition and stress in the northeastern United States. Ecol Appl. 2009 19:1454-66.
6. Impervious surface as an indicator of pH and specific conductance in the urbanizing coastal zone of New Jersey, USA. Tenley M.Conway 2007. Journal of Environmental Management 85: 308-316.
7. For Halifax area, see Synoptic water quality survey of selected Halifax-area lakes : 2011 results and comparison with previous surveys Pierre M. Clement and Donald C. Gordon 2011. Can. Manuscr. Rep. Fish. Aquat. Sci. 3170: xi + 98 p.
3.5 Acid Slate Hazard
A set of water quality observations on Sandy Lake in 20018 revealed an exceptionally low pH value of 3.38 for the “Northern Inlet”. The same site sampled on Aug 21, 2017 had a pH value of 5.7. The low value in 2001 is likely due to exposure of acid slates in the northwestern part of the watershed (see AECOM 2014, p 8) as the origin of the brook (Northwestern Brook or Karen’s Brook) lies at the edge of the acid slates (Conrad et al., 2002 p 31). Conrad et al. 2002, p28 commented: “We suspect that much of the flow from the Northern Inlet “short-circuits” the lake by flowing directly across to the northern outlet and leaves the lake, with relatively low impact.”
While flow into Sandy Lake at the Northern Inlet may have relatively little influence on water quality of Sandy Lake at large, flushes of such highly acidic water into Peverill’s Brook could be very hazardous to aquatic life. A local example: release of highly acidic water by blasting for development in the upper part of the Woodens River system is suspected to be the cause of a sudden decline in Mayfly populations in 1989, followed by precipitous decline in brook trout and increase in yellow perch. View Where have all the mayflies gone? The problem is akin to well documented impacts of acid mine drainage, and is very expensive to counteract or to remediate.9 Clearly, blasting or other large scale disturbance of acid slates or in the Sandy Lake watershed needs to be avoided. I suggest that if any larger constriction projects on acid slate within the watershed are approved, they should be required to monitor the pH of Karen’s Brook (or other streams that would receive the water) with remotely sensed automated instrumentation, and to be prepared to stop operations/add lime according to a pre-set protocol if a sudden fall in pH is detected.
___________________.
8. Sandy Lake Development Impact Assessment Final Report by D. Conrad et al. 2002 Biological Engineering Department, Dalhousie University
9. Acid mine drainage formation, control and treatment: Approaches and strategies. Jeffrey G.Skousen et al., 2018. The Extractive Industries and Society 6:241-249
3.6 Limnological Profiles
Profiles obtained in the early fall of 2017 and 2019 and late summer 2022 revealed low oxygen and elevated EC (salts) in deeper water (the hypolimnion)
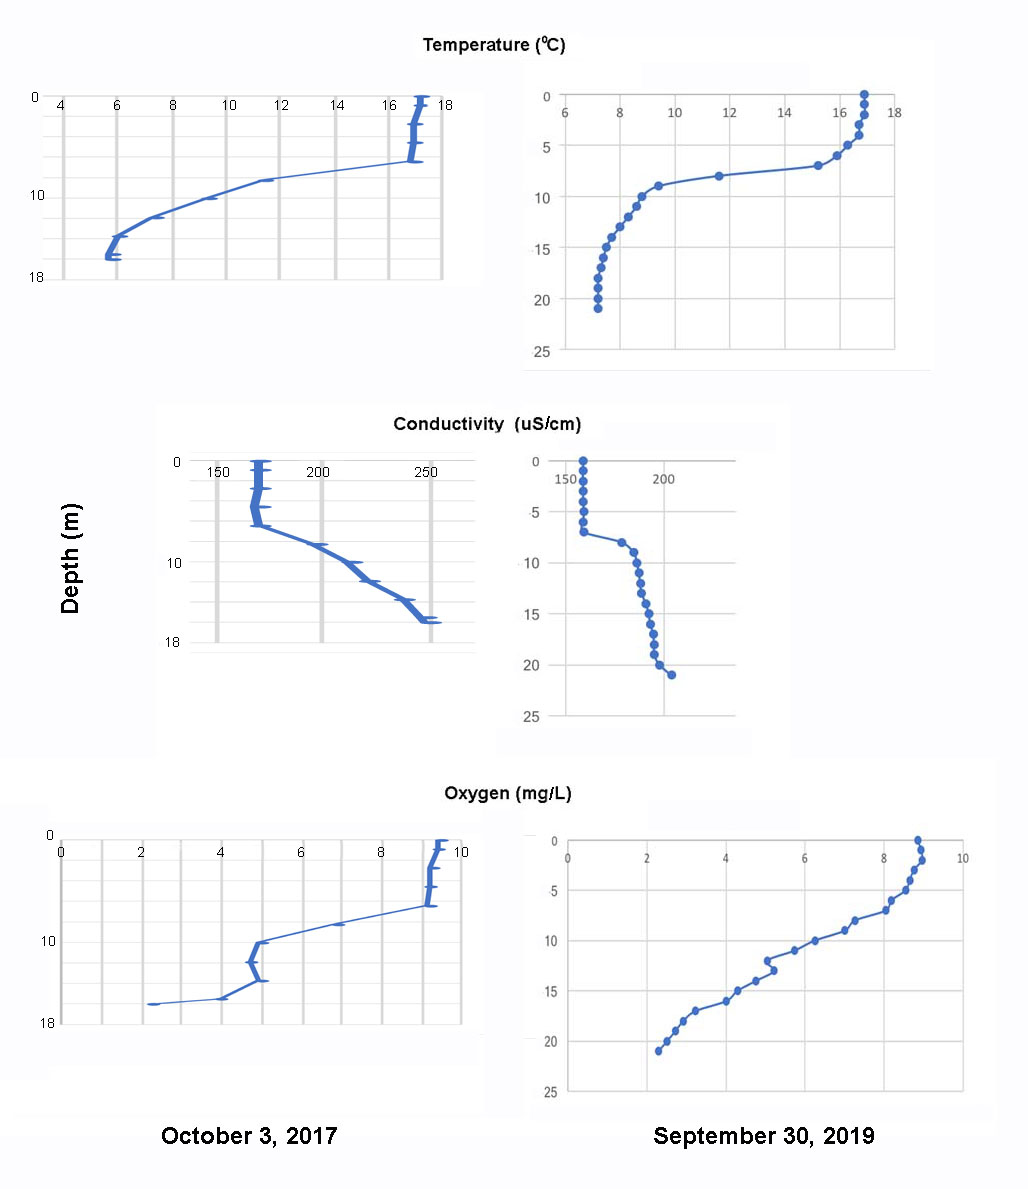
SL Fig 8. Profiles of temperature, EC and oxygen in the deepest area of the lake in 2017 and 2019. The 2019 profile was more precisely placed at the deepest spot (depth 21 m versus 17 m in 2018). Click on image for a larger version.
A set of vertical profiles of temperature, oxygen, EC and pH were obtained for 3 sites on Sandy Lake on Oct 3, 2017, using a Wet-pro Field kit borrowed from the Community Based Environmental Monitoring Network at St. Mary’s University. I had wanted to do the measurements in August to view summer stratification at its peak, but the equipment was not available then. Hence measurements were made on Oct 3 when the water column appears to have been in the process of “de-stratifying”.
Another profile was obtained by Ed Glover on Sep 30, 2019 (SL Fig 8 at right). The lake was still strongly stratified on that date; the deep water temperature was more than 1 degree above that observed in 2017. Update (Mar 18, 2023). Another set of vertical measurements was obtained on Aug 22, 2022. View Limnological Profiles for the detailed results.
The oxygen values are of particular note. The phosphorus models provide some prediction of lake conditions but the oxygen profiles give a more direct and description of the actual state of the lake. The three profiles indicated that the oxygen content of the deeper layers (2.25, 2.29 and 1.91 mg/L in 2017, 2019 and 2022 respectively) were below guidelines for both salmonids and more generally, aquatic life. (View Limnological Profiles). This state is consistent with AECOM’s conclusions based on Total P measurements that the lake is moving from an oligotrophic (nutrient-poor) into a mesotrophic state. (Mesotrophic lakes are richer in nutrients than nutrient-poor oligotrophic lakes but are not nutrient-rich eutrophic lakes in which oxygen is depleted in deeper layers.)
It seems that the profiles obtained in 2017 and 2019 and later are the only detailed limnological profiles for Sandy Lake. However there are comparable data from earlier dates for water samples taken at the surface and near the bottom at deeper parts of the lake:
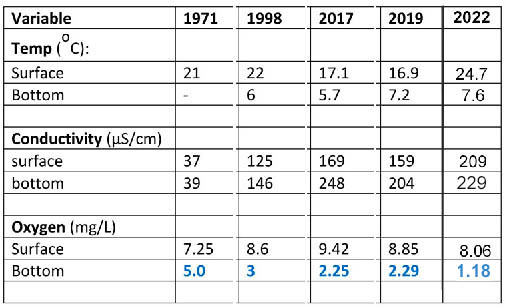
SL Fig 9: Historic Shallow and Deep Water Temperature, EC and Oxygen values Updated Mar 23, 2023
1971: from Metropolitan Area Planning Committee 1971-1972: Water Quality Survey for Selected Metropolitan Area Lakes. Lake sampled on Aug 30, 1971. Deep sample at 59 feet (18 m). Chloride was 8.0 at surface, 12.0 at 59 feet (18 m). EC and chloride were elevated in the Southern Inlet sample (57.0 µS/cm, 11.0 mg/L). 1998: Nova Scotia Lake Inventory Program Sep 2, 1998. Deep sample at 19 m. Chloride at surface was 29 mg/L at 19 m, 34 mg/L. 2017: Sampled Oct 3, deep sample at 17.5 m. 2019: Sampled Sep 30, Deep sample at 21 m. 2022 Sampled Aug 22. Two profiles, averaged the values (at 19,5 and 20m).
So at peak stratification in 1971, the oxygen level at the bottom was twice the values in 2017 and 2019. In 1998, the oxygen level (3 mg/L) was already well below that of 1971, but above the values we observed in 2017 and 2019. So the overall trend is clearly downward.
In 2017 the EC (electrical conductivity) of surface water had increased about 4.6 fold over 1971, and the bottom EC was 79 uS/cm greater than at the surface, compared to a difference of only 2 uS/cm in 1971.
The increases in EC in deepwater during lake stratification are concerning. As differences in conductivity/salt content between surface and deeper water increase, density stratification of the water column increases and at some point can impede seasonal turnover of the water column associated with temperature changes8, and thus re-oxygenation of the deeper layers; in turn that can require physical mixing to be rectified as at at Oathill Lake in Dartmouth.
____________________________
8. E.g., view Road Salt Impact on Lake Stratification and Water Quality by EV Novotny & HG Stefan. 2012. Journal of Hydraulic Engineering 138: 1069-1081; A reduction in spring mixing due to road salt runoff entering Mirror Lake (Lake Placid, NY) by B. Wiltse et al., 2020, Lake and Reservoir Management 36:109–121.
UPDATE Another profile was obtained on April 19, 2021. View Limnological Profiles. The lake had turned over.
3.7 Temporal Trends in EC (salt)
Electrical Conductivity (EC) of surface water samples from Sandy Lake has risen close to 4-fold since 1971, It is now approaching 200 uS/cm, reflecting increased settlement in the watershed.

SL Fig 10: Historical values of Sandy Lake EC (electrical conductivity). Values are for near surface samples on single days in each of the years shown, except for 2020 value which is a an average for values (11) over a whole year. View sources. (More values to be added from Appendix C of AECOM 2014 but that will not change the overall trend.)
Values of electrical conductivity (EC) in the area of 30-60 uS/cm are typical of pristine lakes in the Halifax region. 7 EC values for Sandy Lake were in that range in 1955 and 1971, and 1980 (not in 1977 however) but samples taken from 1985 onward were well above 100 with an overall upward trend. The low values in 1955 and 1971 are consistent with the lake being well below the mesotrophic range in those earlier years (AECOM 2014, as cited above).
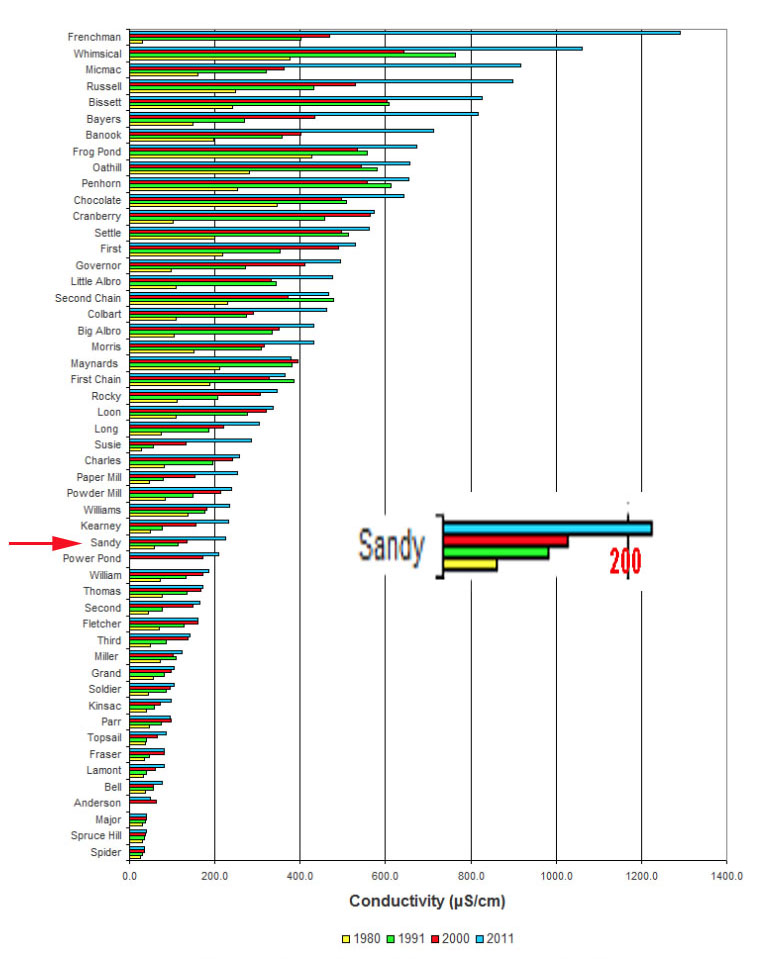
SL Fig 11: Historical EC values for selected Halifax-area lakes including Sandy Lake (enlarged in inset). From Clement, P.M. and D.C. Gordon. 2019, Fig. 5
Electrical conductivity (EC) tends to increase with urbanization.6 In Nova Scotia, our liberal use of road salt is blamed for much of the trend of increase in conductivity in EC of Halifax area lakes over the interval 1980-2000 as revealed in synoptic studies7:
There appears to have been a ‘salt signal’ for Sandy Lake as early as 1971:

SL Fig 12: EC and chloride values for two inlets, shallow and deep samples at the middle of the lake and at the outlet in 1971. From Metropolitan Area Planning Committee 1971-1972: Water Quality Survey for Selected Metropolitan Area Lakes.
The two inlet EC values were both substantially higher than the lake surface and outlet values, as were the chloride values. Chloride (but not EC) was elevated at depth compared to the surface.
Ogden 1971, cited in Mandell 1994, described Sandy Lake as belonging to his Category 2 : “Oligotrophic lakes showing increase in turbidity after a heavy rain and some influence due to road salting” (Other categories were 1 Highly oligotrophic, 3 Substantial cultural Influence.)
3.8 Spatial Variation in EC and pH
Four sets of data were obtained:
(i) In 2017, I routinely carried a pocket conductivity meter and frequently a pocket pH meterand made measurements on surface waters as I encountered them.
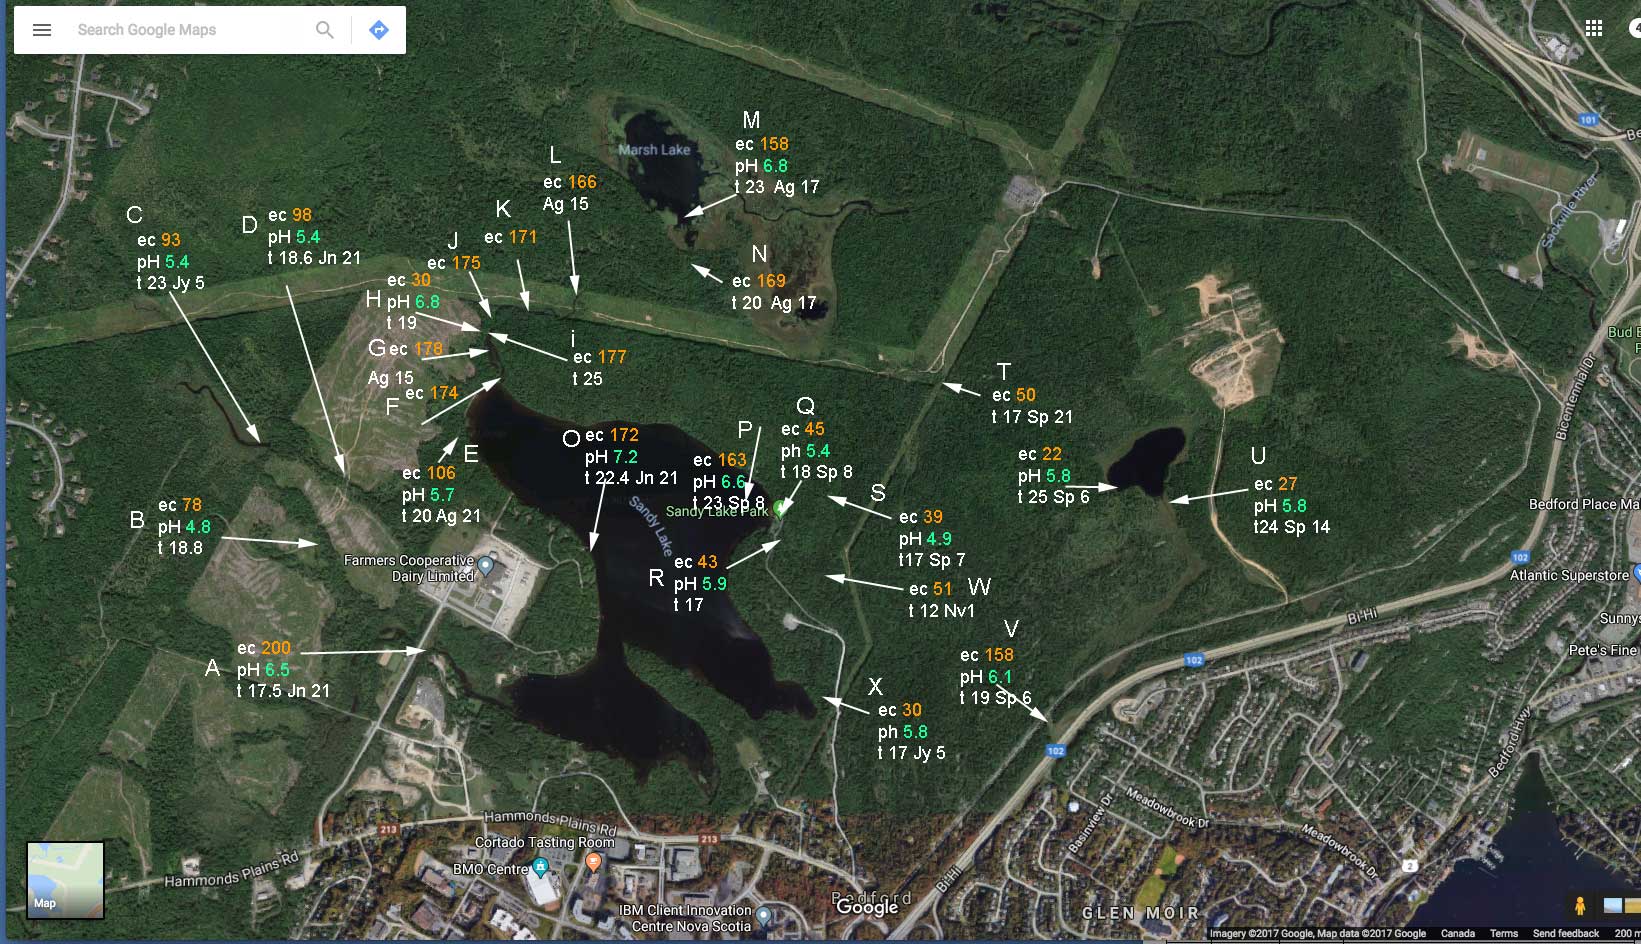
SL Fig 13: Values of electrical conductivity, pH and temperature for surface waters on various dates in 2017. Click on image for larger version
Higher EC values were observed for streams on the west side of the lake than on the east side of the lake. In general, the pH values for streams were lower than values for Sandy Lake (see also figure above) except for Bob’s Brook (also known as Johnson’s Brook; it enters the lake at the southwest corner of the lake) and for Upper Peverill’s Brook flowing to Marsh Lake. pH values for Sandy Lake were in the range 6.6 to 7.2, while EC values were mostly in the range 170 to 180. Streams on the east side of Sandy Lake had EC values in the range 30-51 uS/cm, pH 4.9 to 5.8. EC values for two streams on the west side were 78 and 98 uS/cm (pH 4.8, 5.4) likely reflecting some input of solutes from developments in the Gatehouse run/Lucasville Road area within the watershed.
(ii) On Aug 10, 2017, I paddled the perimeter of Sandy Lake and measured electrical conductivity (EC) at regular intervals, and occasionally pH.
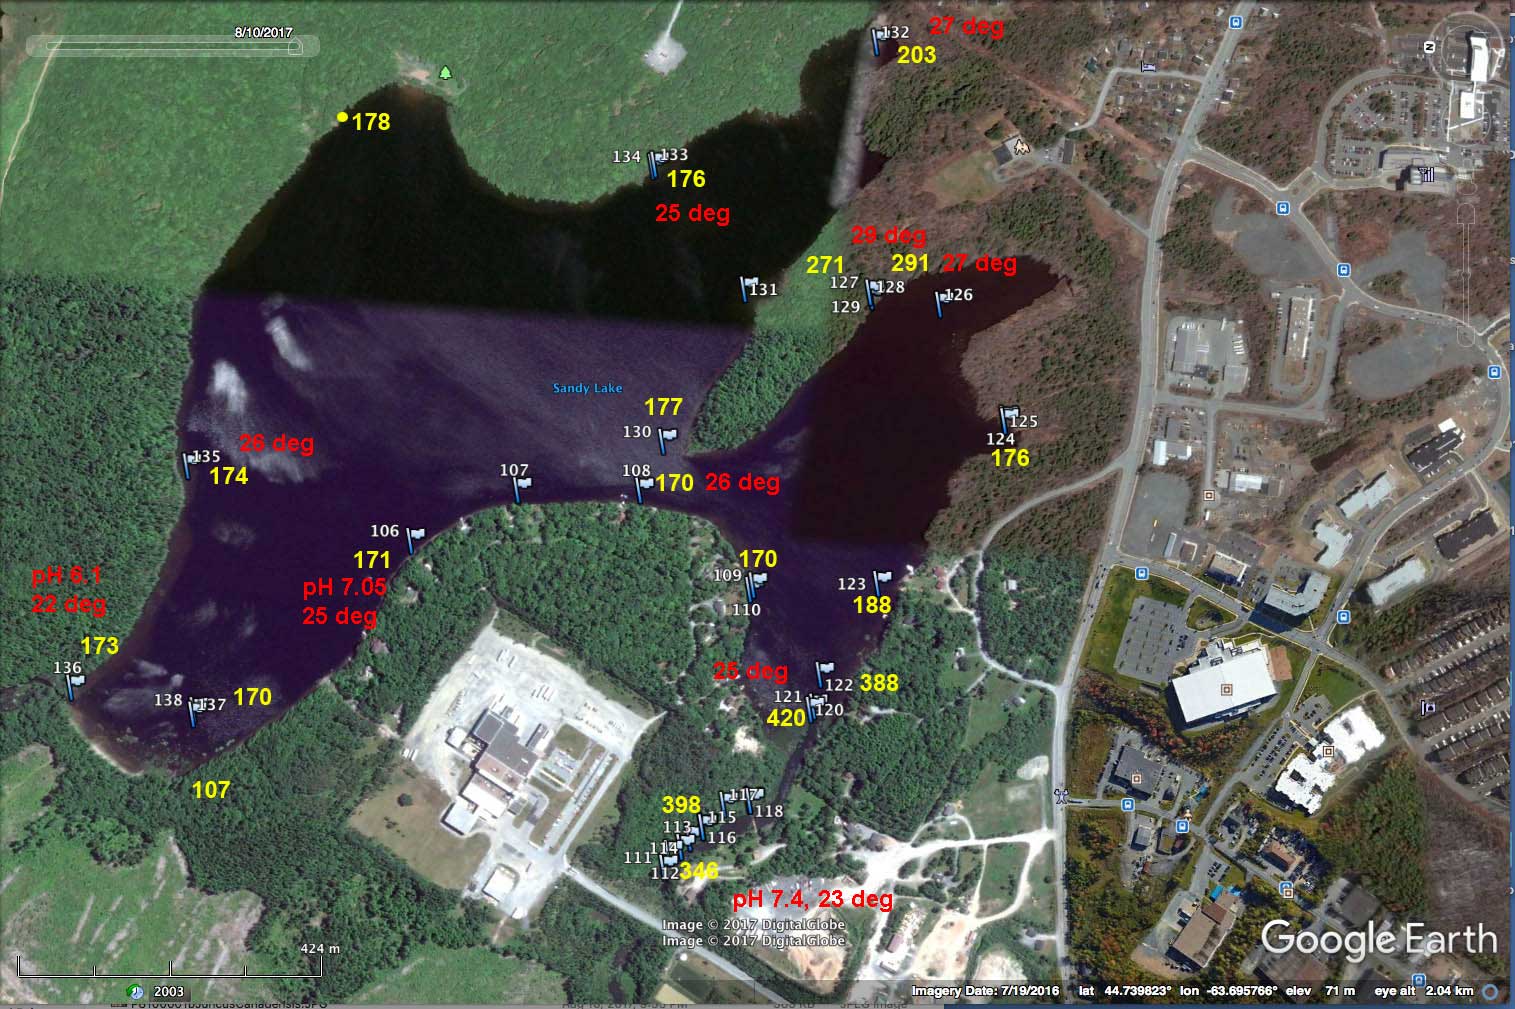
SL Fig 14: Values of electrical conductivity, pH and temperature at water surface at different locations on Sandy Lake on Aug 10, 2017. Yellow highlighted numbers are EC values in uS/cm
pH values for Sandy Lake were in the range 6.6 to 7.2, while EC values were mostly in the range 170 to 180 uS/cm. Elevated EC values (203, 271/291, and 420/398 uS/cm) occurred in three bays where streams draining settled areas at the south enter the lake. (view Stream Map).
(iii) To further investigate the origins of the high EC water coming into Sandy Lake via the SW Inlet, On Nov 8, 2018, I sampled three streams associated with Johnson’s Brook and where the convergent streams enter Sandy Lake via the culverts at its SW corner.
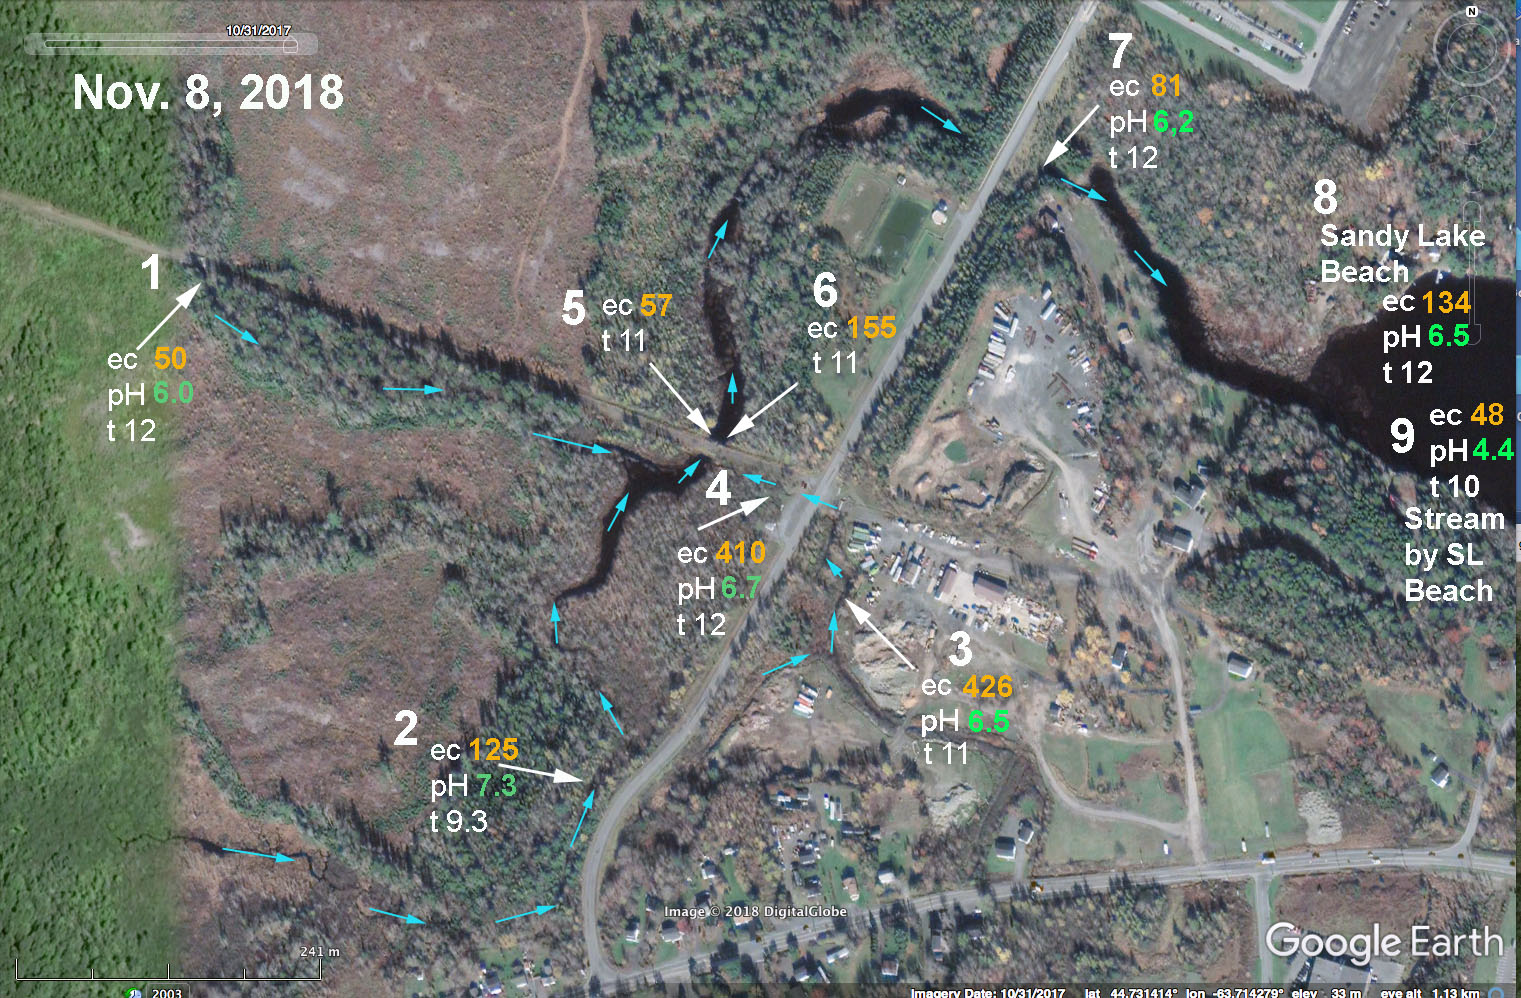
SL Fig 15: EC and pH values for streams associated with Johnson’s (Bob’s) Brook on Nov 8, 2018. #1 Upper Johnson’s Brook. #2 Stream receiving drainage from Uplands Park wastewater treatment area, also from streams south of Hammonds Plains Road. #3 and # 4: Stream draining construction/trucking yard and community just to the SE of the Dairy Road. These 3 streams converge in the area of sites 5& 6 and then water flows downstream to enter Sandy Lake through two large culverts at site #7. Nos 8 and 9 were taken at Sandy Lake Beach Park for reference. There were strong flows in the streams at sites 1 and 2. A steady but weaker flow was observed at site 3-4 (it crosses the road from 3 to 4 through a culvert and that water was very cloudy and had a lot of suspended material.
There was very high water flow at this time, but a clear salt signal was evident in two of the streams converging at “Murphy’s Pit“. One was the stream that receives drainage from Uplands Park wastewater treatment area (EC 125 uS/cm). Another was the stream draining the construction/trucking yard and community just to the SE of the Dairy Road (EC 410 uS/cm)). Water at the latter site was very cloudy and full of particulate material. This stream does not seem to have been identified as a significant source of pollutants in the AECOM (2014) study and should be further investigated. Samples were taken again at this site on Dec 13, and through the winter by a volunteer (B. Sarty). These continued to show a salt signal. View details under EC-pH and submenus for that page.
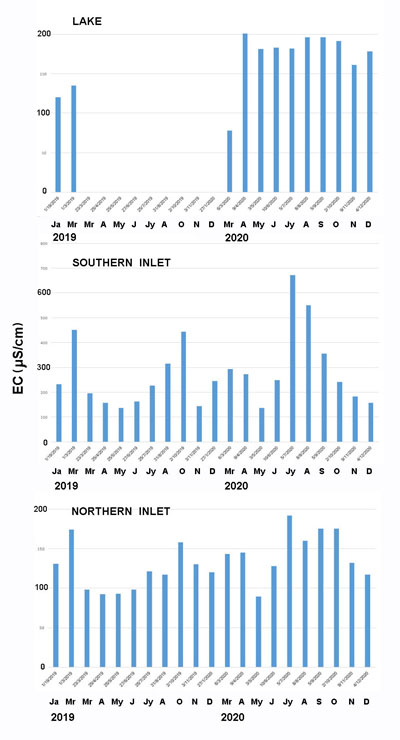
SL Fig 16. Seasonal EC values for Sandy Lake (top), and for streams at the southern (middle) and northern (bottom) inlets
(iv) Following those observations, local resident Bruce Sarty volunteered to take monthly samples for measurement of EC from the streams sampled above, and in Sandy Lake beginning on Jan 19, 2019. That sampling continues. In both 2019 and 2020, EC values of the incoming streams peaked in March, and consistently stream #4 (see figure above) had the highest EC. For stream #2 the peak values were 638 and 516 uS/cm in March or 2019 and 2020 respectively and for stream #4 1442 and 1744 uS/cm.
The values for water coming out of the culvert at the inlet (site 7) also peaked in October in 2019 (440 uS/cm) and in July (680 uS/cm) in 2020 (SL Fig 16). We would need measurements of flow to make more sense of these values, also water in the area of the big culvert at site 7 gets frozen over at times complicating sampling and interpretation. The October and July peaks might be due to a significant portion of the salt entering the streams via groundwater discharge (view Kelly et al., 2019), and/or concentration of salt during warmer months/lower preciptation. The low EC values (top chart) in early winter months are likely associated with winter stratification/ice-melt, i.e. they are not representative of the lake as whole.
Collectively the data illustrate that very high EC water is entering Sandy Lake at certain times. Continuous sampling of water EC on the Little Sackville River in 2015 illustrated peak values in March-April, and large day to day fluctuations.
(v) On Aug 20, 2020, I sampled several points on the watercourse south of Hammonds Plains Road in Bedford West sub-area 12 which receives drainage from Atlantic Acres Industrial Park and Harmony Park area; most of sub-area 12, while designated for development has not yet been developed. Some high values (>500 uS/cm) were observed, but there was not much water movement at that time. There were some significant rainfalls towards the end of September, recharging most streams. On Oct 2, 202o with the assistance of Bruce Sarty, I conducted a more comprehensive sampling of Johnson’s Brook and all of its tributaries, also Karen’s Brook, Sandy Lake at 2 places, and two streams draining non-developed, forested land on the east side of Sandy Lake:
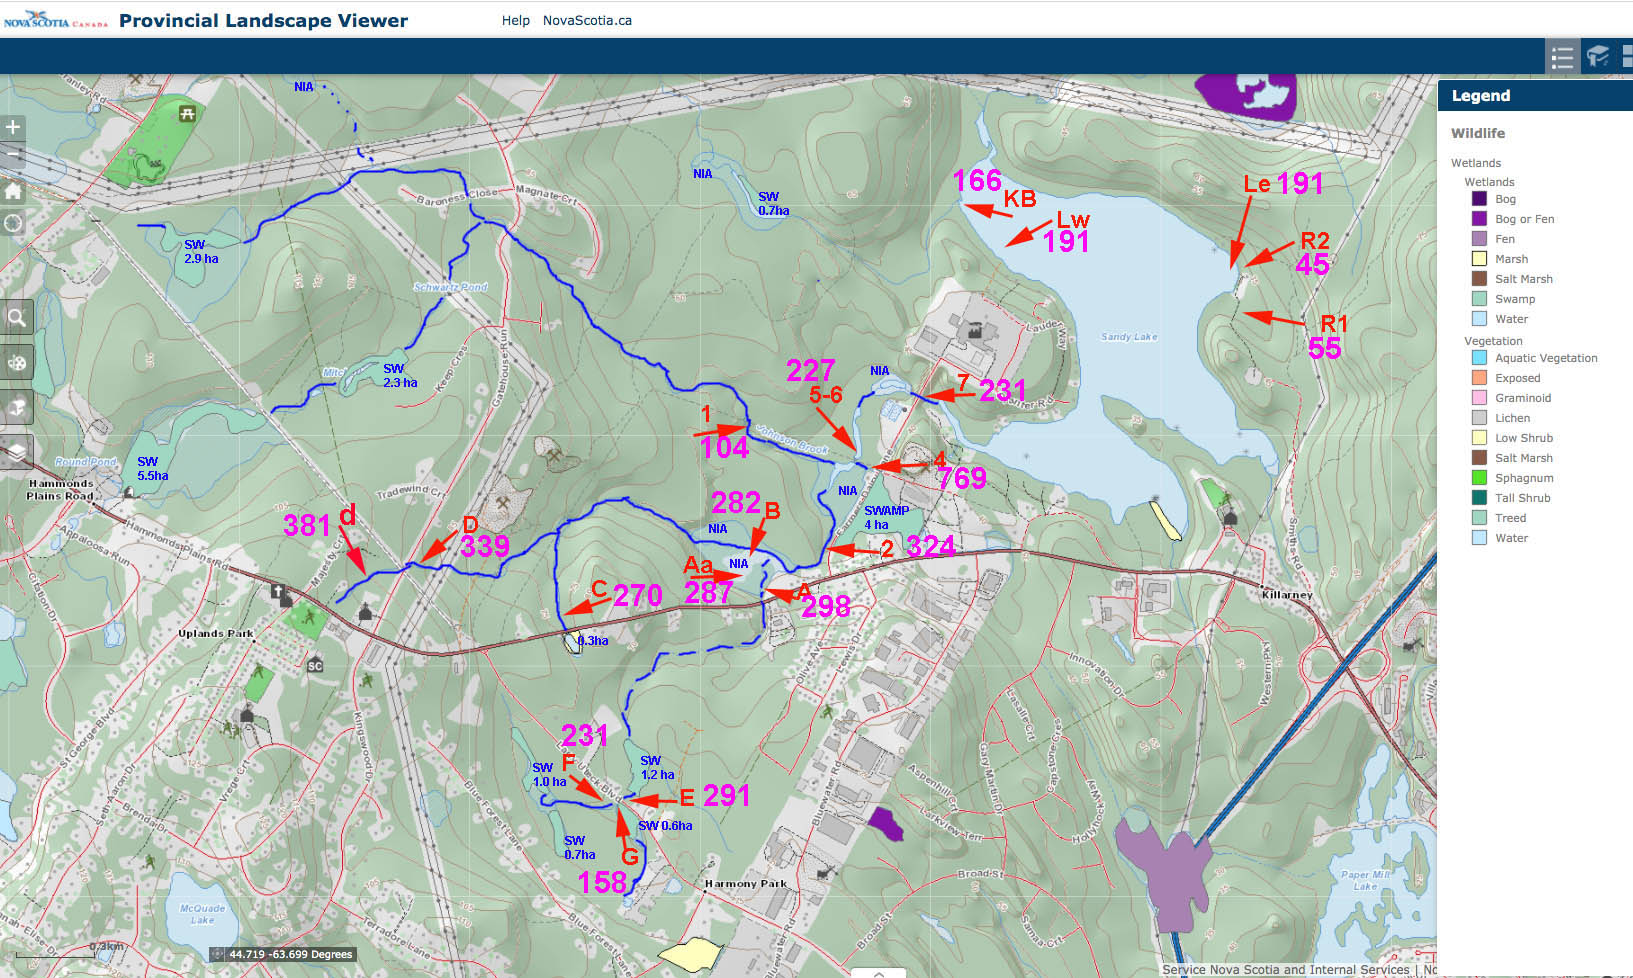
SL Fig 17: EC values of streams that feed the major inlet to Sandy Lake on Oct 2, 2020. Samples were also taken at the mouth of Karen’s Brook (“KB”), on the west (Lw) and east (Le) side of Sandy Lake and from two streams on the east side of the lake. Map is from the NS Provincial Landscape Viewer (PLV). Streams converging at the southeast corner of the lake are highlighted (dark blue). Numbers in purple are the Electrical Conductivity values (uS/cm). SW= swamp as identified on the PLV. NIA=”No Information Available” as cited on the PLV. Point “d” is a few meters from the outfall at the Uplands Park Waste Water Treatment Facility
The two streams sampled on the east side of Sandy Lake had EC values of 45 and 55 uS/cm; these drain intact, forested landscape. The highest values are for streams coming from south of HPR (Hammonds Plains Road) (298 uS/cm), and from the southwest/Upland Park water water treatment facility (282 uS/cm); those converge and the value increases after the stream passes by more settled landscape to 324 uS/cm; and the stream draining the swamp just east of the dairy road again had the highest value of all, 769 uS/cm. Bob’s Brook has a value of 104 uS/cm, and Karen’s Brook 166 uS/cm, those draining areas that are settled at their extremities. The mix where it entered the lake was 231 uS/cm, and the lake itself 191 uS/cm.
Based on the EC values of the lake water, water from intact landscape on the east side of the lake, and values for the major inlet at the southwest corner of the lake, it is estimated that over 2/3 and as much as 78% of the water going into Sandy Lake enters via that inlet and/or from areas now partially settled.
SL Fig 18: Google Earth Image (Sep 5, 2015) showing clearcuts and forested riparian buffers. Arrows on the lake point to major inlets
3.9 Clearcutting & Other Physical Disturbances
Approximately 200 acres of mostly multi-aged/old growth forest on the west side of Sandy Lake were clearcut in 2013. The clearcut crosses Johnson’s Brook and Karen’s Brook and some of their tributaries which enter the lake at the southwest and northwest respectively. According to a resident by the lake, there was no noticeable siltation of the lake from this clearcut. However, visual observations in 2017 revealed large accumulations of woody debris/mineral debris around the mouth of Karen’s Brook, extending on the shore towards Peverill’s Brook. This contributes to further eutrophication and may have caused some shallowing and more growth of emergent aquatic plans (fringing marsh) along the beach at the northwest corner of the lake. View details. It’s likely that there was a similar flow of debris into Johnson’s Brook &/or its tributaries.
Recent examples of other physical disturbances associated with OHV tracks, clearing close to the lake, and disturbance of a wetland are cited in a post on this website: Accelerated erosion not helping our treasured lakes 17Jan2021.
3.10 Coliforms and algae
Sandy Lake has a reputation as a ‘clean lake’, e.g.,
Drinking Water Quality
The primary sources of drinking water for local residents and cottagers are groundwater from drilled and dug wells and the water of Sandy Lake. Until a couple of sewer breaks that occurred on the sewer main near Giles Drive in 2000 and 2001, residents had no problems with water quality (for drinking or swimming); in fact, they were proud of the high quality of their water. The municipality issued boil water and no swimming advisories following the sewage leaks. – Sandy Lake Community Profile, Dalhousie School of Planning, 2002
However, all tests (2007-onward, view CF Fig 4) have shown coliform bacteria to be present, and so the water is considered non-potable by NS and Canadian standards.
While test results compiled in AECOM (2014) show all tests to be well within the standards for recreational waters (2007-onward, view CF Fig 4) and there has been only one beach closure due to bacteria in recent years(in 2013), an in-depth study by McDonald (2016) revealed some high coliform values in the post-open beach season. These were associated with high turbidity/storms. According to AECOM (2014) “The [The Uplands Park Wastewater Treatment Facility] facility may overflow and bypass the treatment cycle during storms or malfunctions” so that is a possible explanation (view Coliform Notes).

Sandy Lake Beach at 11:13 am on Aug 6, 2019. “an unpleasant, suspended, reddish, soapy material” appeared quite suddenly and the beach was closed.
A very unpleasant algal bloom appeared on Sandy Lake of Aug 7, 2019 – I happened to be there, in the water, at the time and documented and reported it. It had largely dissipated within 2 days and the Risk Advisory was lifted. HRM reported that “the specimens identified in the lab were principally diatoms (a form of algae), with trace amounts of one species of cyanobacteria that does not produce any toxins.” Also view Cyanobacteria Notes.
It’s still not completely clear what caused the bloom, but its co-occurrence with a sudden drop in lake water level is suspicious – see Aug 7 2019 Post). A plausible explanation (by analogy with effects of rapid lowering of water level in reservoirs, Nowlin et al., 2004): there was high total P in the hypolimnion; disturbance of the thermocline associated with the rapid water movement resulted in a flush of the deep water phosphorus being released into surface waters; the bloom began quickly and once the water movement stopped, dissipated quickly. Transient disturbance of stratification in the summer period by wind was recognized as a potential issue at Mirror Lake, NY when spring turnover is impaired in some years by winter salt loading (Wiltse et a;., 2020). An extreme summer wind event could likewise be a threat at Sandy Lake and cause an algal bloom as in 2019.
This appears to have been the first incidence of an algal bloom causing beach closure at Sandy Lake. Algal blooms have been on the increase in Nova Scotia at large, less so in Halifax Co. (HRM).
….due to influencing factors like eutrophication from mink farms, climate change, and potential lake recovery from acidification, blooms, even toxic blooms caused by cyanobacteria, have not been unusual to the province within the last decade…Algal blooms have even been reported in Halifax County, albeit only in recent years. Algal blooms were reported at Powder Mill Lake in Waverley in 2016, and in Oathill Lake in Dartmouth in 2017 – Betts 2018
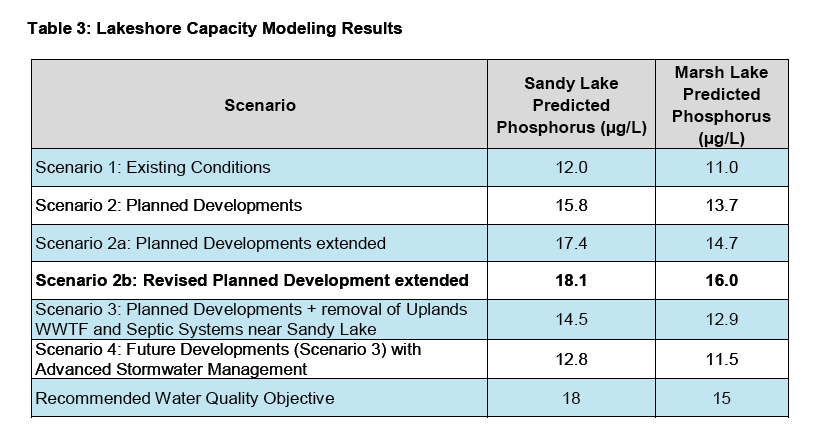
4.1 AECOM 2014 Predictions
AECOM 2014 used Brylinski’s (2004) version of the Lakeshore Capacity Model (Dillon and Rigler, 1975) to predict the impacts of proposed development in the area of Sandy Lake on Total Phosphorous. From the Executive Summary:
Phosphorus is identified as a key water quality parameter to assess the trophic status of the lake.
Historic water quality samples and water samples collected during the course of this study were used to identify water quality objectives for parameters that are influenced by development. The water quality in Sandy Lake and Marsh Lake is currently being affected by urban development in the water as displayed by the increasing phosphorus concentration in Sandy Lake. Both Sandy Lake (12 µg/L) and Marsh Lake (10 µg/L) have median phosphorus concentrations that place them in the lower end of the mesotrophic range. Water quality objectives and early warning values are set at 18 µg/L and 15 µg/L for Sandy Lake and 15 µg/L and 13 µg/L for Marsh Lake respectively.
SL Fig 19. AECOM 2014 Water Quality Objectives for Total P.
From AECOM 2014, p XX

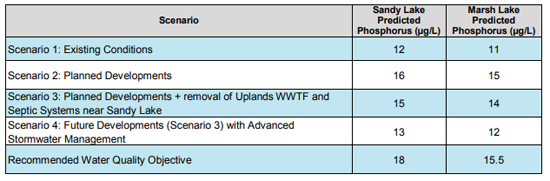
Cumulative impacts of development on phosphorus concentrations are predicted to increase to 16 µg/L for Sandy Lake and 15 µg/L for Marsh Lake when mitigation measures to decrease phosphorus loading are not implemented. These levels are above the early warning values, but below the water quality objectives. Removing point sources of phosphorus such as the Uplands WWTF and septic systems near Sandy Lake by connecting them to municipal wastewater services decreases the predicted phosphorus concentrations to 15 µg/L and 14 µg/L for Sandy Lake and Marsh Lake respectively. Additional phosphorus mitigation measures using advanced stormwater management that reduces phosphorus runoff by 50% is predicted to decrease the phosphorus concentration of Sandy Lake to 13 µg/L and of Marsh Lake to 12 µg/L.
SL Fig 20 AECOM 2014 Predictions of Total Phosphorus.
From AECOM 2014, p XX
The predictions from the phosphorus load model are consistent with observations of urbanization in other watersheds. However, the degree of influence of urbanization on water quality in Sandy Lake can only be approximated using the phosphorus load model because of limitations arising from assumptions and uncertainty in the application of the model. Therefore a robust water quality monitoring plan is proposed for the Sandy Lake watershed to provide a further assessment of current conditions and to evaluate the impacts of development on the water quality.
4.2 Critique of Predictions/No Followup Monitoring
(i) As cited by AECOM (2014), modelled phosphorus concentrations differed by far more than 20% of the measured concentrations (it was 67% higher), indicating the model is not valid, but the recommended procedures to revise the model were not followed. More Details
(ii) Setting the Water Quality Objective (WQO) for Total P in Sandy Lake at 50% above the “current value” rather than at the “predevelopment level” is not justified.More Details
(iii) AECOM 2014 cites evidence showing that in its current state (at 12 ug P/L ), Sandy Lake is already seriously degraded. More Details
(iv) Varying the phosphorus export coefficient, rather than increasing the lake retention coefficient would be a more realistic “fix” to make the model work and would likely increase the predicted impacts of development on Total P. More Details
(v) Further monitoring, as strongly advised by AECOM 2014, has not been conducted. More Details
4.3 Relevance of information gathered or made available after 2014
Information gathered or made available after 2014, as documented above, provides further evidence that the lake in its current state is in a highly precarious condition. In summary, it includes the following:
(a) Low oxygen in deep water. Our observations in 2017, 2019 and 2022 illustrate that deep-water oxygen levels were approximately half of the value observed in 1971 and were below levels required by salmonids.* This difference is consistent with the lake having moved from an oligotrophic state to a mesotrophic state, and raises concern that the elevated deep water Total P levels noted by AECOM (2014) for two of three samplings in 2008, 2010 and 2011 is likely recurring and thus speeding eutrophication.*View this update: Deep water oxygen levels in Sandy Lake (Bedford, NS) fall to precariously low levels (Post, 21Mar2023).
(b) Climate warming The lakes of the Halifax Region are well studied, the classic studies on the impacts of acid rain by Eville Gorham & Co. and on trophic status of lakes by Joe Kerekes & Co being of international repute. Sandy Lake is one of the 51 lakes included in synoptic studies that began in 1971 and that have involved sampling on a single date every 10 years (we are due for the next one this year). Ginn et al., 2015 made use of that database to explore the use of paleolimnological techniques to set management objectives for lake management. From their paper:
Diatom assemblages from lake sediment cores were used with “top” (recently deposited, surface) samples being matched to measured limnological conditions, and “bottom” (generally from >15 cm deep) samples used to infer pre-disturbance limnological conditions such as pH, total phosphorus (TP), specific conductance, and shifts due to changing climatic conditions.”
All 51 study lakes have experienced floristic changes in diatom species composition since pre-disturbance times, but different environmental stressors were implicated:
8 of the 51 lakes underwent significant…decreases in diatom-inferred pH;
8 lakes had significant increases in diatom-inferred TP;
19 otherwise relatively pristine lakes had increases in planktonic taxa consistent with observations linked to changes in lake seasonality and limnological changes most closely linked to climate warming in Nova Scotia and other regions.
The remaining 16 lakes did not have large and consistent changes in diatom flora or changes in diatom-inferred TP or pH…
Sandy Lake was one of the 19 with observations most closely linked to climate warming.
The sampling was conducted in 2005/6, when the lake was still in the early stages of movement from an oligotrophic to a mesotrophic state and pH had recovered from what was likely a transient period of acidification associated with acid rain. So the diatom inferred changes are consistent with observations cited above in regard to pH and Total P. However, Sandy lake, evidently, has already begun to respond to climate warming.
As noted in the SLCA Response to AECOM (2014), rising temperatures add to the stresses on Sandy Lake, particularly by reducing oxygen solubility (e.g., see Missagi et al., 2017) and increasing the stability and/or length of summer/early fall stratification (see e.g, Pila et al., 2020). Rising temperatures are also more conducive to cyanobacteria (blue-green algae) blooms (Johnk et al., 2007). Both put a higher premium on maintaining as high oxygen levels as possible in the hypolimnion, i.e. on moving the lake back to an oligotrophic state.
(c) Algal Bloom The algal bloom in 2019, still not common in the Halifax area, is further evidence of the precarious state of Sandy Lake. The coincidence of the bloom, in mid summer, with the take down of a beaver dam and a rapid reduction in lake water level is suspicious and is suggestive of high hypolimnion Total P.
(d) Road Salts
Rising levels of salt in Sandy Lake are highly concerning. Currently, levels are below the the CCME Guideline for long term exposure (120 mg/L chloride) which is also the WQO for chloride cited by AECOM (2014) for Sandy Lake. There is some salt stratification and it appears to be intensifying with time. At some point salt stratification could impair normal spring turnover if it is not already doing so in some years.
The CCME guideline for choride ion for the protection of aquatic life is 120 mg/L for long term exposure, and 640 mg/l for short term exposure, corresponding approximately to EC values of 470 and 2410 uS/cm respectively, using the conversion formula given in AECOM (2020).
The current value for water at the surface of Sandy Lake is approaching 200 uS/cm, well above its pristine state (about 40 uS/cm), and still well below 470 uS/cm but the trend is clearly upwards. Values in streams entering Sandy Lake that drain settled areas are frequently above 470 uS/cm. In our monthly monitoring, the highest stream value was 1744 uS/cm, still below the short term toxicity level (~2410 uS/cm), however it’s quite likely that continuous monitoring would reveal spikes in the acute toxicity range (2410 uS.cm and above, see data for Little Sackville River).

SL Fig 21. EC values for water at the surface and near the bottom in the deepest area of Sandy Lake over 50 years, observations in late summer/early fall.
The increase in hypolimnion EC/chloride compared to the surface water in Sandy Lake is potentially a more serious threat from road salts than posed by toxicity of chloride.
If the increase continues it could impair normal turnover of the lake, most likely the spring turnover, if it has not already.
Impairment of spring turnover reduces oxygenation of deep water which can have highly adverse effects, including increased release of phosphate from sediments (“internal phosphorus loading); increased mobility of metals such as cadmium, lead, chromium; and reduced biodiversity of benthic and other aquatic communities of a lake (Novotny 2012).
Currently, our limited observations indicate that deep water oxygen levels are dropping below limits for salmonids during summer/early fall, while data presented in AECOM (2014) suggests that deep water oxygen has at times dropped to levels sufficient to mobilize sediment phosphorus.
While it is well documented from the synoptic observations on 50 HRM lakes that salt levels in HRM lakes are increasing and are highest in lakes in more settled areas (SL Fig 11 above), there has been little or no highlighting of the possible longer term effects on turnover of stratified lakes in provincial and HRM documents – until very recently (Re: AECOM 2020). Even on a North American scale, it’s hard to find more than a dozen or so papers documenting the phenomenon, although it is now commonly cited in reviews on impacts of road salt as a concern (e.g, Dugan et al., 2017; Hintz and Relyea, 2019).
I am aware of only one situation in NS for which there is well documented evidence that salt stratification has impaired normal turnover. Oathill Lake in Dartmouth is a small lake (some stats: surface area 4.2 ha, watershed 33 ha, max depth 8.5 m, average depth 3.6 m) situated in a highly settled area. It ranks 9th amongst the 51 lakes in the synoptic surveys in regard to surface water EC on April 7, 2011 (Sandy Lake is # 32) – see Fig SL 11 above. A slide set on Oathill Lake Restoration posted on the HRM website provides an overview of recent history of the lake, and results of monitoring including vertical profiles. It is a popular lake for swimming and fishing. In 2009 extreme coliform counts and the lake “turning brown” raised alarm bells and volunteers they began regular monitoring. In 2017, deep water EC was circa 1200 uS/cm March through October, compared to values in the range 250 to 550 uS/cm on the surface; there was apparently, no spring turnover, but the lake turned over at the end of October and the deep water EC level fell abruptly. Road salts were the major sources of EC, but release of ions from anoxic sediments also contributed. Solar powered Aquago devices were installed to aerate deeper waters without disrupting the hypolimnion with some very good results. It is a complex story, but surely makes the point that if it is possible to avoid reaching such a state in the first place, that is a far more preferable option.
I have cited* salt stratification as related in some way to Williams Lake (63 ha, max. depth 20 m) on the Halifax south mainland not turning over by early December in 2015, but it is not clear how they are related. There was a sharp gradient in oxygen and EC at 7-9 m; the hypolimnion oxygen was only 1-1.3 mg/L (12.1-12.3 mg/L in the epilimnion). The difference in EC between the epilimnion (277-281 uS/cm) and bottom (307 uS/cm) was not large and was very unlikely to be sufficient to inhibit mixing. The higher EC values in the hypolimnion could be attributable to mobilization of ions under low oxygen. As at Sandy Lake, streams draining settled areas had high EC values (282-427 μS/cm where they enter the lake) and streams draining natural areas very low values (34-59 μS/cm); the lake value at the outlet, circa 290 uS/cmm reflected the significant influence of water from settled areas.
____________
* Water quality measurements on Williams Lake and Colpitt Lake (Halifax, N.S.) Dec 7-13, 2015 with reference to possible impacts of road salt, DG Patriquin, 2016., Report to Williams Lake Conservation Company.
Other than these two examples, I am not aware of any other documentation of possible or probable impairment of turnover of NS lakes related to road salts, but it must be occurring.
“Chloride enrichment” is highlighted as one of four Key Water Quality Concerns recommended to be investigated/monitored as part of a renewed Water Quality Monitoring Program for HRM, as cited in the recently released report Halifax Regional Municipality Water Quality Monitoring Policy and Program Development (AECOM 2020). The others are Eutrophication, Bacteria Contamination and Invasion of Non-native Aquatic Species. The focus for chloride is on toxicity but it is acknowledged that “In extreme cases, high chloride concentrations can increase the density of bottom water to such an extent that it prevents lakes from mixing (called meromixis). Meromixis can cause anoxia that leads to impacts on habitat for aquatic biota and the release of nutrients and other chemicals from sediments (i.e., internal loading) that can contribute to eutrophication.”
Sandy Lake is one of 25 Priority Lakes recommended in the AECOM (2020) Report for regular monitoring to represent one or more of three Water Quality vulnerabilities – chloride, eutrophication and bacteria, the criteria being as follows:
Priority Eutrophication Lakes – lakes with elevated surface water TP concentrations during the ice-free period that are indicative of eutrophic conditions (i.e., >20 μg/L) based on a high-level review of monitoring data from select sources, and lakes with documented past issues with algal blooms or nuisance aquatic plant growth.
Priority Chloride Enrichment Lakes — lakes with elevated spring surface water chloride concentrations (i.e., >100 mg/L) that are approaching the Canadian Water Quality Guideline (CWQG) of 120 mg/L for long-term exposure for freshwater aquatic life, based on a high-level review of monitoring data from select sources.
Priority Bacteria Contamination — lakes with municipal beaches where HRM provides supervision due to human health risks from recreational body contact with water.
By these criteria, two vulnerabilities – Eutrophication and Bacteria – but not Chloride apply to Sandy Lake.
This underscores a key question:
How large a difference in EC/salt content between the hypolimnion and epilimnion is required to impair turnover?
It should depend the on same site-specific factors that affect thermal stratification, and on other factors.
Individuality is a prominent characteristic of the observed patterns of thermal structure and is governed strongly by climatic variations, volume of inflow and outflow in relation to the volume of the basin, basin configuration, surface area of the lake, position of the basin in relation to wind action, and other factors… In most lakes, salinity gradients are insufficient to increase stability to a point where where wind energy does not cause holomixis. A large number of lakes, however do exhibit temporary or permanent meromixis as a result of salinity gradients. In such cases, the term concentration stability, in contrast to thermal stability of lakes is…more appropriate (R. Wetzel 2001, Limnology 3rd Ed., p 80-83)
The effect of differences in temperature on water density (and hence on stratification) are much greater at higher temperatures (circa 20 degrees) than at lower (circa 5 degrees), but temperature has a relatively small effect on how solutes affect water density (view example). For typical temperate, dimictic lakes, the larger impact of salts on density at low temperatures, together with high salt input in winter months results in concentration stability being more likely to impair spring turnover than fall turnover (Novotny et al., 2008, 2012); or for spring turnover to be the first affected as concentration stability increases in a lake.
Impairment of spring turnover but not fall turnover appears to the case for most instances in which impaired mixing has been reported, i.e. with increasing salt loading, the mixing regime progresses from dimictic (spring and fall turnover) to monomictic (fall turnover only); with further increase in concentration stability a lake could become meromictic (permanent incomplete mixing).
For 9 lakes affected by salts, Novotny 2008 noted that 5 lakes appeared to have stronger chemical stratification than the other four and that these five had the smallest surface area to depth ratios (0.3-3.3, compared to 3.5 to 7.6 for the 4 lakes with weakest salt stratification. (The Surface Area to volume ratio Sandy Lake is 3.6). Novotny commented that ” a very similar parameter, the lake geometry ratio defined as the ratio of maximum lake depth to the fourth root of the lake surface area was introduced (Gorham and Boyce, 1989) as an indicator of the strength of temperature stratification of lakes.”
In addition to the factors summarized above, Novotny (2012) describes how patterns of ice formation, snow melt etc. can determine whether a particular concentration gradient will impair turnover.
There is one report, and the only one of which I am aware, of spring turnover being impaired at chloride levels below the CCME guideline for chloride ion for the protection of aquatic life (120 mg/L, or approx. 470 uS/cm by the AECOM 2020 formula) for long term exposure:
A reduction in spring mixing due to road salt runoff entering Mirror Lake (Lake Placid, NY) by B. Wiltse et al., 2020, Lake and Reservoir Management 36:109–121.
Recent EC values for Sandy Lake during the summer stratification are similar to those cited for Mirror Lake in summer which is of similar size and depth to Sandy Lake; spring sampling in Sandy lake could reveal impairment of normal spring turnover in some years as at Mirror Lake – view Mirror Lake – Sandy Lake comparison.
EC values of incoming streams at Sandy Lake are well above lake values, and the seasonal sampling of streams suggests the ground water could have high values. Thus we should be concerned about the possibility of salt stratification at Sandy Lake impairing spring turnover even before chloride values exceed CCME guidelines for long term exposure. Indeed it’s possible that spring turnover at Sandy lake has already have been impaired in some years. Climate warming could make the impacts worse by strengthening and/or prolonging summer stratification (e.g., view Hadley et al., 2014, Niedrist et al., 2018).
While Best Management Practices can reduce salt loading and the impacts on lakes (e.g., view Bubeck and Burton, 1989), it’s clear that the major anthropogenic determinant of salt loading is the percentage of a watershed that is settled/hard surfaces. From a recent, comprehensive review (Dugan et al., 2017):
Results … revealed that impervious land cover and road density surrounding each lake were the primary classification splits and the most important predictors for lake chloride trends and cluster grouping
In North America, specifically in the Midwest and Northeast, local salt application leaves freshwater lakes vulnerable to salinization. Of the 284 lakes in the NALR, 26 already have a chloride concentration above 100 mg L−1 at their last sampling date. The median impervious land cover within a 500-m buffer surrounding these 26 lakes is 24.8%, compared with the US mean 0.31%. If a linear relationship between time and chloride concentration is extrapolated, 47 lakes are on track to reach 100 mg L−1 by the year 2050, and 14 are expected to surpass the EPA’s aquatic life criterion concentration of 230 mg L−1 by 2050 (Fig. 4B). This is also the concentration at which a deterioration in drinking water taste is perceptible.
Hammonds Plains Road is an increasingly busy major road with low spots that drain into Sandy Lake, and new development has been approved within Bedford West sub-area 12 which also drain into Sandy Lake. Those developments alone will increase salt loading on Sandy Lake. Major new development north of Hammonds Plains Road/west and southwest of Sandy Lake would lie much closer to the lake and major inflowing streams and could result in quite rapid and severe further deterioration of Sandy Lake.
The rising salt levels in urban lakes and rural lakes impacted by large highways all over North America is proving to be a very difficult trend to reverse. While the salt itself is an issue, salt is also a proxy for a host of other materials associated with urbanization and highways that negatively impact lakes such as nutrients associated with use of fertilizers, and nutrients and organics from pet pooh.
4.4 Some questions, and comments on further monitoring
Some questions arising from this review of what we know (and don’t know) about Sandy Lake:
To what extent have the following contributed to date to the apparent fall in deep water (hypolimnion) oxygen
– increased loading of organics associated with more urban influence as the watershed becomes more settled;
– increased loading nutrients, e.g. from garden fertilizers and pet pooh likewise associated with more urbanization;
– impairment of spring turnover elicited by salt loading in some years, also associated with more urbanization?
How is the difference in salt content between the epilimnion and hypolimnion that we have seen in summer profiles developing?
– Is high salt content water entering Sandy lake flowing as a layer on the bottom into deeper waters?
– Is salt accumulating (becoming more concentrated) in the sediments in the hypolimnion in Sandy Lake?
– Is high salt groundwater entering the lake/the hypolimnion directly?
How are the watercourses with their wetlands affecting movement of sediments and organics and nutrients (particularly phosphorus) into Sandy Lake?
– In particular, is there significant removal of phosphorus from urban sources as it moves through watercourses to Sandy Lake?
The monitoring that I and volunteers have been conducting since 2017 has been very informal, low-tech and opportune in nature. Clearly, more formal and rigorous monitoring both temporally and spatially is required to begin to answer these kinds of questions.
In this regard it is very encouraging that HRM is giving serious consideration and thought to a renewed lake sampling program, and to view the recently released report for HRM by AECOM (2020). In that report, it is suggested that Sandy Lake be a priority lake for monitoring.
Some components of the monitoring that would apply to Sandy Lake as a Class A/High Vulnerability Lakes as cited in AECOM (2020):
The core monitoring design is focused and includes monitoring of a single, fixed station in a central deep lake location, once in spring during mixed-water column conditions and once at the end of summer; additional stations for lakes with complex morphometry/distinct basins.
Frequency and Timing: 2-year rotation
Class A – High Vulnerability Lakes have 2 sampling events per year at each lake
o once in spring during mixed-water
column conditions
o once at the end of summerRoutine monitoring parameters are selected that provide strong indicators of eutrophication and chloride enrichment that can be compared against numerical objectives and targets. Routine parameters include:
• Secchi depth;
• Lake depth at the sampling location;
• Profiles of field measurements at 1-m depth intervals from the lake surface to 1-m off the lake bottom for standard parameters (i.e., temperature, pH, dissolved oxygen concentration, specific conductivity);
and
• TP concentration and Chlorophyll a (as a euphotic zone composite).Additional parameters or sampling that may be triggered to further assess water quality issues and inform potential modeling exercises, include:
• Chloride concentration — to be analyzed in a discrete sample collected at one metre off the lake bottom (1 MOB) – triggered if dissolved oxygen concentration is less than 1 mg/L and specific conductivity exceeds 450 microsiemens per centimeter (μS/cm) at 1 MOB in spring. This specific conductivity is approximately equivalent to the CWQG for chloride concentration of 120 mg/L for the protection of aquatic life from chronic exposure (see Chloride Enrichment section below).
• TP concentration (1 MOB) — to be analyzed in a discrete sample collected at 1 MOB — triggered if dissolved oxygen concentration is less than 1 mg/L at 1 MOB at end-of-summer.
The spring and end-of summer profile sampling especially welcomed, as that is what’s needed to detect possible impairment of spring turnover at Sandy Lake by salt stratification. Addressing other questions cited above would require sampling of watercourses feeding Sandy Lake and probably some fairly expensive analyses, modelling etc.
Monthly EC monitoring of the type we have been conducting on streams requires only very simple and inexpensive equipment but is very informative. It could be continued as a “citizen science” contribution or adjunct to HRM monitoring. Also, highly informative and easily obtained by volunteers living close to Sandy lake (or other lakes of interest) are measurements of lake water level such as conducted by a volunteer with the Williams Lake Conservation Company; such measurements could be extended to particular streams also, perhaps with a concomitant measures of stream flow.
CONCLUSION
Sandy Lake represents an enviable situation where we still have the option of choosing the most effective way to prevent the predictable and largely inevitable deterioration of a treasured lake associated with increasing urbanization: to strongly limit as yet unapproved development in the watershed, especially close to the lake itself and to streams draining into the lake.
It is a choice we may want to apply to other lakes in HRM. Currently, the principal way we attempt to predict potential impacts of development on lake water quality is by modelling the impacts on lake total P but without consideration of impacts of climate warming or increased salt loading on lake total P and associated processes. Clearly that is inadequate.
In HRM, we have the historic database, the coverage of a wide range of lakes, a strong academic tradition and ongoing research related to water resources, HRM and community support and involvement in water monitoring and a renewed commitment to monitoring that could enable us to produce far better predictive models to aid in decision-making.
Even without further development, it is important to reduce existing inputs of sediment, nutrients, organics and salt as much as possible to counteract the increasing stresses associated with climate warming (e.g., longer periods of summer-fall stratification, reduced oxygen solubility and more favourable temperatures for algal blooms).
To maintain Sandy Lake as an invaluable community recreational area and as habitat for iconic species such as salmon and loons, the Water Quality Objective for Sandy Lake should be to “walk the lake backwards” as much as possible to an earlier, more pristine, oligotrophic state.
Sandy Lake, already suggested as one of the Priority Lakes for monitoring (AECOM, 2020) would make a fine case study of a lake in transition from a healthy lake to a highly deteriorated lake. Hopefully, it would prove to be a case study on how we can reverse the current trends and engage the community in that process.
Postscript Notes
Reference to these items to be incorporated when the Draft Report is revised
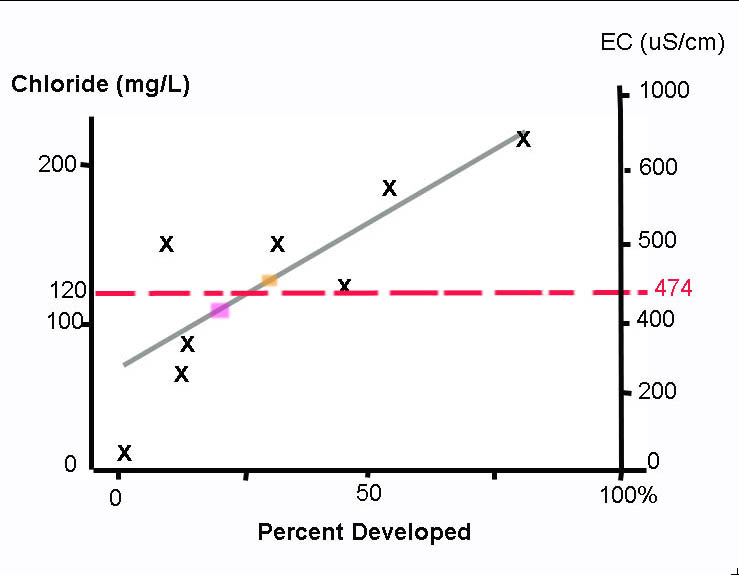
Relationship of Chloride and EC to Percent Land Area Developed. Graph adapted from Fig 6 in Scott et al., 2019. Click on image for larger version. The orange-filled rectangle shows where 30% Development (the approx. current level at Sandy Lake*) would fit on the Scott et al., 2019 regression line relating chloride concentrations in the spring of 2013-2017 to the percent watershed developed for 9 Halifax lakes. EC values on the right correspond to the chloride values, based on the relationship given in AECOM (2020). The current spring EC value for Sandy Lake is approx 190 uS/cm. The CCME Guideline for long term exposure to chloride is 120 mg/L (the dashed red line). So if Sandy Lake behaves like the other lakes, it would achieve a steady state value just above (orange rectangle) or just below (purple rectangle) 120 mg/L chloride – at the current level of development, higher if further developed.* My estimate based on measurements shown under Land Use; the purple square represents 21% Developed, the approximate (interpolated) value cited by Casey 2022, Fig 2.2 for Sandy Lake in 2020
Long-term evaluation of the impact of urbanization on chloride levels in lakes in a temperate region
R.Scott et al., 2019. Journal of Environmental Management Volume 244, 15 August 2019, Pages 285-293 Paper by researchers at Centre for Water Resources Studies, Dalhousie University Halifax. Observations on 9 lakes in Chocolate Lake Run Drainage Basin and McIntosh Run Drainage Basin on Halifax south mainland. “In this paper, nine lakes in the Halifax region of Nova Scotia, Canada, were monitored over 35 years to observe Cl concentrations prior to, during, and after urbanizing development. Cl concentrations were observed to increase in most study lakes over the monitoring period and all nine exhibited seasonal trending in response to winter de-icing activities. Six of the lakes achieved a steady-state Cl level after an initial increase in response to development activities, two are potentially still in transition, and one was unaffected by development activities. Watershed land use was found to be a good predictor of the springtime concentration of Cl and can help to inform decision making surrounding development activities. When the percent of developed land was 25% or more, the Cl concentrations tended to exceed Canadian freshwater quality guidelines for the protection of aquatic life.”
==========
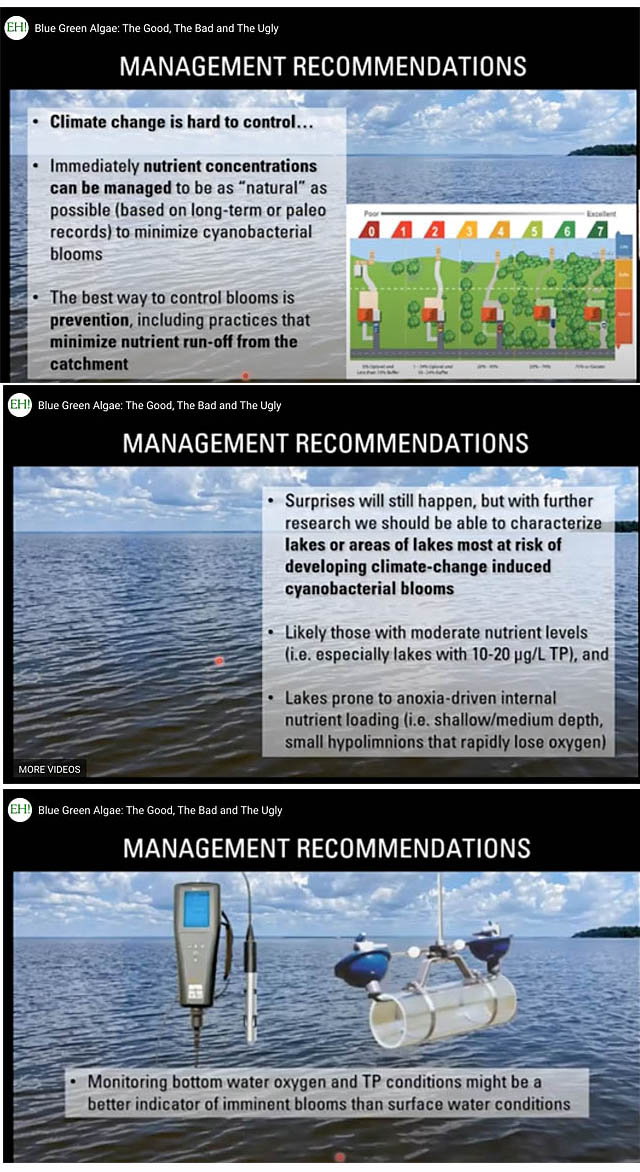
Management recommendations related to minimizing cyanobacteria blooms are consistent with the conclusions about Sandy Lake
Blue Green Algae: The Good, The Bad and The Ugly (YouTube Video)
Environment Haliburton, Feb 11.2021. “Elisabeth Favot PH.D gave an illustrated talk about Cyanobacteria in Ontario freshwater lakes with additional input from Professor Barb Elliot and Norman Yan”
Investigating Long-term Environmental Trends in Central Ontario Lakes Impacted by Cyanobacterial Blooms
L Favot – 2021 PhD thesis, Queens University.
Climate variability promotes unprecedented cyanobacterial blooms in a remote, oligotrophic Ontario lake: evidence from paleolimnology
Favot et al., 2019. J Paleolimnol (2019) 62:31–52 “…Collectively, the factors causing algal blooms in remote lakes such as Dickson Lake are not yet fully understood, and it is worrisome that with continued warming the triggering conditions may become a more common feature of Algonquin Park and other minimally impacted Boreal Shield lakes in the coming years.”
==========
The slow and steady salinization of Sparkling Lake, Wisconsin
Hilary A. Dugan & Linnea A. Rock. 2021. Limnology and Oceanography Letters, Early View Abstract:
The concentrations of conservative solutes in seepage lakes are determined by the relative inputs of precipitation vs. groundwater. In areas of road salt application, seepage lakes may be at high risk of salinization depending on groundwater flow. Here, we revisit a 1992 analysis on the salinization of Sparkling Lake, a deep seepage lake in Northern Wisconsin. The original analysis predicted a rapid increase in chloride concentrations before reaching a steady steady of 8 mg L−1 by 2020. Forty years of monitoring Sparkling Lake show that rather than reaching a dynamic equilibrium, chloride concentrations have steadily increased. We update the original box model approach by adding a soil reservoir component that shows the slow steady rise in chloride is the result of terrestrial retention. For freshwater rivers and lakes, chloride retention on the landscape will both delay chloride impairment and prolong recovery and must be considered when modeling future chloride contamination risk.
=========
SANDY LAKE, Bedford:- Accelerated eutrophication signs, and suggested restoration parameters
S. M. Mandaville to Chair & Members, North West Community Council, HRM, October 30, 2013 “I include the predictive phosphorus modelling conducted by my team some years back (results updated in page-5, and the pictorial model in page-7). The enrichment has already occurred (see page-3 on suggested action by the NWCC)…The goal of restoration should be a maximum deep station TP of 9 μg/l”
Also view. Phosphorus:- Details on LCC (Lake Carrying Capacity)/Threshold values of lakes, and comparison with artificially high values chosen by the HRM
Document prepared by S. M. Mandaville, March 14, 2014
=============
Under the radar: long-term perspectives on ecological changes in lakes
John P. Smol. . Proc. R. Soc. B 286: 20190834. “…Attempting to manage cyanobacterial blooms against a backdrop of current global change is
one of the greatest challenges that lake managers face, and it is becoming clear that to do this effectively will require a complex, integrative approach that includes a suite of tools and innovative methods [62]. Combining ongoing limnological research (observational, experimental, modelling) with the temporal perspectives that paleolimnological assessments provide, can be key to improving our understanding of algal blooms and climate change. While a minimum concentration of nutrients is clearly a pre-requisite for an algal bloom to occur, as has now been shown in a variety of palaeolimnological studies (e.g. [63]) external nutrient additions are not a
necessary precondition for triggering cyanobacterial blooms. Rather, accelerated warming over the past few decades appears to be the new ‘threat multiplier’ [3]. Lower nutrient loading will therefore be needed in a future warmer world to achieve the same ecological state as we have today [64].”
Commenting in a letter to Shalom Mandeville, Prof.Smol said “…We have many things happening at once in lakes … in many areas lakes are getting browner, which will affect different algae in different ways. What is even more critical I think is warming (i.e. less ice cover, longer and stronger thermal stratification – all conducive to algal blooms and especially bluegreen algal blooms) – We are getting agal blooms in lakes, including toxic cyanobacterial blooms, in lakes with low P and declining P. That does not mean P is not important – it is critical BUT the P thresholds where bluegreen algae will bloom seems to be going lower and lower with respect to P. I talk about this in my invited article in the Proc Roy Soc London … also open access. ”
Sandy Lake Watershed Study – Additional Modeling Scenario
A letter dated Feb 12, 2015 addressed to Mr. Cameron Deacoff, Planning and Infrastructure Halifax Regional Municipality from Steve Murphy, MBA, P.Eng. Senior Manager, AECOM/Atlantic Canada. It has not been published on the HRM website or otherwise made available but was listed amongst info documents given to consultants reviewing the ‘Optimal boundaries for Sandy Lake Regional Park (see Post, Nov 10, 2021). The consultants made a preliminary report to HRM 7 stakeholders on mar 29, 2022, at which time the document was made available. Amongst the results: “The results of the Lakeshore Capacity Modeling for the Scenario 2b suggests the phosphorus concentrations in both Sandy Lake and Marsh will exceed the Water Quality Objectives set in the
Sandy Lake Watershed Study Final Report (AECOM 2014).