
Notes from various reports.
Figures, graphs etc on this page are labelled CF Fig 1, 2 etc.
On Total Coliforms, Fecal Coliforms, and E. Coli (NY State Dept of Health
The most basic test for bacterial contamination of a water supply is the test for total coliform bacteria. Total coliform counts give a general indication of the sanitary condition of a water supply.
- Total coliforms include bacteria that are found in the soil, in water that has been influenced by surface water, and in human or animal waste.
- Fecal coliforms are the group of the total coliforms that are considered to be present specifically in the gut and feces of warm-blooded animals. Because the origins of fecal coliforms are more specific than the origins of the more general total coliform group of bacteria, fecal coliforms are considered a more accurate indication of animal or human waste than the total coliforms.
- Escherichia coli (E. coli) is the major species in the fecal coliform group. Of the five general groups of bacteria that comprise the total coliforms, only E. coli is generally not found growing and reproducing in the environment. Consequently, E. coli is considered to be the species of coliform bacteria that is the best indicator of fecal pollution and the possible presence of pathogens.
Nova Scotia follows the Guidelines for Canadian Recreational Water Quality: Third Edition:
CF Fig 1

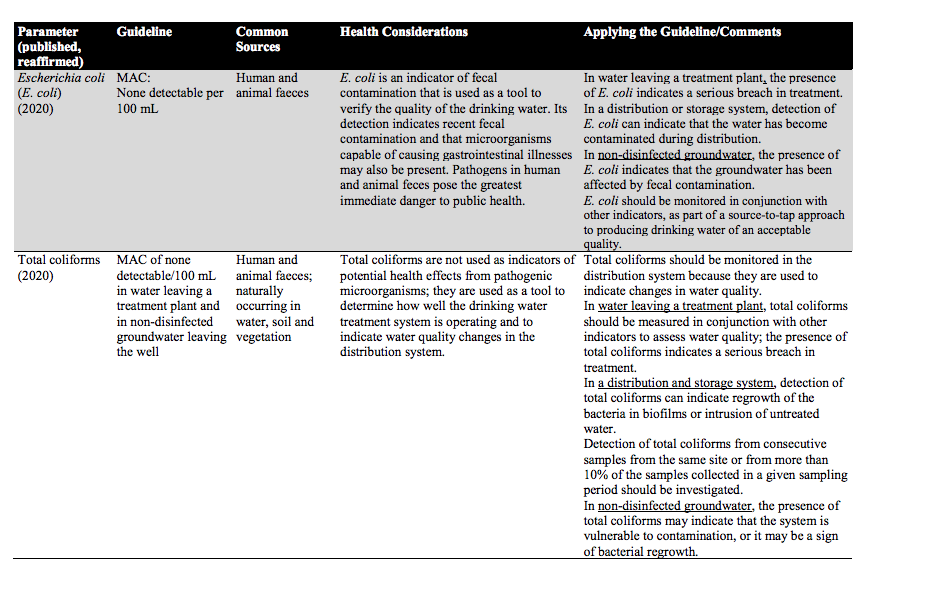
Like wise, Nova Scotia follows the Guidelines for Canadian Drinking Water Quality; for coliforms, there is a zero tolerance: (click on image for larger version)
CF Fig 2
INFO RELATED TO SANDY LAKE
- Sandy Lake Development Impact Assessment Final Report – A Water Quality Analysis
Damon Conrad, Hany Sidhom, Steve Matthews, W. Hart 2002 Dalhousie University
Sampling was conducted in the fall of 2001. Four samples for bacteriological tests were collected Nov 12, 2001; water temperatures on Nov 4 were 5.8 to 6.9 (Table 5.2)
5.3 Fecal and Total Coliform The results of fecal and total coliform counts were achieved through sampling at many sites across the lake, and accompanied by testing at the QEII Environmental Services Laboratory. Regulations regarding recreational use of lakes have set a limit for a maximum coliform count of 200 and 10 for total and fecal coliform respectively, and 10 and zero respectively for drinking water purposes. The results from this study on Sandy Lake have found total coliform counts to range from 92 to 142 coliform/100ml. The results from the fecal coliform tests show counts of 0 fecal coliform/100ml for all test sites. Both of these parameters are found to be within the limits for recreational use, but the total coliform count places this water above the acceptable limit for drinking water. COMMENT: As coliform numbers are highest at warmer temperatures (viewMacdonald 2016, below), so the sampling was not conducted at a time when they are ususally problematical
- Sandy Lake Community Profile
Dalhousie School of Planning, 2002.
“Drinking Water Quality The primary sources of drinking water for local residents and cottagers are groundwater from drilled and dug wells and the water of Sandy Lake. Until a couple of sewer breaks that occurred on the sewer main near Giles Drive in 2000 and 2001 residents had no problems with water quality (for drinking or swimming); in fact, they were proud of the high quality of their water., The municipality issued boil water and no swimming advisories following the sewage leaks.”
Pages from Paul Mandel, MSc thesis, Dalhousie University, 1994. Observations on Sandy Lake on 4 dates 1991/1992, and comparison with 1971 data. – “A high average faecal coliform count of 24/100 ml sample indicates Sandy Lake is being stressed by sewage pathogens”
- 2 Halifax-area beaches reopen, 4 remain closed to swimmers
By Marieke Walsh Global News July 5, 2013 9:30 am “Four beaches and swimming areas in Halifax Regional Municipality (HRM) remain closed due to high levels of bacteria.The municipality reopened two beaches for swimming on Friday — Dingle and Black Rock — after tests showed bacteria levels did not exceed Health Canada guidelines…The heightened bacteria levels are caused by the sewage overflows from heavy rain water in the past weeks. The full list of beaches and lakes closed includes:
Albro Lake in Dartmouth
Sandy Lake in Bedford
Long Pond in Herring Cove
Kinsmen Beach on First Lake, in Sackville
COMMENT: See Macdonald 2016, below. Both lakes were sampled in his study, Both lakes were the only two out of four monitored which exhibited high E. coli levels on some occasions.
-
Characterizing Sources of Fecal Pollution at Four Urban Public Beaches in the Halifax Regional Municipality
Michael McDonald, 2016. MSc thesis, Dalhousie UniversityFrom 1.1 – Thesis ContextThe Halifax Regional Municipality (HRM) currently manages twenty-three beaches that are open to the public between July 1st and August 31st. The closure of beaches are determined by measuring E. coli levels in water samples taken within beach limits. In accordance with Health Canada Guidelines, beaches become closed to the public in two instances: i) A single water sample yields more than 400 E. coli/100 mL of water or ii) the geometric mean of at least five different water samples is greater than 200 E. coli/100 mL (Health Canada, 2012a). Within recent years, several of the beaches under HRM control have closed frequently throughout the beach open season due to increased levels of E. coli.The methods used to determine E. coli counts are not instantaneous and in fact can take over a day to process, ultimately leading to delays in beach closures. A high frequency of beach closures can result in wasted resources and negative perception of local recreational departments. The current beach monitoring protocol focuses solely on the enumeration of E. coli and is therefore not providing the information necessary to better manage resources and eliminate fecal contamination. This study aims to both monitor E. coli and coliforms levels in four HRM freshwater beaches before, during, and after the beach open season, and determine potential sources of fecal contamination within these beaches using novel molecular methods.From 3.1 – Sampling Beaches and Sample CollectionSandy Lake Beach was selected as “as a control beach due to a history of good water quality and location in a relatively unpopulated area”, noting that “Although most of the surrounding area is undeveloped, containing mostly marshes and swamps, there is a sparsely populated residential area and industrial presence, including Atlantic Acres Business Park and Farmers Co-op factory, in close proximity to the lake”Kinsmen Lake The lake itself is surrounded by a densely populated urbanized area including residential, commercial, and industrial land uses.Birch Cove Beach on Lake Banook Lake Banook is fed water from Lake Micmac and rivers running through Bedford Business Park and Dartmouth Crossing. Directly surrounding Lake Micmac and Lake Banook is a heavily urbanized area that includes residential, commercial, and industrial land uses.Springfield Beach on Springfield Lake Springfield Lake is a headwater lake with Springfield Beach located near the water output…[The lake] is directly surrounded by a sparsely populated residential area, although many of the houses have attached docks and boats.COMMENT: So based on location, Sandy Lake Beach would be expected to have the lowest E coli levels, Kinsmen lake the highest, Birch Cove 2nd and Springfield 3rd (or apprx equivalent to Sandy BeachOn Bacteriologial methods,Methods, summary (from Abstract)”Enumeration, microbial enrichment, and genetic microbial source tracking methods were used to enumerate E. coli levels and detect the presence of select pathogens and host-specific fecal contamination markers.” The beaches were sampled 11 times over the period May 20 to Oct 20 which included 3 samplings before, 6 during and 3 after the open beach season (for HRM: July 1- Aug 31).CF Fig 3. From Macdonald 2016 3. Results
Beach E. coli CFU Geometric Mean CFU Range Kinsmen 9 0.5-300 Birch Cove 3 0.5 – 124 Springfield 4 0.5-67 Sandy 5 0.5-300 Period E. coli CFU Geometric Mean CFU Range Before 1 0.5 – 8 During 5 0.5 – 140 After 13 0.6 – 300 COMMENT The differences between beaches were not significant, however the statistical power of these tests was low because of the day to variability in values. It’s clear, regardless, that both Sandy Lake and Kinsmen Lake had elevated values compared to Springfield and Birch Cove, and in the after-beach-closure period, some values were above Health Canada standards.
From 4.1.1 Summer E.coli and coliform monitoring data
Within the HRM, the annual beach season runs from July 1st to August 31st. To capture the water quality before, during, and after the beach season, water samples were collected between May 20th , 2014 and October 20th, 2014. Turbidity, water temperature, and 7-day precipitation measurements obtained during this study can be observed in Figure 4.1 while E. coli levels from water collected throughout the sampling season can be observed in Figure 4.2. Water temperatures were highest during the beach open season (Figure 4.1a). Kinsmen beach displayed consistently high turbidity levels, surpassing measurements from the other beaches during most of the sampling runs (Figure 4.1b). On July 15th, there was a small spike in E. coli levels at Springfield and Kinsmen Beaches but levels did not surpass 200 CFU/100 mL (Figure 4.2a), although coliform levels at all beaches were greater than 1000 CFU/100 mL (Figure 4.2b). E. coli levels surpassed 200 CFU/100 mL on four separate occasions, twice at Kinsmen Beach and twice at Sandy Lake Beach, during the September 22nd -24th and October 20th sampling runs (Figure 4.2a). During the September 22nd -24th sampling run, all beaches displayed elevated E. coli levels, corresponding to a large storm event with high winds and precipitation levels (average rainfall of 72 mm 3 days and 162 mm 7 days before sampling; Figure 4.1b). E. coli levels at Kinsmen Beach on September 23rd displayed a geometric mean of 1068 CFU/100 mL with each individual water sample surpassing the 400 CFU/100 mL limit set by Health Canada (Health Canada, 2012a; Figure 4.2a). On October 20th both Kinsmen and Sandy Lake Beach had E. coli levels surpassing 300 CFU/100 mL (Figure 4.2a). Simultaneously, turbidity levels at these beaches were the highest observed during the entire sampling season (Figure 4.1b) and coliform levels were also elevated (Figure 4.2b).A Kruskal-Wallis non-parametric test was run in order to determine if E. coli counts differed between sampling beaches and sampling periods. Geometric mean E. coli levels did not significantly differ (p>0.05) between sampling beaches (Table 4.1). Kinsmen beach displayed the highest levels of E. coli with a geometric mean of 9 CFU/100 mL (Table 4.2; Figure 4.3). Springfield, Sandy Lake, and Birch Cove Beaches displayed similar levels of E. coli with levels of 4, 5, and 3 CFU/100 mL respectively (Table 4.2). It is important to note that the distribution of E. coli counts at Kinsmen and Sandy Lake beach displayed two clusters, one with approximately 10 CFU/100 mL and below and the other approximately 100 CFU/100 mL and above (Figure 4.3). There was a significant difference (p = 0.0004) in E. coli levels between the different sampling periods (Table 4.1) Furthermore, mean counts obtained from both during (5 CFU/100 mL) and after (13 CFU/100 mL) the beach season were significantly higher (p<0.05) than those obtained before (1 CFU/100 mL) the beach season (Table 4.1; Table 4.2). However, there was not a significant difference in E. coli levels during and after the beach season (Table 4.1).
From 4.2.3 Prevalence of fecal contamination markers throughout the sampling season
Water samples from each beach were tested regularly for human, dog, and general avian fecal contamination markers. ..The human HF183 showed the highest prevalence, being detected in 13.6% of all tested water samples (Table 4.5). Four of the six positive samples occurred during one sampling run corresponding to May 20th, 2014 (table 4.5). The remaining two positive samples occurred during and after the sampling season at Sandy and Birch Cove Beaches respectively (Table 4.5).The BacCan marker was detected in three samples (10.7%) while the dogmt marker was not detected at all (Table 4.5). All three positives occurred during the beach season, once at Springfield Beach and twice at Kinsmen Beach (Table 4.5). The GFD marker was utilized to detect the presence of total avian (duck, gull, chicken) fecal contamination. Out of forty-four water samples the GFD marker was only detected once, corresponding to a water sample from Springfield Beach before the beach season (Table 4.5). It is important to note that ducks were consistently seen at Kinsmen Beach during sampling
From 4.3 E. coli as an Indicator of Fecal Contamination Within Test Beaches
4.3.1 E. coli levels in surface sediments
All beaches displayed higher E. coli counts in the water column on the July 7th sampling run (Figure 4.5b). Furthermore, Kinsmen, Sandy Lake, and Birch Cove Beaches displayed proportions greater than ten on September 22nd and October 20th, although levels at Springfield had proportions close to one. (Figure 4.5b). It is important to note the proportions observed at Sandy Lake Beach during these dates were elevated compared to the other beaches (Figure 4.5b). … Counts in Sandy beach were especially high during these dates, with a proportion of 280 being calculated on October 20th (Figure 4.5b). COMMENT: i.e. the E. coli were likely derived from water flushing thrugh the system, rather than being released from the sedimentsFrom 4.3.3 Predictor model of the interaction between water quality parameters and E. coli levels at tested beaches.
Only the water temperature variable and the turbidity:7 day precipitation interaction were significant (p< 0.05) in this model Full model: E. coli = Temp + Turb + DO + ph + pre7 + Temp:Turb + Temp:DO + Temp:ph + Turb:Precip7 + Temp;pre7 + Turb:DO + Turb:ph + DO:ph + DO:pre7 + ph:pre7 Turbidity, dissolved oxygen, precipitation, temperature, turbidity
From Chapter 5 Discussion
5.1 Prevalence of FIB, Pathogens, and Fecal Markers at Test Beaches
5.1.1 E. coli and coliform levels within test beaches
According to Health Canada Guidelines for Recreational waters, a beach must close to the public if E. coli levels surpass 400 CFU/100 mL for a single sample or if the geometric mean of five samples surpasses 200 CFU/100 mL. None of the tested water samples taken during the beach season surpassed the maximum allowed concentration of E. coli although levels at Kinsmen Beach on September 23rd surpassed 1000 CFU/100 mL. There was not a significant difference in E. coli levels between sampling sites within this study. The geometric E. coli mean at all sites was relatively low despite levels of „100 CFU/100 mL being observed on numerous occasions. However, E. coli levels ¾ 10 CFU/100 mL were much more common throughout the sampling season. Therefore, the final geometric E. coli mean of each beach would be skewed towards lower geometric means and have higher attached variances, as supported by the relatively wide 95% CI values observed.E. coli levels were significantly (p<0.05) greater during and after the beach season compared to before the beach season. Geometric E. coli levels were highest after the beach season due to elevated E. coli levels caused by the September 22nd 24th storm event and elevated turbidity levels on October 20th. Heavy rainfall will increase the level of E. coli within aquatic systems (Whitman et al., 2006; Kleinheinz et al., 2009). In fact, Ackerman and Weisberg (2003) noted large scale elevation in FC levels across the United States after storm events with just 25 mm of rain. Increased levels of turbidity are positively correlated with an increase in E. coli concentration, such that increasing turbidity will lead to increased E. coli levels (Francy et al., 2013; Marion et al., 2015).
An increased concentration of particles, corresponding to increased turbidity, within surface waters can reflect an influx of E. coli from runoff (Jeng et al., 2005) or the release of sediment-bound E. coli into the water column (Whitman et al., 2006; Phillips et al., 2014). Extending the sampling period to include all four seasons would allow for a more in-depth analysis of E. coli levels within the tested beaches. ….
5.1.3 Prevalence of fecal contamination markers at the test beaches
Within this study, the HF183 marker displayed the highest prevalence among tested fecal markers, with an overall prevalence of 13.6%. This prevalence is similar to results obtained by Stea and others (2015a) in which a prevalence rate of 9-10% was observed in two Nova Scotian watersheds. Four out of the six positive samples occurred at all beaches in the same sampling run, corresponding to May 20th, 2014. The low prevalence of the human marker during the beach season is unexpected as increased human traffic would logically lead to an increase of human contamination in recreational waters… Overall, the low prevalence of the BacCan marker indicates that dogs may not be a large source of contamination at the tested beaches and the ban on dog’s access to beaches imposed by the HRM is being obeyed.5.1.4 Public health risk associated with test beaches
The presence of human, dog, and avian markers within the tested beach water indicates the presence of fecal contamination.
5.2.2 Fluctuations in measured E. coli counts
The HRM reported several beach closures throughout the 2014 open beach season. Springfield beach was closed twice, from July 7th -9 th and August 7th -11th, while Birch Cove Beach was closed from August 20th -22nd, yet no samples during the beach season displayed levels that would indicate the need for a beach closure. The HRM sends water samples to a commercial lab that uses m-FC media for enumeration of E. coli while m-ColiBlue24 broth was utilized in this study. Both media have varying sensitivity and false-positive rates (Ciebin et al., 1995; Grant, 1997; Jensen et al., 2001; McLain & Williams, 2008). Furthermore, McLain and Williams (2008) indicated that specificity of m-ColiBlue24 was highest during the summer and lowest during the fall and winter. Subsequent variation and inaccuracies in E. coli counts caused by enumeration media can therefore lead to unnecessary beach closures….Small scale variances in sampling time, weather or hydrological factors also play a role in E. coli variability….The timing of sampling is therefore crucial in the monitoring of E. coli levels in recreational waters and should be standardized to ensure accurate and precise E. coli measurements.
5.2.3 Effect of WQP on E. coli prevalence within the beaches
The levels of E. coli in an aquatic systems are constantly influenced by physical and chemical water parameters. A regression model was produced to further explore how measured 79 E. coli counts obtained in the four test beaches were influenced by selected WQP. Logistic regressions were completed while simultaneously building the predictor model in order to aid in the construction of the final regression model. The obtained model is as follows: E. coli = Water temperature + Turbidity + DO + 7 day precipitation + Water temperature: DO + Temperature: pH + Turbidity: pH + Turbidity: 7 day precipitation. Water temperatures greater than 15°C and 20°C were significantly related to E. coli levels greater than >200 CFU/100 mL and >100 CFU/100 mL respectively. Both sets of regressions had OR values less than one, indicating that E. coli levels will likely be below these numbers at the tested temperatures. This supports the hypothesis that E. coli are known to have decreased survival at higher water temperatures (Flint et al., 1987; Sampson et al., 2006). Therefore, the presence of the water temperature variable within the final predictor model is expected. DO was not significantly related to E. coli levels during logistic regression but the individual variable was present and significant in the final predictor model. A weak negative correlation has been reported between E. coli levels and DO (Nevers & Whitman, 2005), suggesting that E. coli levels may decrease with increasing concentrations of DO (Curtis et al., 1992). The solubility of oxygen will decrease as water temperatures increase (Fondriest Environmental, 2013), indicating that the positive interaction term between DO and water temperature in the model is to be expected.
The large storm event that occurred during September 22nd 24th increased E. coli levels at all beaches. E. coli levels were 9.11 and 27.8 times more likely to be greater than 100/200 CFU/100 mL when there was more than 20 mm of rain 3 and 7 days prior to sampling, respectively. E. coli levels will increase with increasing rainfall (Ackerman & Weisberg, 2003; Kleinheinz et al., 2009) such that some municipalities preemptively close recreational beaches based on rainfall amounts.
E. coli levels were 16.49 times more likely to be >100 CFU/100 mL when turbidity levels were greater than 5.0 NTU. This relationship is well documented, with a positive correlation being reported in the literature (Francy et al., 2013; Marion et al., 2015). Furthermore, heavy rainfall will increase turbidity within the water column mainly through sediment runoff (Lawler et al., 2006; Göransson et al., 2013). Increased turbidity within the water column represents an influx 80 of sediment particles in the water column which in turn provides increased protection and nutrients for suspended E. coli. As a result, the addition of 7 day precipitation and turbidity, and their interaction, into the final predictor model is to be expected.
The above predictor model is a simplified version of what would occur in a real water system. However, it does highlight how E. coli levels within the water are influenced by weather and WQP. Turbidity and previous day precipitation are common variables in E. coli predictor models within the literature (Francy et al., 2013; Brauwere et al., 2014). Rainfall specifically has been shown to correlate quite heavily with beach closures (Kleinheinz et al., 2009; Bush et al., 2014). Furthermore, Health Canada recommends that beaches remain closed after period of heavy rainfall in order to ensure public safety (Health Canada, 2012b).
-
Sandy Lake Watershed Study Final Report
AECOM, 2014. 131 pages
From p57″
Animal feces: Animal feces contribute bacteria and nutrients to Sandy Lake. Bird populations such as ducks, loons and gulls contribute the nutrient and bacteria load to Sandy Lake. However, the excrement of pets also contributes to the loading of Sandy Lake through the stormwater drainage system and more directly at the Sandy Lake Park on-off leash area. Sandy Lake was closed for swimming in July 2013 because of high bacteria levels. It is not clear what the source of the bacteria was, but pet feces may have contributed. Also see descriptions of septic systems and of two WWTF within the watershed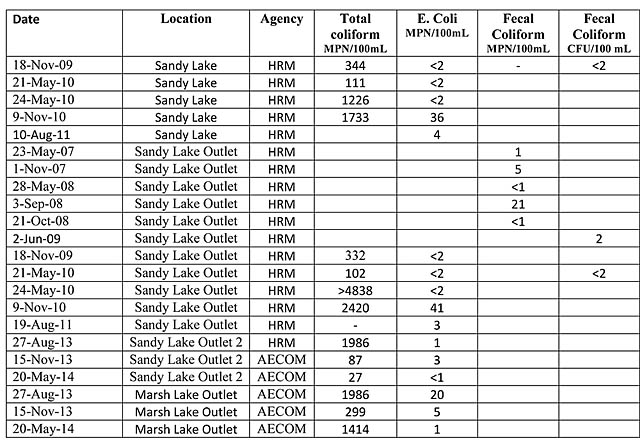
CF Fig 4 From AECOM 2014, Appendix C

CF Fig 5. From AECOM 2014.
“5.1.5 Bacteria The bacteria Escherichia coli (E. coli) is an indicator of human and animal waste, and may originate from treatment plant discharges, aging septic systems, and animal scat. Samples taken at Sandy Lake typically contain E. coli but the median concentration is quite low (2 MPN/100 mL3 ). Concentrations over 25 MPN/100 mL are not common (2 of 11 samples). HRM currently uses the guideline of 200 CFU/100 mL for E. coli for body contact recreation, which is the same as the Health Canada value of 2000 E. coli/L.From AECOM 2014:
Uplands Park – WWTF
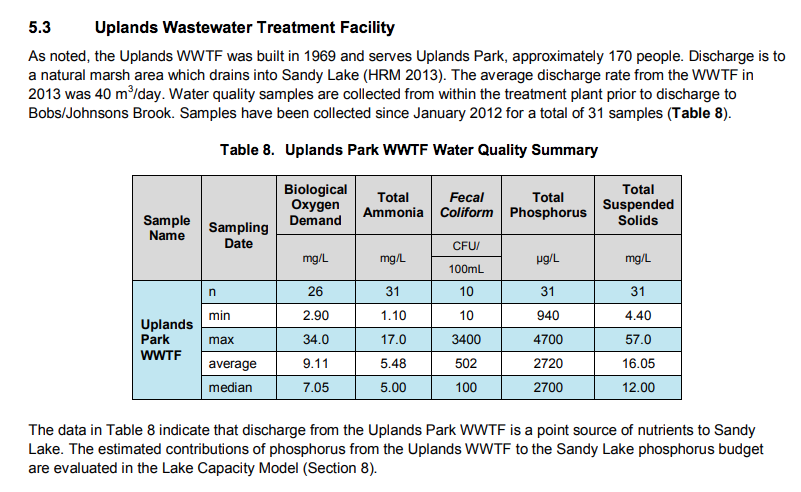
The Uplands Park Wastewater Treatment Facility (Figure 1) was built in 1969 and consists of a primary clarifier, a trickling filter with rock media, a secondary clarifier, and hypochlorite disinfection. The plant has a rated capacity of 91 m3 /day with a peak capacity of 178 m3 /day, and serves a population of approximately 170 people. The effluent discharge criteria is 20 mg/L for both biochemical oxygen demand (BOD) and total suspended solids (TSS). In 2009 the plant was upgraded to ultraviolet disinfection (Halifax Water 2008). The plant discharges approximately 40 m3 of treated effluent per day into a wetland/creek approximately 3.5 km upstream of Sandy Lake (T. Blouin, Halifax Water, pers. comm.). In the early 2000s sewage leaks from broken sewer lines southwest of Sandy Lake affected lake water quality. Boil water and no swim advisories for Sandy Lake were issued by the municipality. Following the breaks, the force mains were replaced by Halifax Water (K. Mackenzie, Halifax Water, pers. comm.).Septic systems
From 3. Development in Sandy Lake Watershed 3.1 Historical and Existing Development Kingswood subdivision south of Hammonds Plains Road was developed in the 1990s and contains hundreds of homes. Although it is serviced by municipal water, residents use individual septic systems for their wastewater treatment. Subsequently, the Kingswood North subdivision (north of Hammonds Plains Road) was developed. It currently contains 50-75 homes with additional residences under construction. Residents of Kingswood North have both private wells and private septic systems. Lucasville is located in the northeastern portion of the watershed and has hundreds of residents on private wells and septic systems, although municipal water is provided along the Lucasville Road itself (Figure 2).
In 1970, the Timber Trails mobile home park was established and expanded in 1998. It is currently occupied with 233 homes on Lucasville Road. It will be expanded by 167 units over the next 5 to 8 years. The mobile home park uses a private communal septic system to treat wastewater, but is in the process of having the wastewater treatment system upgraded.
In 2009, an HRM commissioned report (CBCL 2009) provided cost estimates for servicing water, sanitary, stormwater and transportation links using various development scenarios in the ‘Greenfield’ area near Sandy Lake. In 2012, HRM Council agreed to oversize wastewater infrastructure through Bedford West to service potential future development of the Sandy Lake Greenfield area. In 2013 Armco Communities, developer and largest land owner, initiated forest clearing within the watershed. Armco Communities has since sold this property to Clayton Developments. As noted, HRM intends that future growth around Sandy Lake will be accommodated through central water and sewer services. A stormwater management plan will be developed by the property owner for approval by HRM and Halifax Water, in accordance with its Design and Construction Specifications guide book for the applicable calendar year (HRM request for proposal, this study).
From 3.2 Potential Sources of Contamination – Septic Systems
Aging septic systems may not be effective at reducing phosphorus from water dispersed in the septic field. The systems may not function as designed because the system components are broken or corroded. The soils in the septic field exhaust their retention capacity and become saturated with phosphorus as the system ages. This saturation results in the discharge of phosphorus to groundwater and surface water that can increase the phosphorus load to lakes. In the Sandy Lake watershed there are no residences on Marsh Lake and there are approximately 20 residences situated within 300 m of Sandy Lake and approximately 200 residences within 300 m of watercourses. These residences rely on private septic systems to treat residential wastewater. In addition, trailhead peat toilets were installed at the Lion’s Beach Park in 2002. Given their proximity to the lake, all of these systems are potential sources of nutrients to Sandy Lake depending on their age and maintenance history.
Uplands Park – WWTF The Uplands Park Wastewater Treatment Facility (Figure 1) was built in 1969 and consists of a primary clarifier, a trickling filter with rock media, a secondary clarifier, and hypochlorite disinfection. The plant has a rated capacity of 91 m3 /day with a peak capacity of 178 m3 /day, and serves a population of approximately 170 people. The effluent discharge criteria is 20 mg/L for both biochemical oxygen demand (BOD) and total suspended solids (TSS). In 2009 the plant was upgraded to ultraviolet disinfection (Halifax Water 2008). The plant discharges approximately 40 m3 of treated effluent per day into a wetland/creek approximately 3.5 km upstream of Sandy Lake (T. Blouin, Halifax Water, pers. comm.). In the early 2000s sewage leaks from broken sewer lines southwest of Sandy Lake affected lake water quality. Boil water and no swim advisories for Sandy Lake were issued by the municipality. Following the breaks, the force mains were replaced by Halifax Water (K. Mackenzie, Halifax Water, pers. comm.). Timber Trails The Timber Trails mobile home park is serviced by communal septic systems. In 2008, North West Community Council entered into a development agreement to enable an expansion of the Timber Trails mobile home park in support of upgrading its old sewage system. The old system had reportedly suffered from overflows and seepage during heavy rain events. As of August 2012, the park expansion has not occurred but detailed engineering of the new waste water treatment facility was underway (HRM Staff Report 2012). Since then, the waste water treatment facility has been upgraded but is not yet operational (A. Bone, HRM, pers. comm.)
From 10. Policy E-17 Objectives
Septic systems: Properly functioning septic systems allow the infiltration of clarified discharge to soils. Nutrients and bacteria are utilized by organisms in the soil. Septic systems less than 300 m to water bodies and malfunctioning septic systems likely contribute nutrients and bacteria to the water bodies in Sandy Lake. There are approximately 20 residences within 300 m of Sandy Lake and approximately 200 residences within 300 m of watercourses that utilize septic systems.
Wastewater treatment facilities: The Uplands Park Wastewater Treatment Facility (WWTF) is located in the Sandy Lake watershed. It has been operational since 1969 and is a source of nutrients to Sandy Lake. The facility may overflow and bypass the treatment cycle during storms or malfunctions. Untreated wastewater discharge carries high nutrient loads, especially phosphorus and can significantly add to the natural and nonpoint loading of phosphorus to lakes resulting in their rapid eutrophication. The impact of the wastewater overflows is difficult to quantify for several reasons: AECOM Halifax Regional Municipality Sandy Lake Watershed Study – Final Report 2014 08 25 60303077 Sandy Lake Final Report 47 ˗ Overflows typically occur during extreme weather events. The timing, frequency and severity of these events are not possible to predict and so the water quality impacts from overflows cannot be quantified or modeled. ˗ Halifax Water monitors the volumes and locations of overflows but does not measure the concentration of effluent released to the environment during an overflow event. Given this, it is not possible to gauge the nutrient loading that may occur during these events. We assume that reduction and ideally elimination of these overflows will be a priority within the plans for expansion of the waste water collection and treatment system within the watershed. Timber Trails mobile home park: Timber Trails is serviced by a private communal septic system. Approximately 233 homes are located in Timber Trails and a proposed expansion of the park is conditional on improvement and expansion of the septic system. The septic system is a source of phosphorus, nitrate and bacteria to surface water and groundwater. In the past, the park has struggled with wastewater treatment issues such as overflow and seepage during rain events. The park is approximately 4 km from Sandy Lake, so it doesn’t represent a direct impact on the water quality of Sandy Lake. However, the septic system can impact local groundwater which is used for potable water supply in the area
Back-of-the-envelop calculation: Could fecal coliforms from UPWWTF account for fecal coliforms in Sandy Lake?
From AECOM 2014 Appendix A Environmental Conditions, p 6
The flow from the Sandy Lake watershed is not gauged, so a precise estimate of flow volume and flow patterns is not available. Comparing the relative size of Sandy Lake watershed (24.2 km2 ) to the Sackville River watershed (147 km2 ), the monthly mean flow from the Sandy Lake watershed is estimated at 0.8 m3/sec based on the flow of the Sackville River at Bedford, 4.99 m3/sec (Environment Canada 2014).
Assuming that the output at Peverill’s Brook is half of this flow, and that flow via the SW inlet is 2/3rds of that, the flow into the SW inlet is 0.268 m3/sec; in one day, 23,155 Liters enter the lake, so the UPWWTF water is diluted by a factor of 23155/40 =579
The max count was 3400, the average 502, which divided by 599 = 5.9 and 1 respectively. The highest lake Fecal Coliform count was 21 for Sep 3, 2008 (see table above; also Mandel 1994, cited above, reported an average fecal coliform count of 24 for 4 samplings in 1991/1992) which was before the ultraviolet disinfection system was introduced, other values in that period are <1 to 5. The two values for 2009/2012 are 2 and <2. So the answer is Yes – assuming that there is no removal of fecal coliforms en route from the UPWWTF to the SW Inlet. The water is discharged into a fenced wetland adjacent to the treatment facility and there are more wetlands downstream, which could remove fecal coliforms.
Also, the range of values for Sandy Lake Beach given by Macdonald 2016 (CF Fig 1 above) is 0.5-300 CFU E.coli/100 ml. The very high values followed storms. Obviously, more monitoring including measurements along the watercourse would be required to answer the question. Other sources of fecal coliforms include septic systems, pet feces washed into storms sewers, and wildlife. The Macdonald 2016 observations suggest pet feces are not currently a significant source of fecal coliforms (HRM instituted pick-up-after-pet regaulations
———
SOME RELATED DOCS
Wu, S., Carvalho, P. N., Müller, J. a., Manoj, V. R. & Dong, R. (2016). Sanitation in constructed wetlands: A review on the removal of human pathogens and fecal indicators. Science of The Total Environment, 541, 8– 22. DOI:10.1016/j.scitotenv.20 15.09.047
Effective control of waterborne pathogens by aquatic plants
Bhupinder Dhir, 2020. Waterborne Pathogens. 2020 : 339–361.
Halifax campaign asks people to pledge to pick up after pooches
By Julia-Simone RutgersFor Star Halifax “Picking up after pets can help keep the city’s water clean, according to a new campaign launched by the Halifax Regional Municipality. The Canines for Clean Water program kicked off Saturday at the Loonie Carnival at Graham’s Corner, where residents were asked to sign a pledge to pick up after their pooches. The goal of the pilot program is to educate dog owners about the environmental impact their pup’s waste can have on the municipality’s waterways after an early April pollution-control study showed high levels of canine E. coli bacteria in two Dartmouth lakes.”
Picking Up After Your Pet
On halifax.ca
By-law A700
2008. Introduced regulations about pickung up pet feces on any public or private property other than the property
of its owner,
—————