DRAFTING Last Revision on Sep 8, 2024.
Significant changes/updates on Sep 27, 2024: A third un-assessed benefit was added; I pointed out that both Function and Benefit scores are normally used in assigning scores for stats as WSS (Wetlands of Special Significance), and I corrected the total area of wetlands calculated from the Draft LSA, correct figure is 50.8 ha (prev: 51.4).
NAVIGATION
www.versicolor.ca
![]() /sandylakebedford Home Page for Sandy Lake & Environs (Bedford, NS)
/sandylakebedford Home Page for Sandy Lake & Environs (Bedford, NS)
![]() /Surface Waters
/Surface Waters
![]() /Sandy Lake A Draft report On the State of Sandy Lake…Feb 21, 2021
/Sandy Lake A Draft report On the State of Sandy Lake…Feb 21, 2021
![]() /Limnological Profiles
/Limnological Profiles
Subpages:
– 2023 Limnological Profiles, effects of episodic precipitation and occurrence of a Metalimnetic Oxygen Minimum
– 2024 Limnological Profiles – return to historic trends
– –Addendum 1: Trends in Conductivity/Salt Content
– – Addendum 2: On Wetlands (This Page)
On this Page
I. Background: Our Observations on Wetlands
II. Background: From the Draft LSA (Apr 18, 2024)
III. Critique of the Draft LSA-Wetlands
– IIIa NS Wetland Conservation Policy Objectives
– IIIb No wetlands were rated WSS but that possibility is not ruled out
– IIIc How will net loss in wetland area and function be prevented?
– IIId The Draft LSA implicitly discounts any possible role of the wetlands...
-IIIe On Wetland and Watercourse Buffers
-IIIf Wetland Function Scores are reported but not Wetland Benefits
-IIIg On the Critical Location of the Wetlands
-IIIh Unassessed WESP Benefit #1: Phosphorous Removal
-IIIi Unassessed WESP Benefit #2: Water Storage
-IIIj Unassessed WESP Benefit #3: Unassessed WESP Benefit #3: Sediment Retention and Stabilization
-IIIk Conclusion based on the evidence at hand
IV. For Reference
I. Background: Our Observations on Wetlands
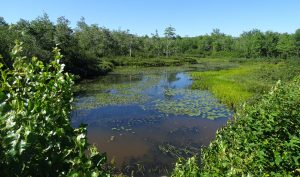
View of Murphy’s Pit area from road looking south. Several streams converge in this area; open water is bordered by marshes and some of the forest is likely wet riparian forest. This area is important habitat and local migration corridor for snapping turtles. Photo Aug 20, 2020.
Click on images for larger versions.
I have visited most of the larger wetlands and watercourses associated with Sandy Lake, on Sandy Lake itself, some of those associated with with Peverill’s Brook and Marsh Lake downstream. I routinely measured Electrical Conductivity of the watercourses/waterbodies to get a sense of where urban pollutants are coming from. View descriptions, photos etc. on these pages:
– Sandy Lake Wetlands Photo Albums: Sandy Lake (Bedford, NS): Wetland Fringe, SL: Marsh Lake/Peverill’s Brook
– Uplands Park WWTF
Photo Albums: Sandy Lake: Wetlands and Riparian areas to W & SW Oct 2, 2020 PART III
– Murphy’s Pit Convergence “an area of significant marshes/swamp and floodplain forest, also identified in the Natural Wonders Consulting Avian & Species at Risk Surveys as an area of Snapping Turtle movement and attempted, if not successful, breeding.”
| – W and SW of S. Lake Videos and GPS tagged photos of Wetlands and Riparian areas to W & SW of Sandy Lake, Oct 2, 2020 posted in Google Photo Albums:  W and SW of S. Lake: Map showing locations of the respective Video Albums, watercourses, wetlands, lectrical Conductivity values (uS/cm) on Oct 2, 2020. PART I – Johnson’s (Bob’s) Brook & Murphy’s Pit area; |
Sandy Lake Water Sources
In 2020 I made an estimate of the proportion of water going into Sandy Lake that comes from settled areas, versus water coming from intact (unsettled) landscapes based on my measurements of the EC (salt) values for lake water, water coming from settled areas, and water coming from intact (unsettled) landscapes. My estimate: 78% comes from settled areas, those mostly to the west and southwest of Sandy Lake; and 22% comes from currently intact landscapes.
The estimates suggest in turn that those currently settled areas – where also there is ongoing development (Bedford West Subarea 12) and proposed new development (SW of Sandy lake, above Hammonds Plains Road) – have a disproportionate influence on the water quality of Sandy Lake. That’s because its an area where most of the headwaters feeding Sandy lake converge before the water enters Sandy Lake and there are many watercourse wetlands.
II. Background: From the Draft LSA (Apr 18, 2024)
In the recently released Draft LSA (Landscape Suitability Analysis)* for the Sandy lake Study Area it is stated
*See HRM Future Service Communities webpage, link to Draft SandyLake LSA Apr18_2024.pdf (38.5 MB) (pdf)
3.1.1 WETLAND HABITAT
The objective of the wetland work was to determine where wetland habitat exists within the SLSA and determine if any Wetlands of Special Significance (WSS) are present. Having a general understanding of where the wetland boundaries are within the SLSA will support development planning and guide future wetland evaluations required to support permitting.Wetland conservation in Nova Scotia is guided by the Nova Scotia Wetland Conservation Policy and supported by regulation under the provincial Environment Act and Activities Designation Regulations. The goals of the policy are to have no loss of WSS and to prevent net loss in area and function for other wetlands (Government of Nova Scotia 2011).
The consultants identified 24 wetlands within their Study Area (total area 50.83 ha) and conducted WESP Assessments on 13 of the 24 (total area 46.56 ha) they did not do assessments on the other 11 (total area 4.27 ha).
Multiple extreme weather events throughout the 2023 field season (i.e., wildfires and floods) resulted in some unsafe and/or inaccessible areas within the SLSA. The field program assumed no more than 10 wetlands would be present in the Study Area and land access to all properties within the SLSA had not been attained prior to field surveys. Therefore, due to these operational constraints, not all wetlands were evaluated using WESP-AC in 2023, although attempts were made to evaluate as many as possible. Wetlands not evaluated using WESP-AC are among the smallest wetlands on site and/or are generally located outside the areas within the SLSA proposed for development (Table 3.1 and Figure 3.3 – the areas with no score). As per NSECC guidance, further wetland evaluation (i.e., delineation and functional assessment) will be required (prior to construction) to support permitting applications.
Wetland Scores for Ecological Condition were mostly in the “Low Suitability for Develoment Category”, and all were in that category for Wetland Risk. However, According to their Wetland Function Scores, all of the Evaluated Wetlands have Moderate suitability for Development, and “none of the thirteen wetlands evaluated using WESP-AC were determined to be WSS using that method”.
The consultants note that “Support/approval for alteration of a WSS will only be considered when the alteration is required to maintain, restore, or enhance a WSS, or if the alteration is deemed to provide necessary public function (Government of Nova Scotia 2011). While none of the wetlands in the SLSA evaluated using WESP-AC (i.e., 13 out of 24) were determined to be WSS, there are multiple factors that can result in a wetland being considered a WSS and further work and/or consultation with regulators may result in any of the wetlands within the SLSA being considered a WSS.”
IIIa. NS Wetland Conservation Policy Objectives (2011)
As indicated in the Policy, wetland conservation is achieved by considering the mitigation sequence (avoidance, minimization, compensation). Four Policy Objectives are cited (numbers inserted)
• [#1] To manage human activity in or near wetlands, with the goal of no loss in Wetlands of Special Significance and the goal of preventing net loss in area and function for other wetlands
• [#2] To promote wetland protection and stewardship and to increase awareness of the importance of wetlands in the landscape
• [#3] To promote a long-term net gain in wetland types that have experienced high historic losses, in order to restore beneficial ecosystem services and functions across the province
• [#4]To encourage the use of buffers to better ensure the integrity of wetlands adjacent to development (i . e . residential, commercial, industrial) and agricultural, mining and forestry operations.
IIIb. No wetlands were rated WSS but that possibility is not ruled out.
Related to Wetland Policy Objective #1, the Draft LSA found that “none of the thirteen wetlands evaluated using WESP-AC were determined to be WSS”. They note also that “there are multiple factors that can result in a wetland being considered a WSS and further work and/or consultation with regulators may result in any of the wetlands within the SLSA [Sandy Lake Study Area] being considered a WSS” but make no comment on what sorts of factors might be important to consider in regard to the SLSA (Sandy Lake Study Area).
IIIc. How will net loss in wetland area and function be prevented?
Related to Wetland Policy Objective #1 and “the goal of preventing net loss in area and function for other wetlands”: there is no discussion in the Draft LSA of how that might apply* if wetlands at Sandy Lake are significantly altered, which it appears they will be. * Would the compensatory wetlands be placed in the same landscape or elsewhere – See the NS Gov. document Wetland Compensation: What’s Required and What Are My Options/
IIId. The Draft LSA implicitly discounts any possible role of the wetlands in the area of the envisaged development as being important for the WQ (Water Quality) of Sandy Lake downstream,
re: the comment p 24 that “The low chloride and TSS concentrations suggest that Sandy Lake is not significantly affected by urban runoff or erosion within the watershed.” As I noted in comments on May 23, 2024:
That conclusion ignores entirely:
– the oxygen data showing a decline in deep water oxygen over time and the near anoxic levels occurring in recent years [which] indicate the Water Quality of Sandy Lake is in far worse or far more precarious condition than predicted by AECOM (2014) based on Lakeshore Capacity/Total P modelling;
– the trends of increasing salt levels in Sandy Lake and a wealth of publications related to rising salt levels in HRM lakes generally;
– the underlying assumptions of AECOM (2014) – and of the many studies making use of Total P as a predictor of limnological conditions/WQ – related to the influence of land runoff on Total P and water quality.Indeed, if Sandy Lake were not significantly affected by urban runoff, it would still be in a mid-oligotrophic (pristine) state as it was historically!
IIIe. On Wetland and Watercourse Buffers
Related to Wetland Policy Objective #4 (To encourage the use of buffers to better ensure the integrity of wetlands adjacent to development), the Draft LSA comments (Section 3.4):
The three largest streams that flow into Sandy Lake from west to east will be buffered 30 m to protect the watercourses and riparian habitats associated with them (see Section 3.3). Most of the wetlands present in the SLSA are found along these streams. HRM regulations require that wetlands situated along watercourses be buffered by 30 m. Although there are no provincial regulations that require wetland margins to be buffered, the Province of Nova Scotia does recommend that, where feasible, wetlands should be buffered in the same manner as watercourses (Government of NS 2011). The margins of wetlands in the SLSA will therefore be buffered by 30 m in this corridor mapping exercise to reduce the potential for adverse effects to these wetlands from adjacent development such as hydrological or trophic level disturbances. These buffered watercourses and wetlands will provide east/west wildlife corridors which would aid in the movement of both aquatic and upland organisms.
It is also noted , p 26:
The objective was to provide suitable areas for development while retaining watercourse function and potential habitat quality for fish. The ecological zones were established based on watercourse setback and buffer of 30 m established in the Bedford Land Use By-Laws (Halifax Regional Municipality 2024). Wider buffers may be more effective at filtering contaminants, encouraging infiltration and providing diversity of habitat. However, the buffer width beyond the minimum standard must also consider the growing need for residential units and the limited land available within Halifax; therefore, the 30 m setbacks established in the Bedford Land Use By-Laws were considered an appropriate starting point for the land suitability process.
It’s notable that there is no mention of the buffers cited as appropriate in the Sandy Lake Ecological Features Assessment, a 72 page document prepared for HRM by McCallum Environmental Ltd. June 27, 2022, although the document is referenced elsewhere’; nor is there any mention of the related Boundary Study Motion passed unanimously by Regional Council on July 12, 2022 in which they direct the Chief Administrative Officer on organizing the form and location of development to best protect at least…[amongst other items} “the suggested riparian and watercourse buffers” which are for wetlands a 50 meter buffer and for watercourses, a 100 meter buffer . View post of July 9, 2022 and the page Ecological Features Assessment on this website for links to the relevants docs.
Surely a more objective statement would read something like this:
The objective was to provide suitable areas for development while retaining watercourse function and potential habitat quality for fish. The ecological zones were established based on watercourse setback and buffer of 30 m established in the Bedford Land Use By-Laws (Halifax Regional Municipality 2024). Wider buffers may be more effective at filtering contaminants, encouraging infiltration and providing diversity of habitat. However, the buffer width beyond the minimum standard must also consider (a) the growing need for residential units and the limited land available within Halifax and (b) the 50 m buffer for wetlands and 100 m buffer for watercourses recommended in the McCallum Report and endorsed by Regional Council. Therefore, the 30 m setbacks established in the Bedford Land Use By-Laws were considered simply an appropriate starting point for the land suitability process.
IIIf. Wetland Function Scores are reported but not Wetland Benefits
“Wetland Function” was was evaluated using the Wetland Ecosystem Services Protocol – Atlantic Canada (WESP-AC) method, which involves completing both field and office forms (NBDELG 2018*).
*NBDELG (New Brunswick Department of Environment and Local Government). 2018. Manual for Wetland Ecosystem Protocol for Atlantic Canada (WESP-AC): Non-tidal Wetlands. Fredericton, NB. Available at https://www.researchgate.net/publication/323993053_Manual_for_Wetland_Ecosystem_Services_Protocol_for_Atlantic_Canada_WESP-AC_Non-tidal_Wetlands
It is notable and concerning that the WESP-AC protocol includes separate scores for Functions and for Benefits and that without any explanation, the Draft LSA makes no mention of Benefit Scores, which are normal component in the applications of the WESP-AC protocol in NS/HRM, e.g., see Drysdale Road (PID’s 00334102 and 40311896), Spryfield, NS: Wetland Evaluation, an HRM/McCallum Environmental Ltd document, Dec 6, 2022, Appendix WESP Results (PDF pages 75 & 76 pp). Both Functon and Benefit scores are presented and both are used in calculating a score for WSS. From that document:
1. General Description of Tool:
This interpretive tool automatically determines whether the subject wetland will be regulated as a Wetland of Special Significance (WSS). This determination is made based on the WESP-AC functional results, per the Nova Scotia Wetland Conservation Policy .A ‘Function-Benefit Product’ (FBP) is calculated based upon the Grouped Functions, and has a theoretical maximum of 100. Threshold values for the FBP are applied, in order to categorize the FBP scores into ‘Low’, ‘Moderate’ or ‘High’ scores. Thresholds are determined based upon the statistical distribution of WESP-AC scores compiled from various sites across the Province (N=442). These categories are subsequently used to apply various ‘Functional WSS Rules’, as described below.
For the purpose of defining and applying the Functional WSS rules, two supergroups are defined based on grouped functions, as follows: (1) Support Supergroup – includes Hydrologic, Water Quality Support, and Aquatic Support grouped functions. (2) Habitat Supergroup – includes Aquatic Habitat and Transition Habitat grouped functions.
I contacted an expert in WESP protocol, noting that as far as I could see, the Draft LSA does not report any “Benefit Scores” in their WESP Reporting, and asking “Can you clarify or correct this observation – Any idea why they didn’t that you can think of, if that is correct? The reply: “That is an odd omission. I don’t know why Stantec would have not included it.”
An additional complication is the designation of WSS status is changes that were made in September of 2023, but were not formally announced – see Environmental groups denounce changes to the Nova Scotia Wetland Conservation Policy, EAC Press Release 2023-11-16.
It’s a critical point:
WESP treats functions and their benefits as independent of one another. For example, a wetland that is extremely effective for removing whatever nitrate enters it is not considered to be of high benefit for that function unless it is exposed to significant loads of nitrate and/or its watershed has been designated as “Water Quality Limited” as a result of ongoing problems with nitrate pollution. Likewise, even if a wetland’s effectiveness for storing water is only moderate, the benefit of that function may be considered potentially high if the wetland is situated upstream from homes that are periodically flooded by heavy runoff. In concept, wetland ecosystem services are the combination of functions and the benefits of those functions, judged individually.
Thus, for a wetland to be considered as providing a high level of services, both its functions and the benefits of those functions should be high. WESP does not combine estimates of function and benefit into a single score representing the wetland’s service, but by estimating functions and their benefits separately it provides a foundation for doing so. – from Paul Raymond Adamus in Manual for the Wetland Ecosystem Services Protocol (WESP) version 1.3 October 2016. Available at https://www.researchgate.net/profile/Paul-Adamus/publication/352383733_Manual_for_the_Wetland_Ecosystem_Services_Protocol_WESP_version_13/links/65105577c05e6d1b1c2d6453/Manual-for-the-Wetland-Ecosystem-Services-Protocol-WESP-version-13.pdf
Another way of stating the difference” Function is how a wetland performs independently of where it is located, while Benefits depend on the location and context of wetland. What’s clearly missing in the Draft LSA are any ratings or discussion of the Benefits that relate to the specific location of these wetlands and to the current trophic state of Sandy Lake downstream (precarious).
IIIg. On the Critical Location of the Wetlands
The greatest concentration wetlands in the SLSA (Sandy Lake Study Area) occurs to the southwest of Sandy Lake (Draft LSA Fig 3.2, p6) which is the area where most of the headwaters converge on Sandy Lake, re: AECOM 2014 3. Hydrology: “The greatest flow into Sandy Lake is from Bobs Brook and other tributaries from the western portion of the watershed.” (Read more below). All of these wetlands are on watercourses of headwaters for Sandy Lake.
Further, the envisaged development, or at least the first stage of it, is located in this area – as well as can be currently publicly determined: see map below. Thus to facilitate the development, there is pressure from the developers and to some extent from the provincial government* to reduce the wetland and watercourse buffers to the minimum allowed, as well as to allow some wetland removal/compensation, as otherwise ‘no development would be possible’*.
*Re: NS Government’s identification of Sandy Lake as “as one of nine locations where development will be accelerated as the province deals with a booming population, skyrocketing real estate prices and a limited housing stock” – CBC Apr 18, 2022 ). ‘No Development would be possible’ is reportedly what some council members were told by developers would be the case if the buffers recommended in the McCallum report were to be endorsed by Regional Council, which they were – unanimously.
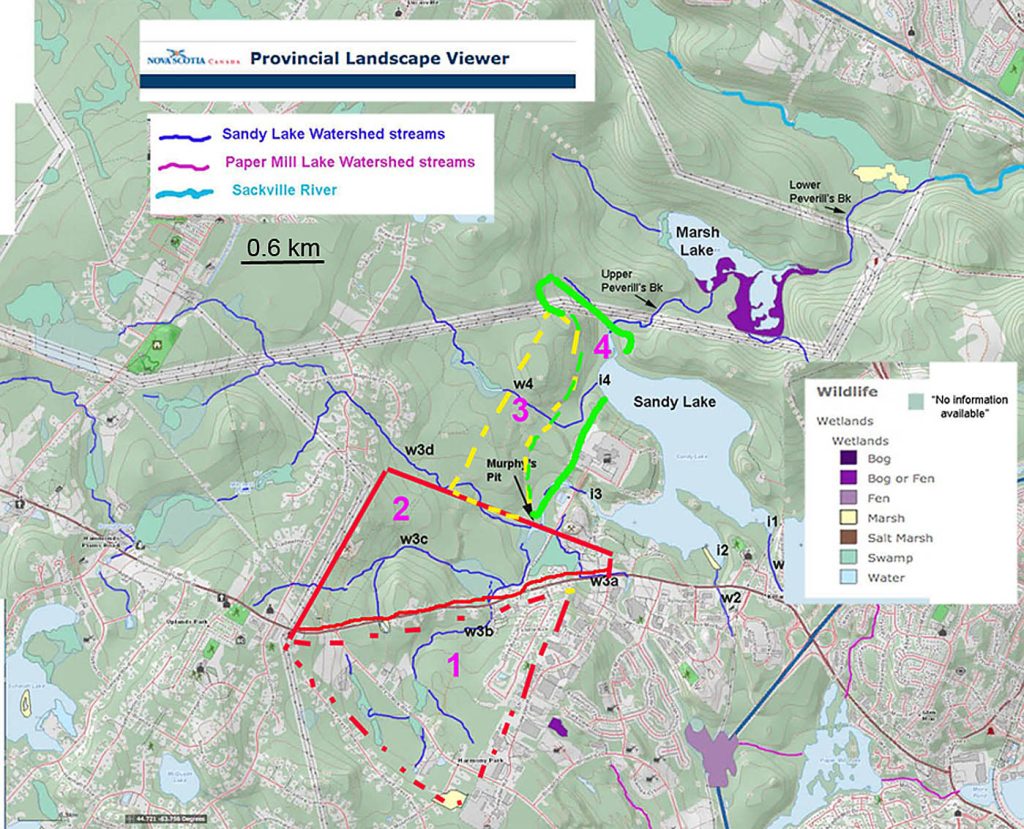
From the NS Provincial Landscape Viewer 8Jan2021 with rough overlay of Sandy Lake Holdings (Clayton Developments) plans for development within Sandy Lake watershed as indicated in Fig 9 in Document C030 – Sandy Lake, Request [to HRM] by Sandy Lake Holdings (Clayton Developments) for a new serviced mixed-use (residential/ commercial) community, dated 2021. (A more recent map is not currently publicly available). Source: https://cdn.halifax.ca/sites/default/files/documents/about-the-city/regional-community-planning/C030%20Combined_For_SPA_Website_May_5_2022.pdf.Key to Areas outlined 1: SubArea 12 (Bedford West) development already approved and ongoing. 2. Medium, Low and High Density and Park Open Space. 3. “Future Sandy Lake Development. 4. Conservation Lands (84 ha) View SW Fig 2 below for expanded area.
IIIh. Unassessed WESP Benefit #1: Phosphorous Removal
Phosphorous Removal is an important function of wetlands
Function Definition: The effectiveness for retaining phosphorus for long periods (>1 growing season) as a result of chemical adsorption and complexation, or from translocation by plants to belowground zones or decay-resistant peat such that there is less potential for physically or chemically remobilizing phosphorus into the water column. Scientific Support for This Function in Wetlands Generally: High. Being relatively flat areas located low in the landscape, many wetlands are areas of sediment deposition, a process facilitated by wetland vegetation that intercepts suspended sediments and stabilizes (with root networks) much of the sediment. Because phosphorus (P) is commonly adsorbed to the suspended solids, it will consequently be deposited… from Paul Raymond Adamus in Manual for the Wetland Ecosystem Services Protocol (WESP) version 1.3 October 2016.
Threshold Function Scores for Phosphorus Retention (PR) for the SLSA wetlands are given as 3.00 (scores are considered “Lower” if less of equal to this value) and 6.67 (scores are considered “Higher” if greater of equal to this value; a “Moderate” ranking assigned if value falls between the lower and higher threshold value) – Draft LSATable 3.6, p 12).
Three of the 13 wetlands which were assessed by the WESP process, had PR Function scores above 3.00 (Moderate to Higher), of those two were above 6.67 (Higher), and 10 of the 13 were rated Lower (Draft LSA Table 3.7 p 13)
Regardless those scores say very little or nothing about the Benefits (not reported in the LSA) because Benefit Scores are highly position- and context-dependent; even a relatively low level of P removal could be highly benefical, depending on the context.
Such is likely the case for these wetlands because (i) they are headwater wetlands for Sandy Lake and because (ii) of the current precarious state of Sandy Lake indicated by a long term trend of declining deep water (hypolomnion) oxygen, and since 2021, even shallow water oxygen (re: the Metalimnion oxygen Minimum”). This state has developed even though the spring phosphorous values place the lake in the upper Oligotrophic/lower Mesotrophic state, but is not unexpected in relatively shallow lakes (<20 m) – Sandy lake has a maximum depth of circa 20 m. Further, there is already evidence of phosphorus mobilization in Sandy Lake sediments associated with the low hypolimnion oxygen values.**See 2024 Limnological Profiles – return to historic trend of declining oxygen
Thus reducing the effectiveness of the headwater wetlands in removing phosphorous by introducing development up to 30 m from the wetlands &/or removing entire wetlands could very well and, I suggest, is very likely to “push the lake over the edge”. There is no mention of such possibilities in the Draft LSA. In any case, even if the Benefit Scores for Phosphorous Retention were reported, they would be of limited value in this regard:
“The Benefits model (as opposed to the function model) addresses only the opportunity to perform this function, not its potential positive or negative effects on ecosystems, which are too difficult to estimate with a rapid method.” from Paul Raymond Adamus in Manual for the Wetland Ecosystem Services Protocol (WESP) version 1.3 October 2016, page 7.
Some suggestion of the quantitative value of the wetlands in removing P is given by the AECOM 2014 study in which the predictions from their phosphorus load model overestimated Total P under existing conditions (when the report was written) by 67%, i.e. there was a missing “sink” for phosphorous which could very well be removal of phosphorus as water flows through the headwater watercourses/wetlands, which was not considered – see Critique of Predictions/No Followup Monitoring, item (iv) for details.
So we must not accept the WESP values as definitive in regard to significant Benefits of the headwater wetlands that could be severely affected should a development go ahead that does not include wide buffer zones and leave the current headwater wetlands intact.
It needs to be noted as well that (i) Bedford West Subarea 12 includes significant headwater wetlands that will be affected by ongoing, already approved development, (ii) climate warming is contributing to reduced oxygen levels/accelerated eutrophication of lakes likely including Sandy Lake*. Both of these factors place further value on or benefit to P removal by the currently remaining headwater wetlands.
IIIi. Unassessed WESP Benefit #2: Water Storage
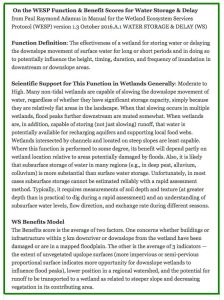
On the WESP Function & Benefit Scores for Water Storage & Delay
From Paul Raymond Adamus in Manual for the Wetland Ecosystem Services Protocol (WESP) version 1.3 October 2016. Section A.1 WATER STORAGE & DELAY
Threshold Function Scores for Water Storage (WS) for SLSA wetlands are given as 3.80 (scores are considered “Lower” if less of equal to this value) and 7.63 (scores are considered “Higher” if greater of equal to this value; a “Moderate” ranking assigned if value falls between the lower and higher threshold value) – Draft LSA Table 3.6, p 12).
Five of the 13 wetlands which were assessed by the WESP process, had WS Function scores above 3.80 (Moderate to Higher) only one above 7.63 of “Higher”; 7 of the 13 were rated Lower (Draft LSA Table 3.7 p 13).
Regardless those scores say very little or nothing about the Benefits (not reported in the LSA) because Benefit Scores are highly position- and context-dependent; even a wetland with relatively low WS function score could be highly benefical, depending on the context.
Of particular note from the description at right, just above: ” The Benefits score is the average of two factors. One concerns whether buildings or infrastructure within 5 km downriver or downslope from the wetland have been damaged or are in a mapped floodplain.”
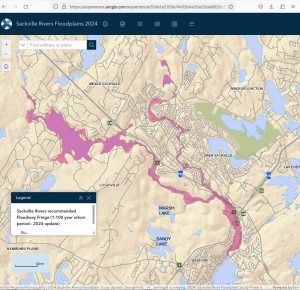
Location of Sandy Lake and the “Sackville Rivers recommended Floodway Fringe (1-100 year retrun period). Screen capture from the From interactive Sackville Rivers Floodplains 2024Map
The Sackville River Floodplain area, subject to repeated and severe flooding in recent years (e.g., see Reuters Jul 24, 2023), lies well within the 5 km distance (see map at right). So on that basis alone, it could be expected that a Water Storage Benefits Score for the WESP-rated wetlands – were it reported – would be high.
A comprehensive study of the Sackville River Floodplain was completed in 2017, – see Sackville Rivers Floodplain Study – Phase II, Dec 4, 2017) However, and inexplicably, the Sandy Lake Sub-watershed – the largest or second largest sub-watershed in the Sackville River watershed (depending on how the sub-sub watersheds are aggregated) and the associated possible housing development west of Sandy Lake (AECOM 2014) were not included in the modelling. From Page 13 In Submission to RP+10 Review from Sandy Lake-Sackville River Regional Park Coalition, April 24, 2020:
The floodplains of Bedford and Sackville are affected by what happens all around Sandy and Marsh Lakes. If the watershed around the lakes is further developed, this will cause the flood plains to be increased in size downstream, especially in Bedford. More hard surface means faster run-off.
On August 14, 2018, at the release of the 2017 Sackville River Floodplain Study Phase Two, Mr. W. Alexander replied to a question about why the expected housing development west of Sandy Lake was not included in the study. He answered that the city provided them with the scope of the study and, since Sandy Lake was not included in the scope, the city must therefore not be planning to develop at Sandy Lake for 100 years. Development at Sandy Lake would potentially increase the already troublesome flooding in Sackville and Bedford. The study is available at:
https://www.halifax.ca/sites/default/files/documents/business/planning-development/FinalReport.SRFS_.Phase2_.12April2017.pdf
Nor was this deficiency addressed in a recent update (DesignPoint, Apr 12, 2024) to the 2017 Report.
In addition to possible effects of the envisaged development/reduced wetland functioning on flooding downstream, there could be significant effects on Sandy Lake, just a short distance downstream. Because of its currently precarious state, Sandy Lake could prove to be very sensitive to increased intensity of flows which would carry more oxygen-consuming organic materials and organically- and inorganically-b0und phosphorous into the lake.
Such flows could result in
(i) increased oxygen consumption in the hypolimnion during the summer stratification and concomitant mobilization of sediment phosphorous and or
(ii) increased oxygen consumption in shallower waters, thereby accentuating the “Metlmnion Oxygen Minimum” observed in Sandy Lake during each of the years 2021, 2022, 2023 and 2024 and or
(iii) some destabilization of lake stratification in the summer, resulting in algal blooms as may have occurred in early Aug of 2019. In that case, I have suggested that a sudden intense but transient bloom of green algae was associated with destabilization of lake stratification following the deliberate removal of a beaver dam not far downstream from the lake – see Sandy Lake inundated by unpleasant, suspended, reddish, soapy material Aug 6, 2019; and lake level falling quickly. a post on this website Aug 7, 2019, updated Jan 31, 2021.
Such possibilities are speculative , but not alarmist; they are logically formulated scenarios related to well documented* declines in and now very low deep water (hypolimnion) oxygen during the period of summer stratification, and since 2021, the consistent appearance of a MOM (Metalimnion Oxygen Minimum) in shallower waters.
While declines in deep water oxygen are, in general, now well understood as to the cause, – and are being accentuated by climate warming – there is less known about mechanisms leading to the MOM phenomenon. Some possibilities I have suggested for Sandy Lake are (i) increased sedimentation in shallower areas of the lake towards the major inlet and (ii) increased oxygen consumption associated with deposition of woody debris following the clearcutting in 2013 – large masses of such debris occur in the northern basin of the lake associated with outwash from Karen’s Brook.
IIIj. Unassessed WESP Benefit #3: Sediment Retention and Stabilization
Nine of the 13 wetlands assessed by the WESP propotocol were given scores for Sediment Retention and Stabilization in the Medium range or higher; 3 had High scores (Tables 3.6 and 3.7, pages 11 & 12 in the Draft LSA., and no Benefit Scores are given.
Because the wetlands that stand to be degraded or even removed under the proposed development are fairly close to Sandy Lake, also as some of them have extensive surface areas that are flooded during high rainfall events or periods and thus could remove significant amounts of sediment, such degradation (or removal) is likely to result in higher sediment loads into Sandy Lake, a lot of it around the shallow southern basin. That’s a concern in relation to the Metalimnetic Oxygen Minimum in particular – we don’t know the cause of it, but as noted above, I have suggested that it could be related to already occurring increased sedimentation coming into the southern basin. Regardless, Sandy Lake could be expected to very sensitive to increased sediment load because of the low oxygen issues, also because the sediment itself may carry significant amounts of adsorbed and partiulcate phosphorous.
IIIk. Conclusion based on the evidence at hand
It’s clear that we need to have a better understanding of these phenomena in Sandy Lake in order to have some level of confidence in predicting the effects of new development on the headwaters and our abilities – or lack of abilities – to mitigate them.
My personal viewpoint based on the evidence at hand is that a development on the scale envisaged, even with the use of Best Management Practices , elimination of sewage inputs/introduction of full water services etc, will simply accelerate the ongoing decline in the state of the Sandy Lake. Sandy Lake is in trouble now, even without a major new development.
Surely for the sake of Sandy Lake remaining a precious recreational and ecological asset within a ‘Growth Landscape’, we can place such a development on some of the already ecologically degraded lands in the same general area. By doing so we would be helping to address both the Housing Crisis and the combined Climate/Biodiversity Crisis simultaneously. That’s whats called for in 2024.
How About it HRM and NS Gov?
IV. For Reference
Maps
SW Fig 1. Topographic Map showing Lakes, Streams & Wetlands of Sandy Lake & Environs.

From the NS Provincial Landscape Viewer 8Jan2021. Click on image for larger version. Streams within the Sandy Lake watershed and in other watersheds within the proposed Sandy Lake-Sackville River Regional Park are highlighted. i1-i4: Major inlets on Sandy Lake. w1-w4: Major watercourses associated with each of the 4 inlets. Wetlands: view key at bottom right. Note: some areas or patches within watercourses are labelled “No Information Available“, so their status as “wetlands” is not clear from the PLV. They could, for example, be floodplain forest, which is not classified as wetland, or they might be swamp or marsh. Smaller streams are not identified in the PLV. Lakes: Sandy Lake flows into Marsh Lake and thence to the Sackville River. Jack Lake (JL in map above) flows into Papermill Lake and thence into Bedford Basin.
| The term “watercourse” is used here in a broad sense to include “the bed and shore of a river, stream, lake, creek, pond, marsh, estuary or salt-water body that contains water for at least part of each year” (from NS Wildlife Habitat and Watercourses Protection Regulations). “Stream” is used in a more restricted sense as “A body of running water moving under the influence of gravity to lower levels in a narrow, clearly defined natural channel” (medwet.org). The watercourses highlighted above are those which have a direct influence on water flow and water quality of any of the three lakes and/or on the Sackville River, i.e. those through which water flows into any of the three lakes and/or the Sackville River; they are characterized by distinct streams (some are seasonal), and many or most include wetlands (swamp, marsh, fen); some may include floodplain forest. The NS Guide to Altering Watercourses (2015) provides some relevant diagrams, definitions, also for the Riparian Zone. View this Lit&Links page for description of wetland types. |
From AECOM 2014, 3. Hydrology
The Sandy Lake watershed extends over 24.2 km2 and includes all flow from the catchment area upstream of where Peverills Brook flows into the Sackville River. The primary surface water features in the Sandy Lake watershed are Sandy Lake, Marsh Lake, Peverills Brook and Bobs Brook, also called Johnsons Brook (Figure 1). The topography
of the Sandy Lake watershed consists of an upland area in the northwest, a depression containing Sandy Lake and Marsh Lake, and a slight rise in topography to the east. The highest elevation in the watershed is 139 meters above sea level.
The greatest flow into Sandy Lake is from Bobs Brook and other tributaries from the western portion of the watershed. Bobs Brook and its tributaries accumulate flow from Lucasville, Uplands Park, Kingswood North and Atlantic Acres Industrial Park. Two small, unnamed streams flow northward into the southern portion of Sandy Lake.
Two additional small, unnamed streams, likely fed by spring water, originate near the base of the northwest uplands area and discharge into the northern end of Sandy Lake and the upper reaches of Peverills Brook. Sandy Lake flows into Marsh Lake via Peverills Brook and from Marsh Lake into the Sackville River. Additional stream flow into Marsh Lake originates from the drumlins to the northwest of Marsh Lake and from one small stream flowing north into the southern portion of Marsh Lake.
…The flow from the Sandy Lake watershed is not gauged, so a precise estimate of flow volume and flow patterns is not available. Comparing the relative size of Sandy Lake watershed (24.2 km2) to the Sackville River watershed (147km2), the monthly mean flow from the Sandy Lake watershed is estimated at 0.8 m3/sec based on the flow of the Sackville River at Bedford, 4.99 m3/sec (Environment Canada 2014).
SW Fig 2. Topographic Map showing Lakes, Streams & Wetlands of Sandy Lake & Environs with areas of Approved and Envisaged Residential Development overlaid.
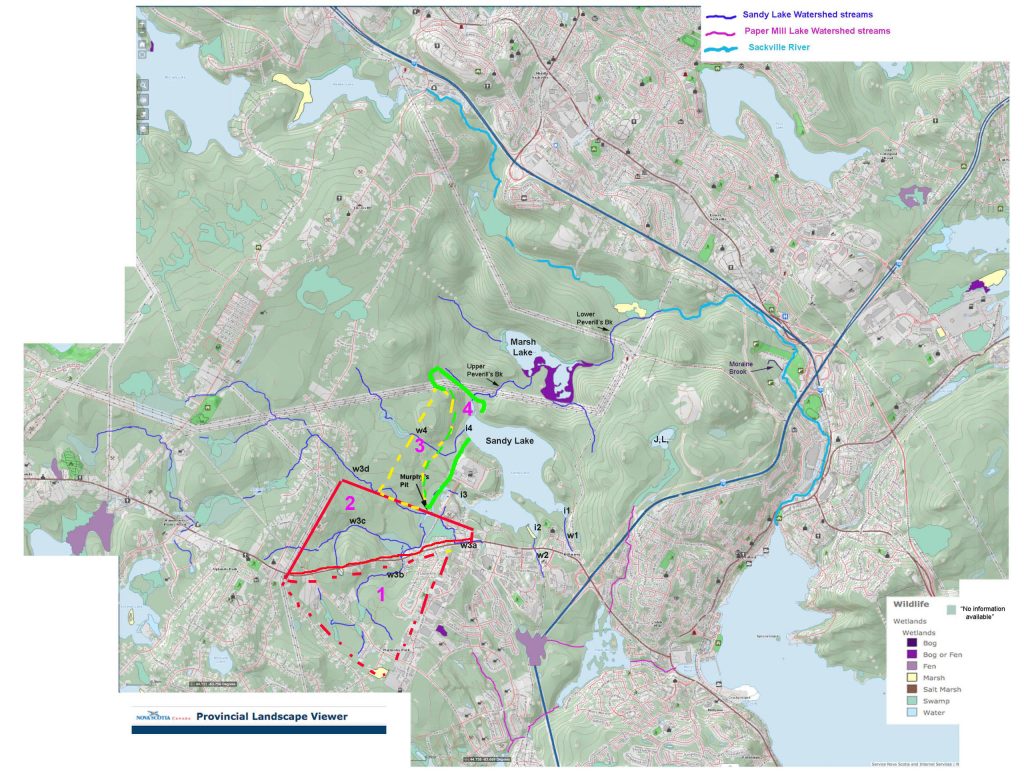
Map as above (“SW Fig 1”), with rough overlay of Sandy Lake Holdings (Clayton Developments) plans for development within Sandy Lake watershed as indicated in Fig 9 in Document C030 – Sandy Lake, Request [to HRM] by Sandy Lake Holdings (Clayton Developments) for a new serviced mixed-use (residential/ commercial) community, dated 2021. (A more recent map is not currently publicly available). Source: https://cdn.halifax.ca/sites/default/files/documents/about-the-city/regional-community-planning/C030%20Combined_For_SPA_Website_May_5_2022.pdf.Key to Areas outlined 1: SubArea 12 (Bedford West) development already approved and ongoing. 2. Medium, Low and High Density and Park Open Space. 3. “Future Sandy Lake Development. 4. Conservation Lands (84 ha)
