These figures, from Water Quality Monitoring in the Sackville River Watershed 2015 and 2016 by Bill Ernst and Damon Conrad for SRA illustrate the seasonality, and day to day variation even during peak salt times in winter.
“Environment and Climate Change Canada has monitored water quality since 2007 at two sites, the Little Sackville River above its confluence with the Sackville River (Sackville Cross Road) and one on the main stem of the Sackville River (below the Bedford sports field). The Little Sackville River site is an automated sampling station which continuously measures water temperature, conductivity, dissolved oxygen, pH and turbidity.
“…At this time, it is only the data from the Little Sackville River site which can easily be accessed for analysis, and the following summary for that site is presented.
“The data analyzed represent approximately 8000 individual data points, which were verified by Environment and Climate Change staff and data which could be determined to be anomalous were discarded (T. Smith pers. com. 2016).
“The data plotted in Figures 5 to 9 represent a relatively continuous timeline. The data were separated into seasons in order to better display differences related to time of year.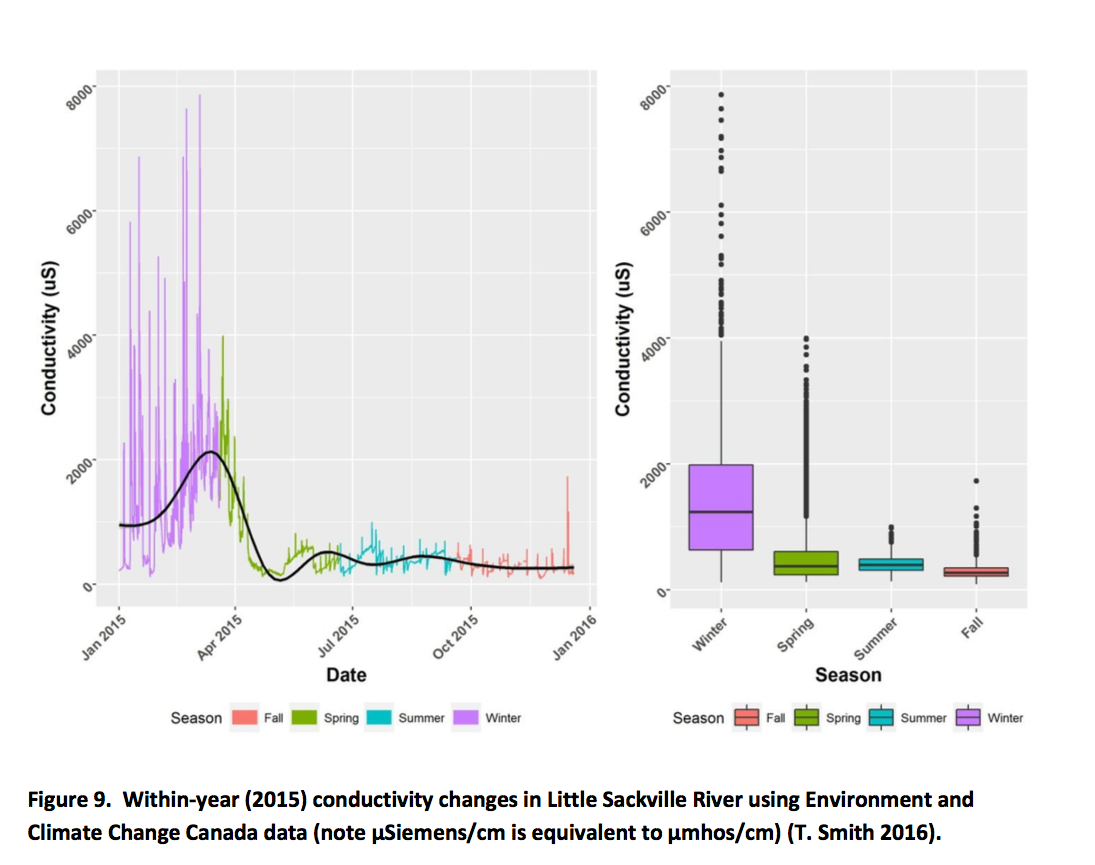
————-Click on images for larger versions————
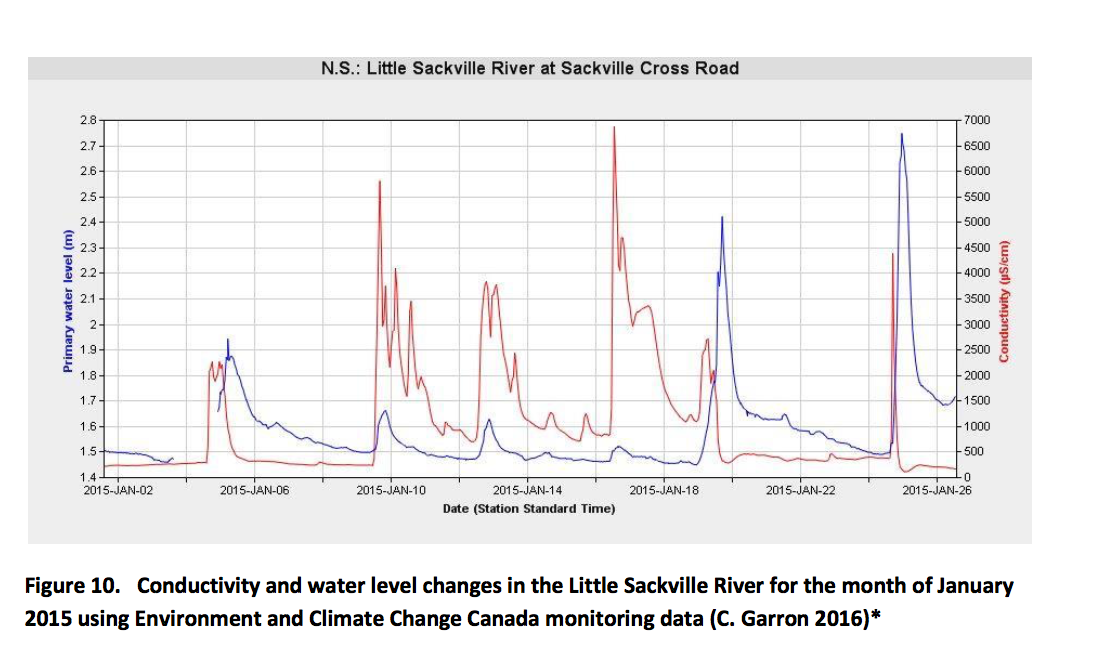
“While conductivity in the Little Sackville River was generally moderate during the summer months, it was substantially higher in the winter months. A likely reason for the higher conductivity in the winter months is the flushing of road salt into the river.
“Figure 10 presents the conductivity changes with water level in the LSR as measured by Environment and Climate Change Canada (C. Garron 2016). It demonstrates that in winter months, conductivity changes are closely matched by changes in water level and can be interpreted to mean that road salt being washed into storm drains during melt periods is the cause of conductivity changes.”