
Page posted Dec 29, 2017
pH & EC data over time last updated May 12, 2026
- Some historical pH and electrical conductivity values for Sandy Lake:
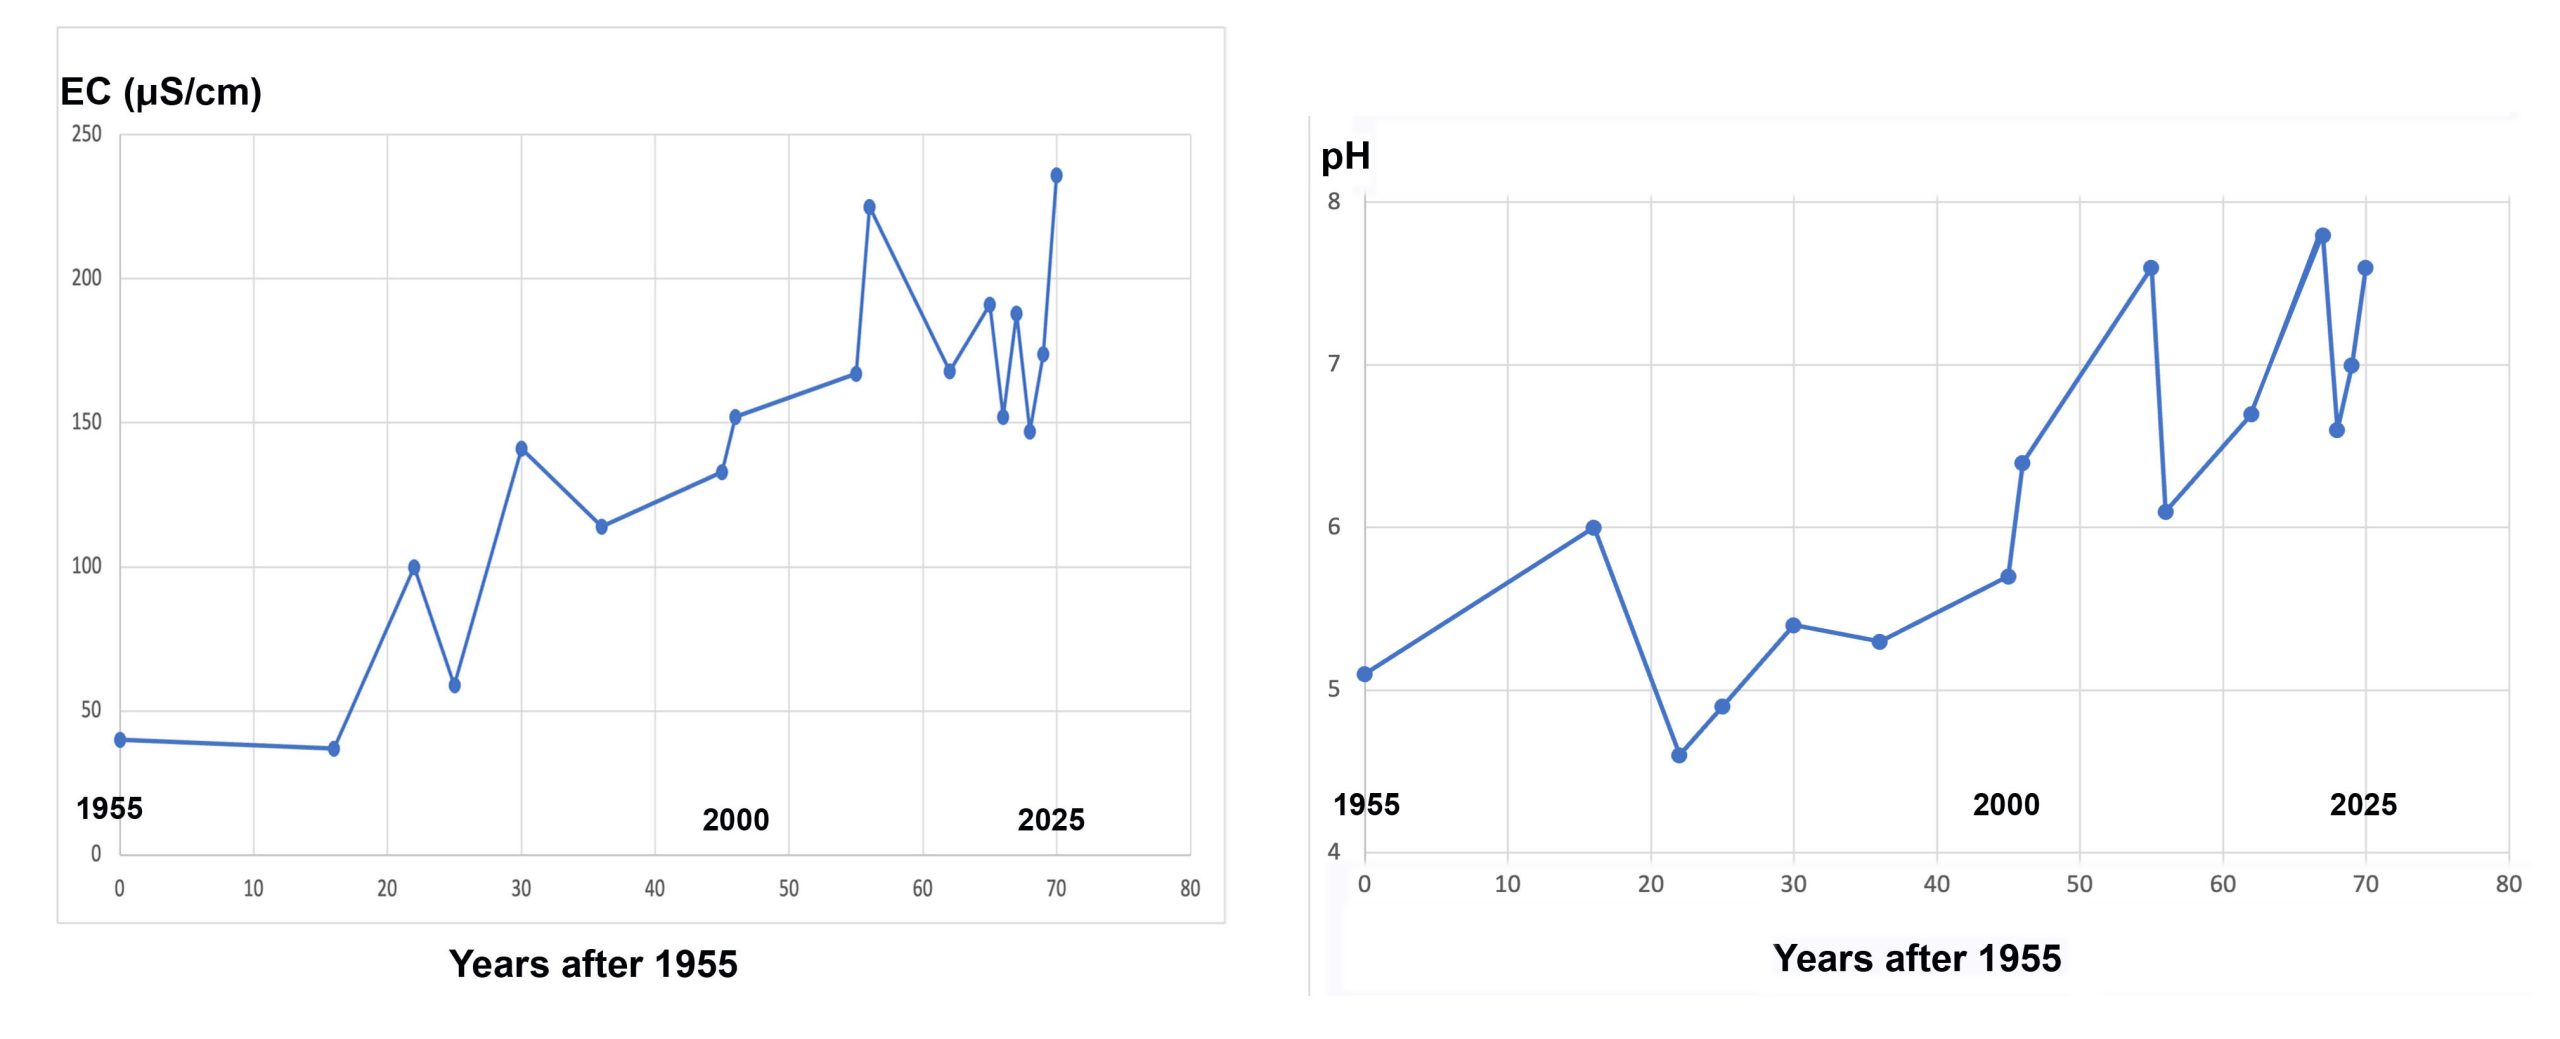
EC (SPC) and pH 1955 to 2025
| YEAR | 1955 | 1971 | 1977 | 1980 | 1985 |
| pH | 5.10 | 6.0 | 4.57 | 4.90 | 5.44 |
| EC | 40 | 37 | 100 | 58.9 | 141 |
| YEAR | 1991 | 2000 | 2001 | 2010 | 2011 | 2017 |
| pH | 5.29 | 5.65 | 6.3 | 7.56 | 6.12 | 6.70 |
| EC | 113.7 | 133 | 152 | 167 | 224.5 | 168 |
| YEAR | 2020 | 2021 | 2022 | 2023 | 2024 | 2025 |
| pH | – | – | 7.75 | 6.58 | 6.98 | 7.58 |
| EC | 191 | 152 | 188 | 147 | 174 | 236 |
SOURCES
2023, 2024. 2025: Average EC values for 12, 9 and 10 samplings respectively; pH values from Aug limnological profiles. 2022 pH value is for the spring limnological profile (conducted by LakeWatchers)
2020. 2021, 2022: Average for 11 values over 2020, 12 values in 2021 and 9 values in 2022; see More Monitoring
2017: View this website: Lakes/Limnological Profiles
2011: Synoptic water quality survey of selected Halifax-area lakes : 2011 results and comparison with previous surveys Pierre M. Clement and Donald C. Gordon.
2010: HRM Water Quality Monitoring Program results – Spring 2010
2001: Sandy Lake Development Impact Assessment Final Report – A Water Quality Analysis Damon Conrad, Hany Sidhom, Steve Matthews, W. Hart 2002
1980-2000: from Synoptic Water Quality Survey of Selected Halifax Regional Municipality Lakes on 28-29 March 2000 by P. Clement et al., 2007. Mandell (1994) reported similar values for 1991-1992 (average from 4 samplings, pH5,35, EC 111)
1985: JACK LAKE Environmental Evaluation Final Report. Canada Mortgage and Housing Corporation & Nova Scotia Department of Housing, Sampling May 14-15.
1977: Watt, W.D. et al., 1979. Acidification and other chemical changes in Halifax County lakes after 21 years. Limnology & Oceanography 24 B: 154-161. Samples in June 1977.
1971: Metropolitan Area Planning Committee (MAPC). 1972. Water quality survey for selected metropolitan area lakes. 1971-1972. Task Group on Water Supply and Waste Disposal. Halifax, NS. Feb 1972. Data for Lake 31 (Sandy Lake) all EC Data: N Inlet 57.0 S Inlet 57.0 Surface 37.0, 59 feet: 39.0, Outlet 39.0, sampled Aug 30, 1971
1971: Observations in July 1971: pH 6.0, EC 37.0; lake area 81.8 ha; max depth 19.2 m From DESCRIPTION OF SELECTED LAKE CHARACTERISTICS AND OCCURRENCE OF FISH SPECIES IN 781 NOVA SCOTIA LAKES, D. R. ALEXANDER et al.1986 PROC. N.S. INST. SCI (1986) Volume 36: Part 2, pp. 63-106
1955: Gorham, E. 1957. The chemical composition of lake waters in Halifax County, Nova Scotia. Limnology & Oceanography 2: 12-21. Sampled in Dec 1977. pH is average before and after aeration of the sample.
2. Values of electrical conductivity, pH and temperature around the perimeter of Sandy Lake on Aug 10, 2017.
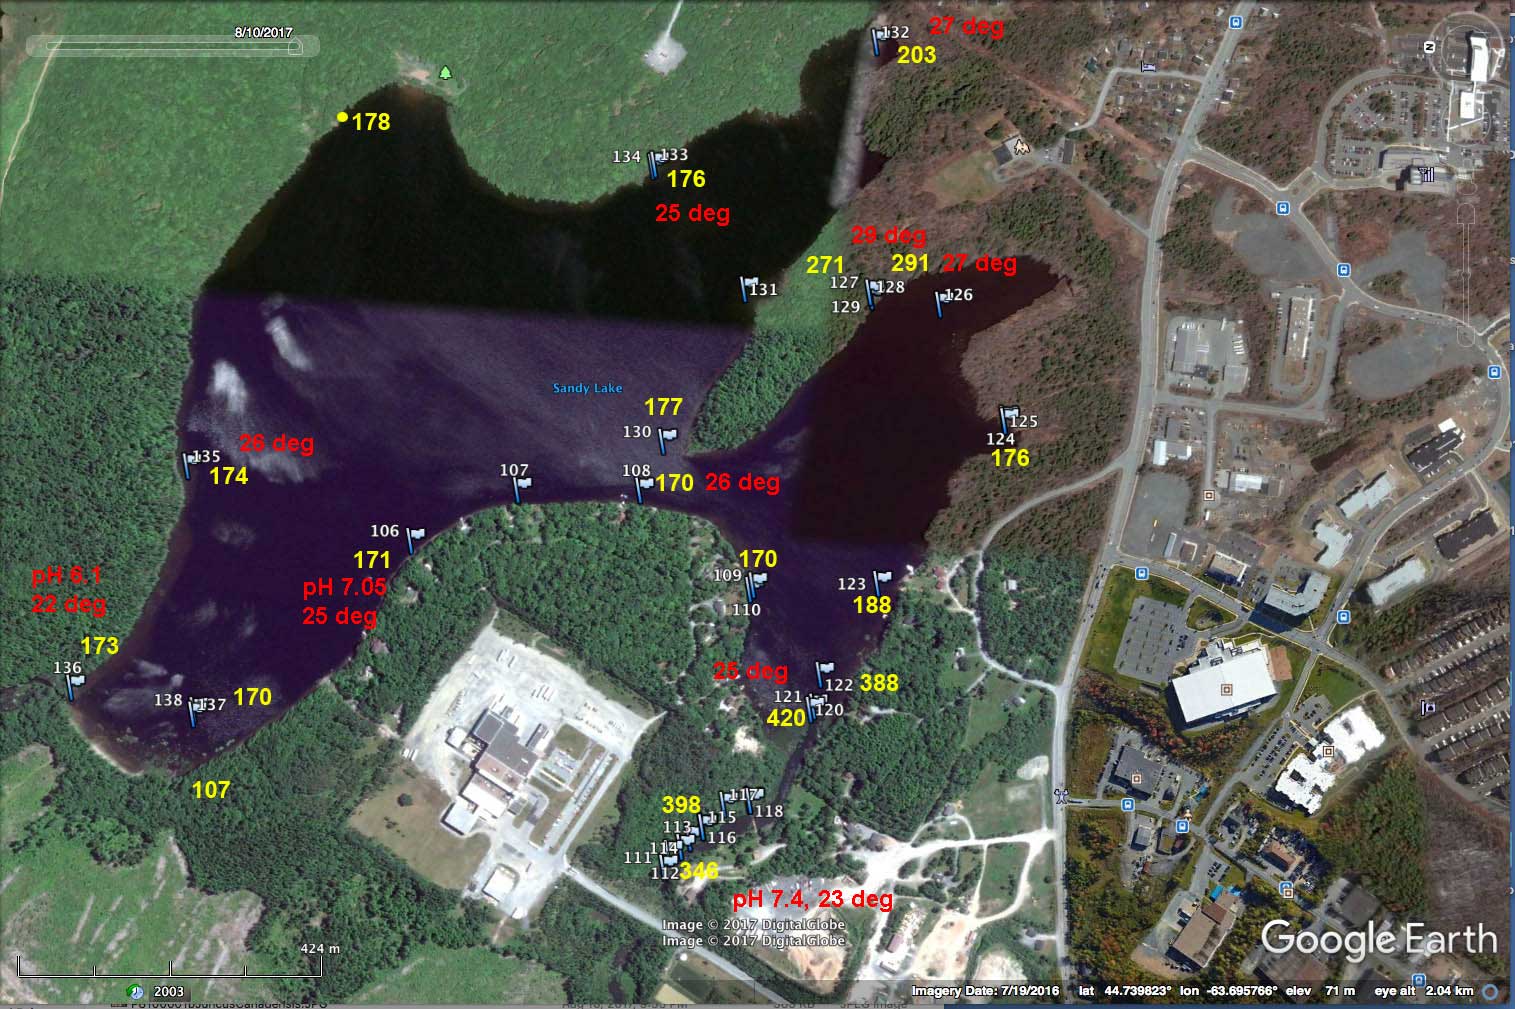
Above: Values of electrical conductivity (yellow numerals; units are uS/cm), pH (red) and temperature (red) of surface water at different locations on Sandy Lake on Aug 10, 2017.
Click on image for larger version
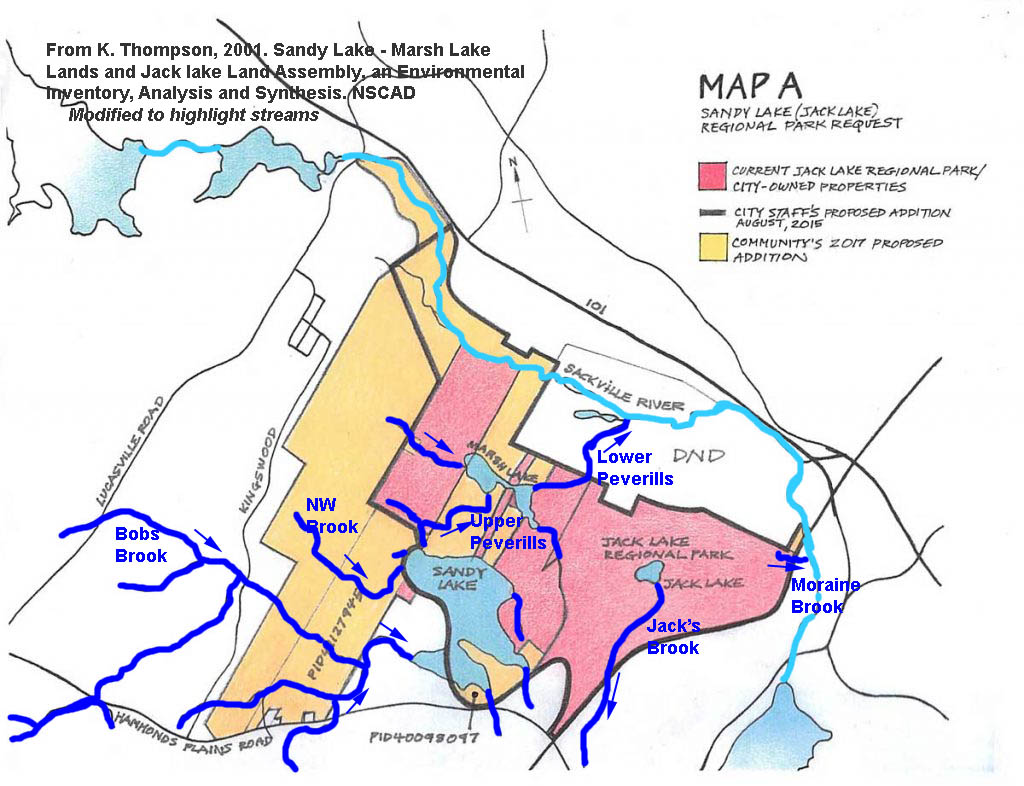
The highest EC values occurred near the mouths of the 3 streams draining settled areas at the south of the lake. (view Stream Map) (from south east to south west 203, 271/291, and 420/398).
—————————————————
3. Values of electrical conductivity, pH and temperature for surface waters on various dates in 2017.
—————————————————
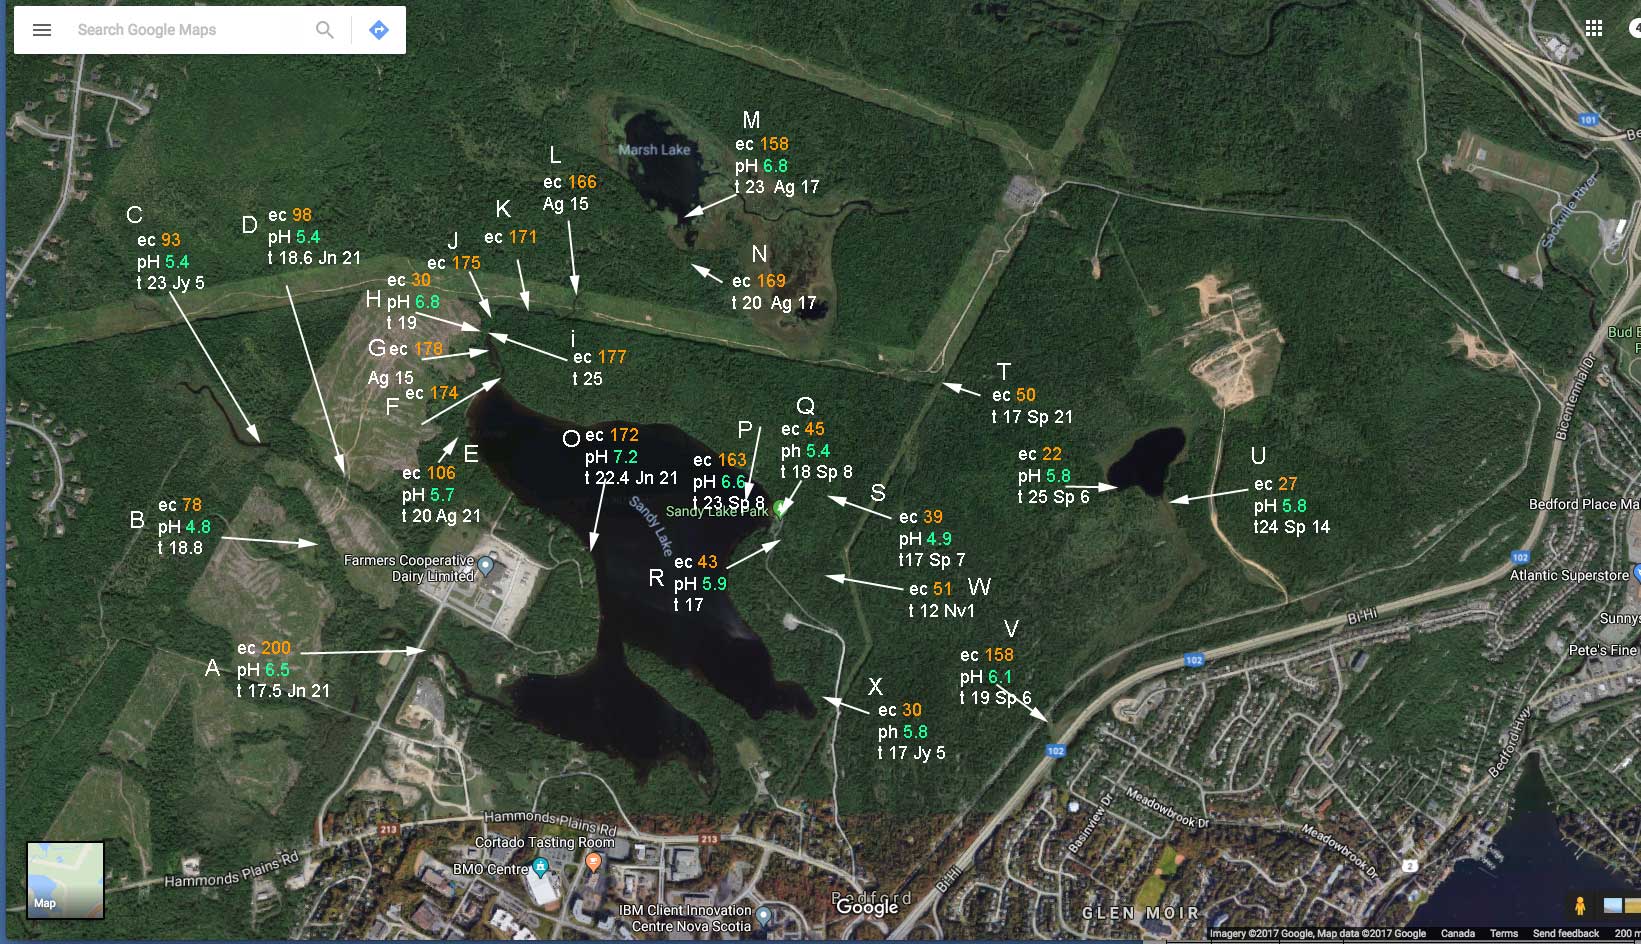
Above: Values of electrical conductivity, pH and temperature for surface waters on various dates in 2017.
Click on image for larger version
Note the higher EC values for streams on the west side of the lake than on the east side of the lake and, in general, that pH values for streams are lower than values for Sandy Lake (see also figure above) except for Bob’s Brook (also known as Johnson’s Brook; it enters the lake at the southwest corner of the lake) and Peverill’s Brook flowing to Marsh Lake.
—————————————————