
More details on Sandy Lake re: section 4.2 Critique of the AECOM (2014) Predictions/No Followup Monitoring:
(Updated Mar 18, 2023)
Also view comments by S. M. Mandaville (2014) – also available here; and Dr Hansen and the Sandy Lake Conservation Association (2014).
(i) As cited by AECOM (2014), modelled phosphorus concentrations differed by far more than 20% of the measured concentrations (it was 67% higher), indicating the model is not valid, but they did not follow recommended procedures to revise the model.
From AECOM (2014) Appendix E, p.13:
The predicted phosphorus concentration in Sandy Lake under current conditions is 20 µg/L. This predicted value is significantly greater than the median measured phosphorus concentration of 12 µg/L. Brylinsky (2004) and MOE (2010) indicate that a model is not valid if the modeled phosphorus concentrations differ by more than 20% of the measured concentrations, as is the case with the Sandy Lake results.
As discussed in Section 3, the model assumptions may over-predict phosphorus concentrations by not factoring in phosphorus retention as water travels within the watershed before it reaches the lakes. Predicted phosphorus inputs to the lakes can be reduced by adjusting the lake phosphorus retention coefficient, which in turn reduces the predicted lake phosphorus concentration.
In this study, the phosphorus retention coefficient was adjusted from 0.33 to 0.6 in the LCM to reduce the predicted phosphorus concentration to match the measured phosphorus.
Brylinski 2004, p. 38ff, provides a detailed example of how model re-evaluation was conducted for a case – Lake George in Kings Co. – in which “The model under predicts the lake’s phosphorus concentration by 21.9 % which is above the 20% difference generally considered acceptable for model validation.” None of the steps for re-evaluation advised by Brylinski 2004 were conducted by AECOM 2014 even though the predicted value exceeded the observed value by a much larger factor (67%); rather AECOM 2014 made the model work by “adjusting the lake phosphorus retention coefficient… from 0.33 to 0.6 in the LCM to reduce the predicted phosphorus concentration to match the measured phosphorus.” This is not a procedure cited by Brylinski 2004.
The MOE 2010 document cited by AECOM likewise adopts a maximum of 20% difference between observed and predicted P values as acceptable. As in Brylinski (2004), the MOE (2010) document makes no mention of a one-stop book-keeping fix for the model as applied by AECOM 2014. So the predicted impacts of development and of mitigative measures on lake Total P are highly hypothetical.
(ii) Setting the Water Quality Objective (WQO) for Total P in Sandy Lake at 50% above the “current value” rather than at the “predevelopment level” is not justified.
AECOM (2014) provides the following rational for setting the WQO for Total P at 50% above the current value (blue highlighting as in the original text):
7.1 Development of Total Phosphorus Water Quality Objectives (WQO)
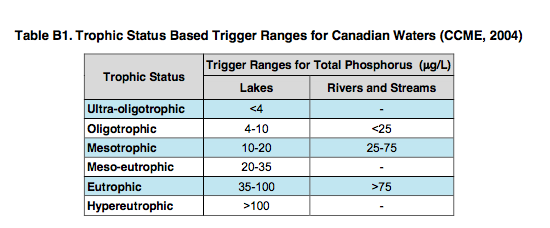
For the Sandy Lake watershed AECOM recommends the use of Environment Canada’s trophic status classification to set WQOs for total phosphorus.
As noted in section 1.2.1, an objective of the 2006 HRM Regional Plan is to “maintain the existing trophic status of our lakes and waterways”. This suggests that both Sandy and Marsh Lakes should be maintained in their current mesotrophic state and so the WQO (water Quality Objective) for total phosphorus should be the upper limit of the mesotrophic range, or 20 g/L. However, since both lakes are currently at the lower end of the mesotrophic range, considerable water quality degradation could occur before the lakes were at risk of exceeding such a WQO.In an effort to maintain current water quality and meet the Regional Plan objective, we recommend a dual management objective: (1) maintain the trophic status of the lake and (2) restrict total phosphorus increases to less than 50% above current conditions. If a monitoring program shows that this WQO is being exceeded, then management action would be warranted to protect the lake. In this approach the WQO becomes a “trigger value” for action. This approach is consistent with the objectives of the Regional Plan, which seeks to maintain the existing trophic status to the extent possible.
Defining the current water quality conditions is essential to establishing WQOs. As presented in Section 5.1.1, Sandy Lake is currently at the lower limit of mesotrophic range with a median total phosphorus concentration of 12 μg/L. An increase of 50% results in a WQO of 18 μg/L. Marsh Lake median total phosphorus concentration is 10 μg/L, resulting in a WQO objective of 15 μg/L.
In commenting that “that both Sandy and Marsh Lakes should be maintained in their current mesotrophic state and so the WQO for total phosphorus should be the upper limit of the mesotrophic range, or 20 g/L”, AECOM (2014) seems to have taken a cue from the MOE (Ontario Minister of Environment) 2010 document in which it is suggested that “If the model fails….a total phosphorus concentration of 20 µg/L will be used as the upper limit to protect against nuisance algal blooms.”
In recommending that increases in Total P be restricted to less than 50% above current conditions, AECOM presumably was referencing Ontario’s proposal for an an “allowable increase of 50 per cent above the predevelopment level” (OME 2010, updated Jan 11, 2017; also cited in US EPA document Nutrient Criteria Technical Guidance Manual, Lakes and Reservoirs).
However, rather than citing “predevelopment level” as in the Ontario reference, AECOM 2014 refers to “increases to less than 50% above current conditions”. By taking an average value over 2006-2013, a period when Total P was increasing, the AECOM (2014) calculated “current value” (12 ug/L) falls in the mesotrophic range. From AECOM (2014):
5.1.1 Total Phosphorus
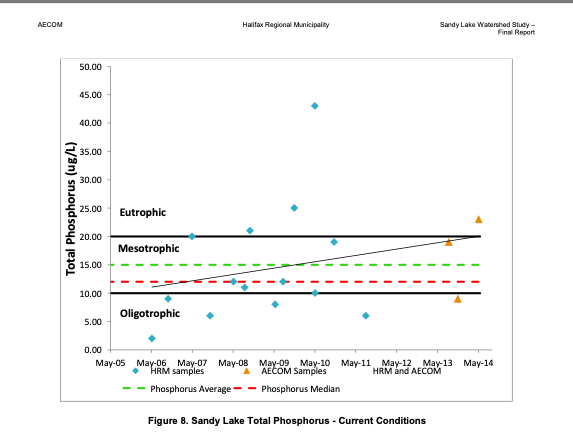
Total phosphorus in Table 3 ranged from 2 ug/L to 43 ug/L between 2006 and 2013 (Figure 8). The median concentration of total phosphorus is 12 ug/L, which places the current water quality of Sandy Lake in the lower end of the mesotrophic range. This indicates the lake water quality is good and has moderate biological productivity.
…For a historical perspective Figure 9 presents the results from all previous sampling events: resident sampling from 2005 to 2007, DFO sampling in 1980, 1991 and 2000, and NSE sampling in 1998. The graph illustrates increasing total phosphorus concentrations over the past 30 years, suggesting Sandy Lake is receiving man-made nutrient inputs from its watershed. The lake appears to have transitioned from a generally oligotrophic state to a mesotrophic state. The observation of increasing total phosphorus is consistent with information presented by Mandeville (SWCSMH 2013a) who considered the phosphorus trends from 1980 to 2011 and used this data and other sources to predict pre-development phosphorus concentrations.
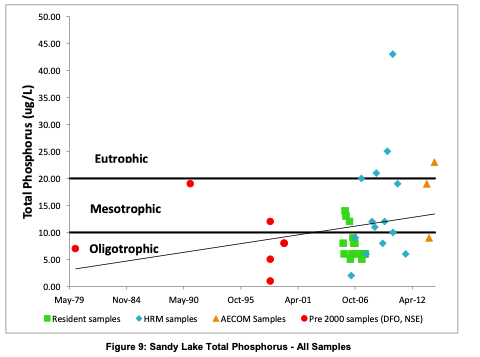
It is noted that in their calculation of the “current value”, AECOM (2014) excluded “Resident Samples” (green symbols in Fig 9) without comment as to why; had those been included, the average would have fallen below 10 ug/L. The values for those Resident Samples’ in Fig 9, seem to be pretty much in line with the trend up to that date so should not have been suspect.
With 12 ug/L as the “current value”, and 50% above that as the WQO ((18 ug/L), the predicted total P values with development fall below the WQO, except for Scenario 2B (not included in AECOM 2014) which is very marginally above 18ug/L:

SOURCE: Sandy Lake Watershed Study – Additional Modelling Scenario in a letter dated Feb 12, 2015 addressed to Mr. Cameron Deacoff, Planning and Infrastructure Halifax Regional Municipality from Steve Murphy, MBA, P.Eng. Senior Manager, AECOM/Atlantic Canada. View Document
Had AECOM 2014 used a “predevelopment level” of Total P in Sandy Lake, e.g. estimated from all five pre-2000 values in 2009, that level would be 8.8 ug/L and the WQO 13.2 ig/L.* The earliest value available (from 1 Jan 1980) was 7 ug/L for which the WQO (at 50% higher) would be 10.5 ug/L. Either way, use of an estimate of the predevelopment level of Total P – as conventionally applied – would have resulted in most of the predicted outcomes with development not being acceptable. *Six pre-2000 values are shown in AECOM (2014) Fig 9, but I could locate only 5 of those in AECOM (2014) Appendix C. It makes little difference; if the interpolated value from Fig 9 for the missing value is included, the estimate is 8.7 ug/L
There is a large literature, not cited in AECOM 2014, on use of computer modelling* and paleolimnological techniques to “hindcast” lake Total P values, and Sandy Lake specifically was one of the 51 lakes included in Queens University studies in which historic Total P and other variables were inferred from sediment diatom composition (Rajaratnam, 2009; Smol et al., 2015.) The inferred values: 5.62 ug/L for sediment surface (reflecting conditions in 2005-2006 – note that value is within the range of Total P in lake water samples taken at the time, re: AECOM 2014 Figs 8 & 9 shown above), and 8.91 ug/L for the deep sediment sample (100-150 yr earlier).** Sandy Lake (as sampled in 2005-2006) was considered one of the “19 otherwise relatively pristine lakes had increases in planktonic taxa consistent with observations linked to changes in lake seasonality and limnological changes most closely linked to climate warming in Nova Scotia and other regions.”
______________
*E.g., as described in Brylinksi 2004, “Hutchinson (2002) presents a means whereby a phosphorus water quality objective can be set for a lake that has already been subjected to development. The approach involves using a validated phosphorus model based on export coefficients, and simply removing the development contribution of phosphorus to determine the pre-development lake phosphorus concentration. He stresses, however, that the model must be well developed and validated, if the results are to be of any significance. “
**It is curious that the historic (100-15) years earlier value (8.91 ug/L) is higher than the inferred sediment surface value (5.62 ug/) for 2005-2006. A possible explanation: increased total P due to logging activity in the watershed and on the lake in the earlier period. “Logs cut in the Sandy Lake area floated through Sandy Lake to Marsh Lake and Peverell’s Brook to the Sackville River. Upon reaching the Basin, they were boomed until being processed in the mill. Dams for gathering logs were constructed in the stream connecting Sandy and Marsh Lakes, and below Marsh Lake. These dams remained into the mid-twentieth century, local residents recalled. L.” As well “The early 1800s saw the development of many shingle and saw mills along the streams leading to Sandy Lake”. Quotes and photo below from Sandy Lake Community Profile by Dalhousie and Nova Scotia College of Art and Design, 2002,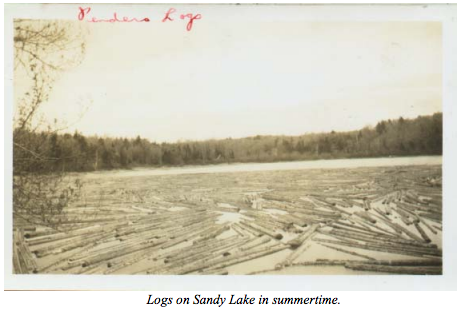
Professional limnologist Shalom Mandeville raised this issue is regard to Sandy Lake in 2013, citing the Queens University studies, and his own hindcast value for Sandy Lake (6.3 ug/L) made in 1997*
*Shalom Mandaville: SANDY LAKE, Bedford:- Accelerated eutrophication signs, and suggested restoration parameters. Letter to Chair & Members, North West Community Council, HRM Oct 30, 2013. View also Phosphorus:- Details on LCC (Lake Carrying Capacity)/Threshold values of lakes, and comparison with artificially high values chosen by the HRM, Document prepared by S. M. Mandaville, March 14, 2014, addressed to NS Minster of Environment and others.
Clearly, AECOM 2014 could have made its own best estimate of predevelopment Total P levels, or made use of those cited above.
The use of “current level” rather than an estimate of the “predevelopment level” also does not make common sense. If the HRM objective is to “maintain the existing trophic status of our lakes and waterways”, how can the WQO be set at 50% higher than the current (circa 2012) value? According to this interpretation of the statement “maintain the existing trophic status of our lakes and waterways”, no efforts would be made to reduce phosphorus levels in lakes that currently have phosphorus levels highly elevated above recorded historic levels such as Banook Lake. All that is being maintained is the classification of the lake as mesotrophic.
It is difficult not to view AECOM (2014)’s use of a “current value” rather than an estimate of the “predevelopment level” as an effort to make the projected effects of proposed developments on Total P fall within acceptable levels. Whether deliberate or inadvertent doesn’t really matter at this point, only that it be recognized that the Water Quality Objective used by AECOM 2014 was not appropriate and brings into question their prediction that development as considered is compatible with maintaining desirable water quality in Sandy Lake.
(iii) AECOM 2014 cites evidence showing that in its current state (at 12 ug P/L ), Sandy Lake is already seriously degraded.
In 1979, Total P was 7 ug/L or less, well under the upper limit (10 ug/L ) for oligotrophy (the ‘clean’ state of a lake); the transition to mesotrophic status occurred circa 2001 (re AECOM Fig 9). AECOM (2014) cites data showing that by 2008-2011 deep water Total P on some samplings was much higher than surface water P, which they attributed to oxygen deprivation. From AECOM 2014:
Table 5 compares the phosphorus concentrations of shallow (epilimnion) to deep (hypolimnion) samples from three sampling events. Total phosphorus concentrations in the shallow surface (epilimnion) samples are less than in the deep (hypolimnion) samples in two of the three examples. Although the data are limited, this suggests that the deeper portions of Sandy Lake may be fully or partially oxygen- deprived during certain times of the year, a situation that may arise when decomposing organic matter consumes available oxygen at depth. This in turn promotes the release of phosphorus from lake sediments, which is recorded in the water samples.

Total P is a well validated and widely accepted predictor of the general condition of temperate lakes, but it is also well recognized it does not predict the precise condition of a particular lake. For a set of Ontario lakes, Malot et al., 1992 observed that “lake morphometry exerts a large influence on profiles and this influence is particularly evident in shallow (<20 m maximum depth) oligotrophic lakes” and that “Predictions of O2 profiles are sensitive to changes in TP concentrations, with all study lakes predicted to have severely O2-depleted hypolimnions by the end of summer at an epilimnetic TP of only 15 ug.L-1.” At 21 m maximum depth, Sandy Lake could likewise be expected to very sensitive to Total P concentrations and indeed the evidence cited by AECOM 2014 suggests significant deterioration in hypolimetic oxygen at Total P of 12 ug.L-1.
(iv) Varying the phosphorus export coefficient, rather than increasing the lake retention coefficient would be a more realistic “fix” to make the model work and would likely increase the predicted impacts of development on Total P
The failure of the Phosphorus Model to meet the criterion of Brylinski (2004) and MOE (2010) that the predicted Total P values for existing conditions be within 20% of actual values and by a large factor means that the model as applied by AECOM 2014 cannot be regarded as a good description of how the system is working.
The model overestimated Total P under existing conditions (when the report was written) by 67%, yet it is making predictions of changes of Total P under different management scenarios of 1-4 ug/l, i.e of 8-33%. The model was made to work by increasing the lake P Retention Coefficient from 0.33 to 0.6, i.e. by assuming that more P is being trapped in sediments than initially assumed. However, as cited above there is actually evidence that lake phosphorus retention has probably been reduced because of lowered oxygen in the hypolimnion in some years.
AECOM (2014) does not mention that evidence in relation to the lake P Retention coefficient, but it does cite two possible sources of error (p 10 of Appendix E) that could have resulted in the overestimation of Total P under existing conditions: (i) removal of phosphorous en route from the sources to the lake in the ground for systems on septic, and in watercourses or overland flow; and (ii) dilution by groundwater; these factors are not included in the standard LCM model as presented by Brylinski (2004).
The extent of dilution by groundwater would depend on the concentration of phosphorus in the ground water (likely to be less and possibly zero or much less than in surface waters), and the flow of groundwater relative to surface waters. They estimated the flow of groundwater to be 11% of total flow, so the error associated with this factor is likely to be low in comparison to the difference between predicted Total P values for existing conditions and actual values.
The absorption of septic P en route to the lake is also likely to be small compared to the overestimate of Total P under existing conditions, as diverting both the Uplands Park Waste Water Treatment Facility effluent (or the input to the Facility) reduces lake total P by only 1 ug/L according to the AECOM 2014 model.
Removal of phosphorus as water flows through watercourses however could be very significant. From Brylinski (2004):
The model makes no allowance for the assimilation of phosphorus within upstream rivers or streams entering a lake, or for tributaries contained within a lake’s drainage basin. This is a potentially serious limitation if the model is used to determine the permissible level of development within the watershed of a lake that has effluents entering lakes located downstream. If a downstream lake exceeds a phosphorus objective, no upstream development would be allowed.
The retention of phosphorus in streams and rivers can result from settling of particulate phosphorus, sorption of dissolved phosphorus to stream sediments, chemical precipitation of phosphorus, and uptake of phosphorus by benthic algae and macrophytes (Wagner et al. 1996). Behrendt and Opitz (2000) carried out a number of studies in which it was found that as much as 20 to 40 % of the phosphorus load was retained within streams before reaching the receiving water body.
This limitation is acknowledged in Appendix E of the AECOM 2014 Report, p. 10 and it is commented that “The retention of phosphorus from water as it travels through the watershed can be approximated in the LCM by varying the phosphorus export coefficient as needed”. However, that was not done, rather “the lake phosphorus retention factor (a variable that approximates the amount of phosphorus removed through sedimentation within a lake) can be used to approximate both phosphorus retention during transport and dilution by groundwater.”
There could be a large difference between the effects of development on lake Total P so estimated, and the effects if they were estimated with consideration of P removal in watercourses. Currently, phosphorus from settled areas goes into watercourses fairly high up in the watercourses; much of the proposed development would be closer to the lake and thus bypass a lot of the watercourse, including the large wetland NIA1. This could result in a much higher proportion of the phosphorus from settled areas going into the lake than currently assumed.
UPDATE Aug 29, 2023. In addition, there is now clear evidence of “Internal Phosphorus Loading” in Sandy Lake in some years, i.e., not only is the lake likely to be removing P, it may, at least in some years, be a net source. See Points #4 and #5 in Comments to Stantec (June 22, 2023).
(v) Further monitoring, as strongly advised by AECOM 2014, was not conducted.
One route Brylinski (2004) and MOE (2010) advised to revising an invalid model is to conduct more monitoring; AECOM 2014 was explicit on the need for more monitoring. From page iii of the Executive Summary:
“The predictions from the phosphorus load model are consistent with observations of urbanization in other watersheds. However, the degree of influence of urbanization on water quality in Sandy Lake can only be approximated using the phosphorus load model because of limitations arising from assumptions and uncertainty in the application of the model. Therefore a robust water quality monitoring plan is proposed for the Sandy Lake watershed to provide a further assessment of current conditions and to evaluate the impacts of development on the water quality.”
Section 9 (p 42) in AECOM (2014) provides specific recommendations for robust Water Quality Monitoring.
The AECOM Report was submitted in 2014. In 2020, such monitoring had still not been initiated, and, I was told, a request for Secondary Planning in the study area of the AECOM report was submitted to HRM in the summer of 2020.
So we could be proceeding to secondary planning without any validation of the AECOM model as advised by AECOM 2014, or revision of the model as advised by Brylinksi (2004).