DRAFTING Last Revision on Sep 8, 2024.
NAVIGATION
www.versicolor.ca
![]() /sandylakebedford Home Page for Sandy Lake & Environs (Bedford, NS)
/sandylakebedford Home Page for Sandy Lake & Environs (Bedford, NS)
![]() /Surface Waters
/Surface Waters
![]() /Sandy Lake A Draft report On the State of Sandy Lake…Feb 21, 2021
/Sandy Lake A Draft report On the State of Sandy Lake…Feb 21, 2021
![]() /Limnological Profiles
/Limnological Profiles
Subpages:
– 2023 Limnological Profiles, effects of episodic precipitation and occurrence of a Metalimnetic Oxygen Minimum
– 2024 Limnological Profiles – return to historic trends
– –Addendum 1: Trends in Conductivity/Salt Content (This Page)
– – Addendum 2: On Wetlands

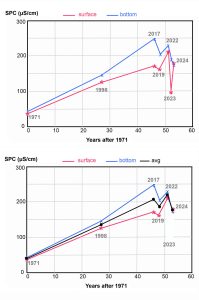
Fig 1. Specific Conductivity values for surface water and deep-near-the-bottom water at Sandy Lake 1971 to 2024. In the lower figure the 2023 data are excluded and the averages between surface and deep samples are plotted. SPC is a measure of salt content – EC (salt) Notes.
In my DRAFT Report On the State of Sandy Lake, the Historical Trends and its Future Trajectory (Feb 23, 2021) I commented under 4.3 Relevance of information gathered or made available after 2014, 4: Road Salts (in summary):
Rising levels of salt in Sandy Lake are highly concerning. Currently, levels are below the the CCME Guideline for long term exposure (120 mg/L chloride) which is also the WQO for chloride cited by AECOM (2014) for Sandy Lake. There is some salt stratification and it appears to be intensifying with time. At some point salt stratification could impair normal spring turnover if it is not already doing so in some years.
Observations subsequent to that date for 2021, 2022, 2023 and 2024, plotted in the figures at top right, suggest a leveling off of conductivity values after 2017 and even a significant decline associated with the extreme precipitation in 2023.
This may be attributable to two factors:
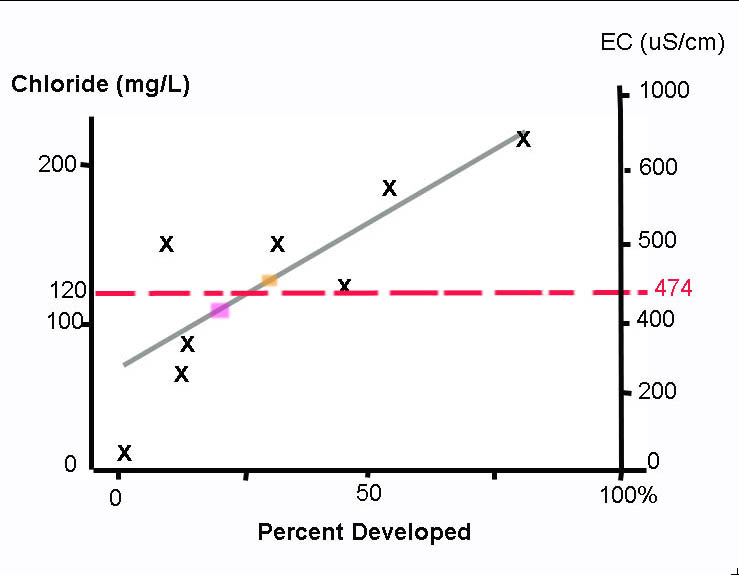
(i) A leveling off of new development within the watershed. Approximately 0%, 21% and 25% of the watershed was developed in 1967, 1986 and 2014-2020 respectively (see Land Use) and there have not been a major development within the last several years. It is well documented that in the Halifax Region, Watershed Land Use is a good predictor of the springtime concentration of chloride (Scott et al., 2019; Bermarija et al., 2023), although Scott et al., 2019 would predict a substantially higher equilibrium (leveling off) value, circa 400 uS/cm than we are seeing currently (circa 175 uS/cm) – See Fig 2 below.
(ii) Reduced need for salting associated with warmer winters. I could not find figures for salt usage in Halifax, however winters have been warming sufficiently that “Halifax Regional Municipality employees will no longer test ice on lakes and ponds” (CTV News Jan 17, 2024). Reduced salt usage would result in lower chloride values as a function of land use than predicted by Scott et al., 2019. – see Fig 2, below.

Fig 2. Relationship of Chloride and EC to Percent Land Area Developed for Halifax region. Graph adapted from Fig 6 in Scott et al., 2019. Click on image for larger version. The orange-filled rectangle shows where 30% Development (the approx. current level at Sandy Lake*) would fit on the Scott et al., 2019 regression line relating chloride concentrations in the spring of 2013-2017 to the percent watershed developed for 9 Halifax lakes. EC values on the right correspond to the chloride values, based on the relationship given in AECOM (2020).p. 63. The current spring EC value for Sandy Lake is approx 190 uS/cm. The CCME Guideline for long term exposure to chloride is 120 mg/L (the dashed red line). So if Sandy Lake behaves like the other lakes, it would achieve a steady state value just above (orange rectangle) or just below (purple rectangle) 120 mg/L chloride – at the current level of development, higher if further developed.* My estimate based on measurements shown under Land Use. The purple-filled rectangle represents 21% Developed, the approximate (interpolated) value cited by Casey 2022, Fig 2.2 for Sandy Lake in 2020.
It’s a virtual certainty that if a new development proceeds southwest of Sandy Lake as envisioned (re: HRM Future Service Communities ), salt levels in the lake will begin rising again. Given the vagaries of precipitation, climate warming etc. it’s difficult to estimate by how much and whether it would reach levels that exceed guidelines for the protection of aquatic life (120 mg/L chloride or approx 474 uS/cm) or to impede normal lake turnover*
*Typically when the deeper waters reach over 200 mg/L chloride or approx 1000 uS/cm ( Novotny 2008) but impedance of spring turnover in Mirror Lake (NY) occurred at chloride levels below 120 mg/L chloride or approx 474 uS/cm – see Mirror Lake – Sandy Lake comparison.
However both outcomes are possibilities, especially given that the envisaged development would be in area of concentration of headwaters and associated wetlands for Sandy Lake.
Related
Road salt lowers the risk of deadly collisions—but it’s also killing Halifax’s lakes. What’s the answer?
Martin Bauman in The Coast, Apr 5, 2024. Some extracts:
Scott’s 2019 paper, published in the Journal of Environmental Management, stands alone for its longitudinal work. Among its more salient findings are that urban development is the “most significant explanatory variable” for chloride levels, and—more troublingly—that chloride lasts in Halifax’s lakes long after the region’s roads have been salted and washed away by the rain. If a lake is like a Jenga tower, then chloride might best be described as turmeric in a kitchen, or dog hair on a couch: Once it’s there, it’s not going away anytime soon.
Perhaps surprisingly, some of the longest-lasting effects can be found in watersheds when salt doesn’t wash right into a lake. When salt runoff makes its way from Halifax’s roads into forests or grasslands before ending up in the groundwater, Jamieson says, it’s possible to see higher chloride levels “for months, and sometimes even years, depending on how long it takes for that salt to travel through those hydrologic pathways.”
Councillors Sam Austin and Shawn Cleary are both well acquainted with the delicate health of Halifax’s urban lakes. As councillors for Dartmouth Centre and Halifax West Armdale, respectively, the two live in—and represent—two of the most lake-rich areas in Halifax’s urban core. (Those same districts also include some of the lakes most under threat from too much salt.) And while neither would claim to be a biologist—“as a councillor, you find yourself being a generalist in everything and an expert on nothing,” Austin tells The Coast—both have found themselves caught up in Halifax’s internal tug-of-war over how to protect the region’s urban lakes. In Cleary’s district, community efforts to protect Williams Lake led to the creation of the Shaw Wilderness Park—even if it made the Shaw Group millions in the process—and in Dartmouth’s Oathill Lake neigbourhood, Austin has played troubleshooter for keeping road salt levels low while maintaining a salted walking path on Lorne Avenue, which has no sidewalk of its own.
“Where we have lakes that are still vibrant, we want to keep them as vibrant as possible for as long as possible,” Cleary says, speaking by phone with The Coast.
