
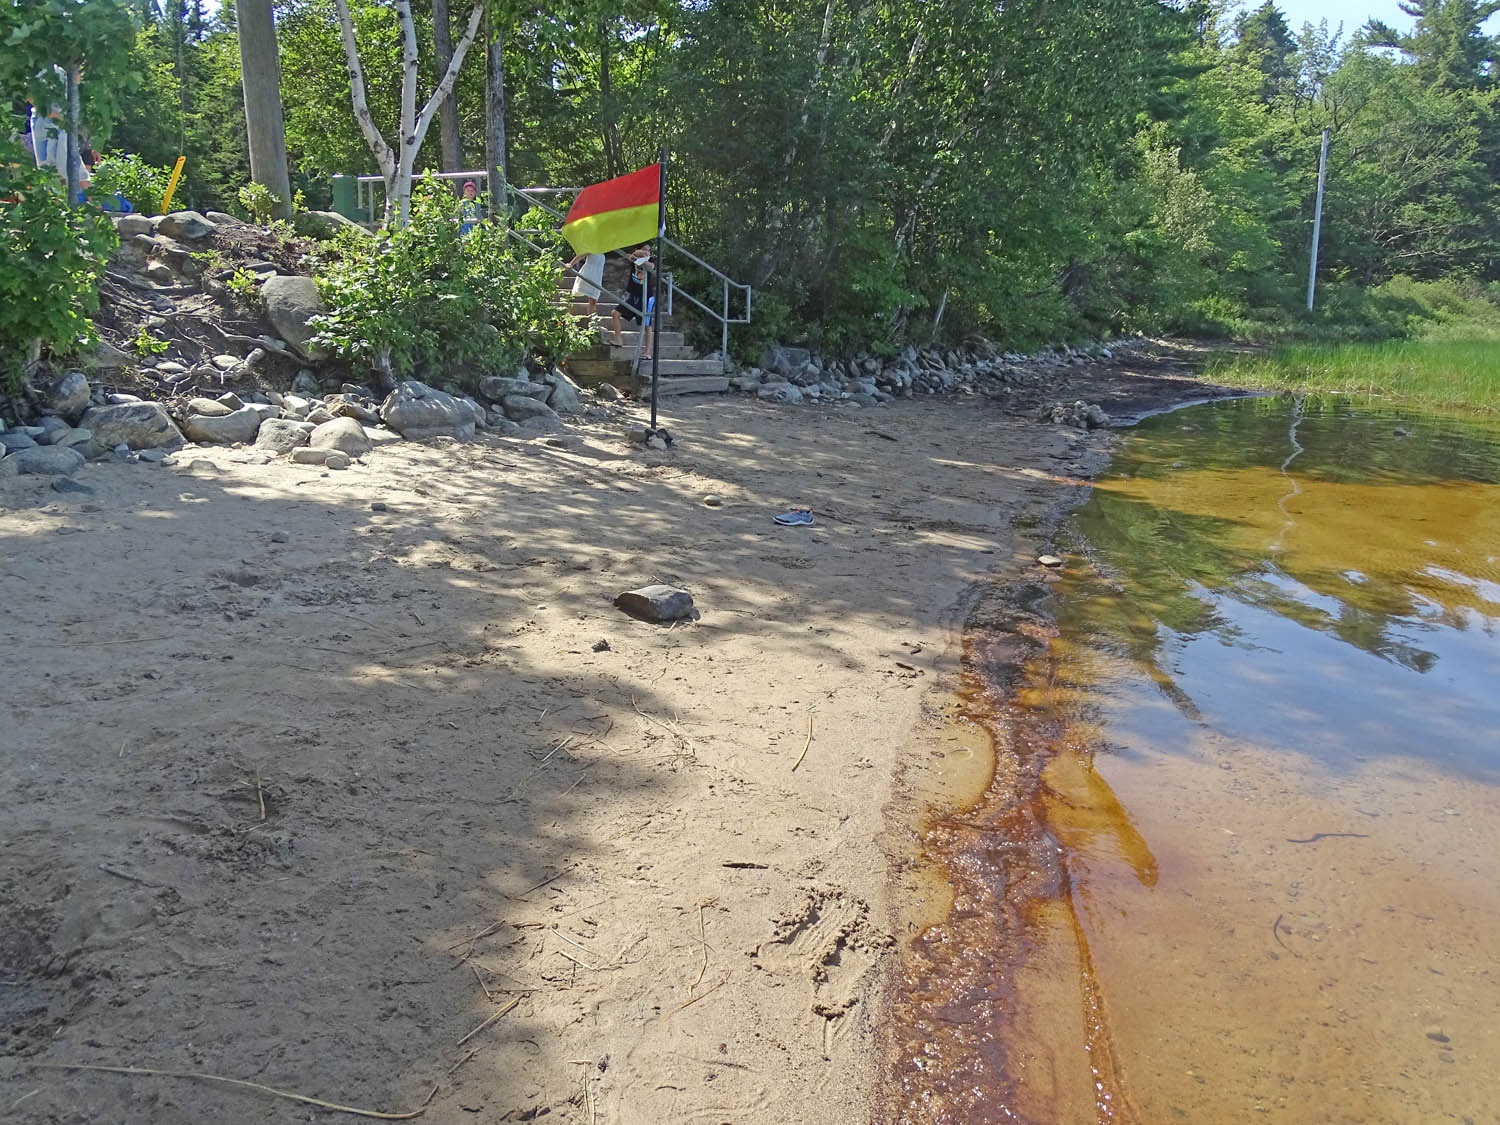
Swimmers left the beach after an unpleasant algal bloom appeared suddenly in the morning of Aug 6, 2019. The lifeguards’ flag above was later replaced with a “no-swimming” flag. The bloom dissipated after a few days. The bloom was an early warning sign that the lake is in a precarious state.
A DRAFT Report on the State of Sandy Lake, the Historical Trends and its Future Trajectory
David G. Patriquin
Prof of Biology, Dalhousie University (retired)
February 23, 2021. View Full Report
BACKGROUND & HIGHLIGHTS
Background
Since June of 2017, I have been conducting observations on the plant communities of the surface waters and forests in the area of Sandy Lake (Bedford, NS) as a volunteer for the Sandy Lake Conservation Association. The results and related literature, links etc. are compiled on a website titled “Forests and Surface Waters of Sandy Lake & Environs (Bedford, Nova Scotia), A Natural History Perspective” (http://versicolor.ca/sandylakebedford)
The observations to date have included limnological profiles on Sandy Lake conducted on Oct 2, 2017 and Sep 29, 2019, and many measurements of electrical conductivity (salt), temperature and pH of lake water and associated streams. Derek Sarty, Bruce Sarty, and Ed Glover have assisted in collecting these observations.
In this report, those observations are integrated with information available from earlier observations and reviews and related scientific literature to provide an assessment of the current state of the lake and its future trajectory. As such, it is essentially a follow-up to the comprehensive review on the state of the lake conducted for HRM by AECOM (2014), and a re-evaluation of AECOM’s projected impacts of new development on the state of the lake in the light of new information. (Except for a few water samples, AECOM (2014) was entirely a desktop study.)
I am seeking critical comment on the Draft and will revise it for a Final Report. The Draft Report is posted at http://versicolor.ca/sandylakebedford/waters/lakes/; it is also available there as a PDF for printing.
Highlights
Sandy Lake, located in Bedford, Nova Scotia is 78.5 ha in area, 21.7 m maximum depth. The watershed (24.2 square kilometers) was entirely forested in 1967, 21 % developed in 1986 and currently is about 30% developed. Some new development to accommodate about 2400 people has been approved but has not yet taken place; more intensive development has been proposed which would add as many as 15,000 people and bring the developed area up to circa 45% of the watershed. The lakeshore itself is only lightly settled, on the west and south sides of the lake.
Sandy Lake was oligotrophic in 1971 and made a transition to mesotrophic circa 2001; in 2012 Total P was circa 12 ug/L. While the lake appears to have acidified significantly for a period in response to acid rain, it supported Atlantic salmon historically, and the current pH is circa 6 to 6.5. Atlantic salmon have been sighted in the lake recently, also American eel, speckled trout and gaspereau; all are desirable species facing significant challenges today. The Sackville Rivers Association constructed and maintains digger logs on Peverill’s Brook to facilitate movement of these migratory fish to and from Sandy Lake. Invasive smallmouth bass have been present for some time and are the species now most commonly caught by anglers. The wetlands fringing the lake support large populations of frogs; snapping turtle (endangered) are also common. Beavers, otters and loons feed and reproduce on or close to the lake. The Lions Club Sandy Lake Beach Park is especially popular with families because of the clean water, sandy beach and gentle slope into deeper water. HRM offers swimming lessons at the park in the summertime.
AECOM (2014) used the Lakeshore Capacity Model (Dillon and Rigler 1975) as elaborated by Brylinski (2004) and MOE (2011) to predict the effects of the proposed development on lake Total P, a predictor of lake water and fish habitat quality. They set the WQO (Water Quality Objective) at 18 ug/L which was 50% above the current –circa 2012 – value (12 ug/L), but still in the mesotrophic range. Based on their modelling, they concluded “Cumulative impacts of development on phosphorus concentrations are predicted to increase to 16 µg/L for Sandy Lake when mitigations measures to decrease phosphorus loading are not implemented… Removing point sources of phosphorus such as the Uplands WWTF and septic systems near Sandy Lake by connecting them to municipal wastewater services decreases the predicted phosphorus concentrations to 15 µg/L… Additional phosphorus mitigation measure using advanced stormwater management that reduces phosphorus runoff by 50% is predicted to further decrease the phosphorus concentration of Sandy Lake to 13 µg/L”.
AECOM (2014) also noted that “the degree of influence of urbanization on water quality in Sandy Lake can only be approximated using the phosphorus load model because of limitations arising from assumptions and uncertainty in the application of the model”. They proposed “a robust water quality monitoring plan…to provide a further assessment of current conditions and to evaluate the impacts of development on the water quality.” A formal monitoring program has not yet been implemented but Sandy Lake was identified as a Priority Lake for future monitoring in a recent AECOM report on lake monitoring for HRM (AECOM, 2020).
The quasi-formal observations we conducted and some of the historic observations cited by AECOM (2014) indicate that the lake is currently in a precarious state.
Deep water oxygen in 2017 and 2019 was 2.25 and 2.29 mg/L mg/L compared to 5 mg/L in 1971 and 3 mg/L in 1998. AECOM (2014) cites provincial data showing that on 2 of 3 sampling dates in the summers of 2008 to 2011, deep water Total P was highly elevated compared to surface water Total P, an indication that the deep waters were hypoxic. That condition accelerates eutrophication and decline of water quality and habitat for salmonids.
An intense but transient algal bloom in 2019 is another early warning sign. It occurred in early August and coincided with an abrupt lowering of the lake level following the legal removal of a beaver dam in the outlet stream (Upper Peverill’s Brook). A plausible explanation (by analogy with effects of rapid lowering of water level in reservoirs): there was high total P in the hypolimnion; disturbance of the thermocline associated with the rapid water movement resulted in a flush of the deep water phosphorus being released into surface waters; the bloom began quickly and once the water movement stopped, dissipated quickly. Transient disturbance of stratification in the summer period by wind was recognized as a potential issue at Mirror Lake, NY when spring turnover is impaired in some years by winter salt loading (Wiltse et a;., 2020). An extreme summer wind event could likewise be a threat at Sandy Lake.
Rising levels of salt in Sandy Lake, documented in this report, are highly concerning.
The CCME (2011) guideline for chloride ion for the protection of aquatic life is 120 mg/L for long term exposure, and 640 mg/l for short term exposure, corresponding approximately to EC (Electrical Conductivity) values of 470 and 2410 uS/cm respectively, using the conversion formula given in AECOM (2020). Current lake EC values, mostly in the range 150 to 250 uS/cm are still well below the long term exposure guideline, but values in streams frequently exceed that value.
The 2017 and 2019 limnological profiles revealed elevated EC (salt) levels in the hypolimnion compared to the epilimnion. Extensive sampling of surface waters illustrated that the salt is coming from settled areas in the upper reaches of streams feeding Sandy Lake. Rough mass balance calculations suggest that about three-quarters of the water entering Sandy Lake is influenced by salt inputs from settled areas. Seasonally, stream EC values over 2019 and 2020 peaked in March and then again in July (2019) or October (2020); the latter peaks are suggestive of a groundwater salt signal.
At some point such stratification could interfere with normal lake turnover, initially the spring turnover. It’s quite possible that is already happening based on similarities of the Sandy Lake morphometry and early fall limnological profiles to those of Mirror Lake NY (Wiltse et al., 2020). Although Mirror Lake is oligotrophic (by Total P criteria), in recent years it has experienced low oxygen in the hypolimnion following high salt loading in winter and failure to the lake to turn over in spring due to salt stratification. The early fall salt profiles in Sandy Lake are similar to those for Mirror Lake (we don’t have spring profiles). The deep water winter values that impaired spring turnover at Mirror Lake, circa 115 mg/L chloride versus 34 mg/L at the surface, indicate that spring turnover can be impaired by salt levels less than the CCME Guideline for long term exposure (120 mg/L) which is also the WQO for chloride cited by AECOM (2014) for Sandy Lake.
The salt signal we are viewing for Sandy Lake is also an ‘urban influence signal’ and increased loading of organics and nutrients from urbanized areas might contribute to or otherwise account for reduced hypolimnion oxygen levels.
Salt levels are increasing in Sandy Lake and if continued would very likely impair or further impair spring turnover and worsen the already precarious condition of the lake. While Best Management Practices can reduce salt loading, the overriding cause of increased salt-loading in the snow and ice latitudes is increased area of settlement/hard surface in a watershed; such settlement area effects can be only partially reduced by BMPs.
Sandy Lake represents an enviable situation where we still have the option of choosing the most effective way to prevent the predictable and largely inevitable deterioration of a treasured lake associated with increasing urbanization: to strongly limit as yet unapproved development in the watershed, especially close to the lake itself and to streams draining into the lake.
Even without further development, it is important to reduce existing inputs of sediment, organics, nutrients and salt as much as possible to counteract the increasing stresses associated with climate warming (e.g., longer periods of summer-fall stratification, reduced oxygen solubility and more favorable temperatures for algal blooms). Thus to maintain Sandy Lake as an invaluable community recreational area and as habitat for iconic species such as salmon and loons, the WQO for Sandy Lake should be to “walk the lake backwards” as much as possible to an earlier, more pristine, oligotrophic state.
Literature Cited
AECOM, 2014. Sandy Lake Watershed Study Final Report. Prepared for HRM by AECOM Canada Ltd
AECOM, 2020. Halifax Regional Municipality Water Quality Monitoring Policy and Program Development. Prepared for HRM by AECOM Canada Ltd
Brylinsky, M., 2004. User’s Manual for Prediction of Phosphorus Concentration In Nova Scotia Lakes: A Tool for Decision Making Version 1.0
Prepared For The Nova Scotia Water Quality Objectives and Model Development Steering Committee Nova Scotia Department of Environment and Labour.
CCME, 2011. Canadian water quality guidelines for the protection of aquatic life: Chloride. In: Canadian environmental quality guidelines, 1999, Canadian Council of Ministers of the Environment, Winnipeg.
Dillon, P.J. and and Rigler, F.H., 1975. A Simple Method for Predicting the Capacity of a Lake for Development Based on Lake Trophic Status. Journal of the Fisheries Research Board of Canada 32(9):1519-1531
MOE, 2010. Lakeshore Capacity Assessment Handbook – Protecting water quality in inland lakes on Ontario’s Precambrian Shield. Ontario Ministry of the Environment.
Wiltse, B. et al., 2020. A reduction in spring mixing due to road salt runoff entering Mirror Lake (Lake Placid, NY). Lake and Reservoir Management 36:109–121
View Full Report