
Page Updated Sep 8, 2024.
NAVIGATION
www.versicolor.ca
![]() /sandylakebedford Home Page for Sandy Lake & Environs (Bedford, NS)
/sandylakebedford Home Page for Sandy Lake & Environs (Bedford, NS)
![]() /Surface Waters
/Surface Waters
![]() /Sandy Lake A Draft report On the State of Sandy Lake…Feb 21, 2021
/Sandy Lake A Draft report On the State of Sandy Lake…Feb 21, 2021
![]() /Limnological Profiles (This Page)
/Limnological Profiles (This Page)
Subpages:
– 2023 Limnological Profiles, effects of episodic precipitation and occurrence of a Metalimnetic Oxygen Minimum
– 2024 Limnological Profiles – return to historic trends
– –Addendum 1: Trends in Conductivity/Salt Content
– – Addendum 2: On Wetlands
On this page:
| BACKGROUND THE PROFILES 1. Oct 3, 2017 2. Sep 30, 2019 3. Apr 19, 2021 4. Aug 16-23 period, 2021 Casey Doucet 5. May 7, 2022 6. Aug 22, 2022 6B. Comparison of May 7 and Aug 22, 2022 profiles 6C. Total P, chloride and Total P values on May 7 and Aug 22, 2022 |
7. April 21, 2023 7B. Notes* 8. Aug 14, 2023 8B. Comparison of Apr 21 and Aug 14, 2023 profiles 8C. Comparison of mid-August profiles 2022 and 2023 9. Apr 15. 2024 10. Aug 12, 2024 11. Apr 11, 2025 LIT/LINKS CITED *Lake Watchers, Weight added to detect the bottom, Comparison Aquapro with YSI values |
BACKGROUND
For some background info on lake stratification, see this page.
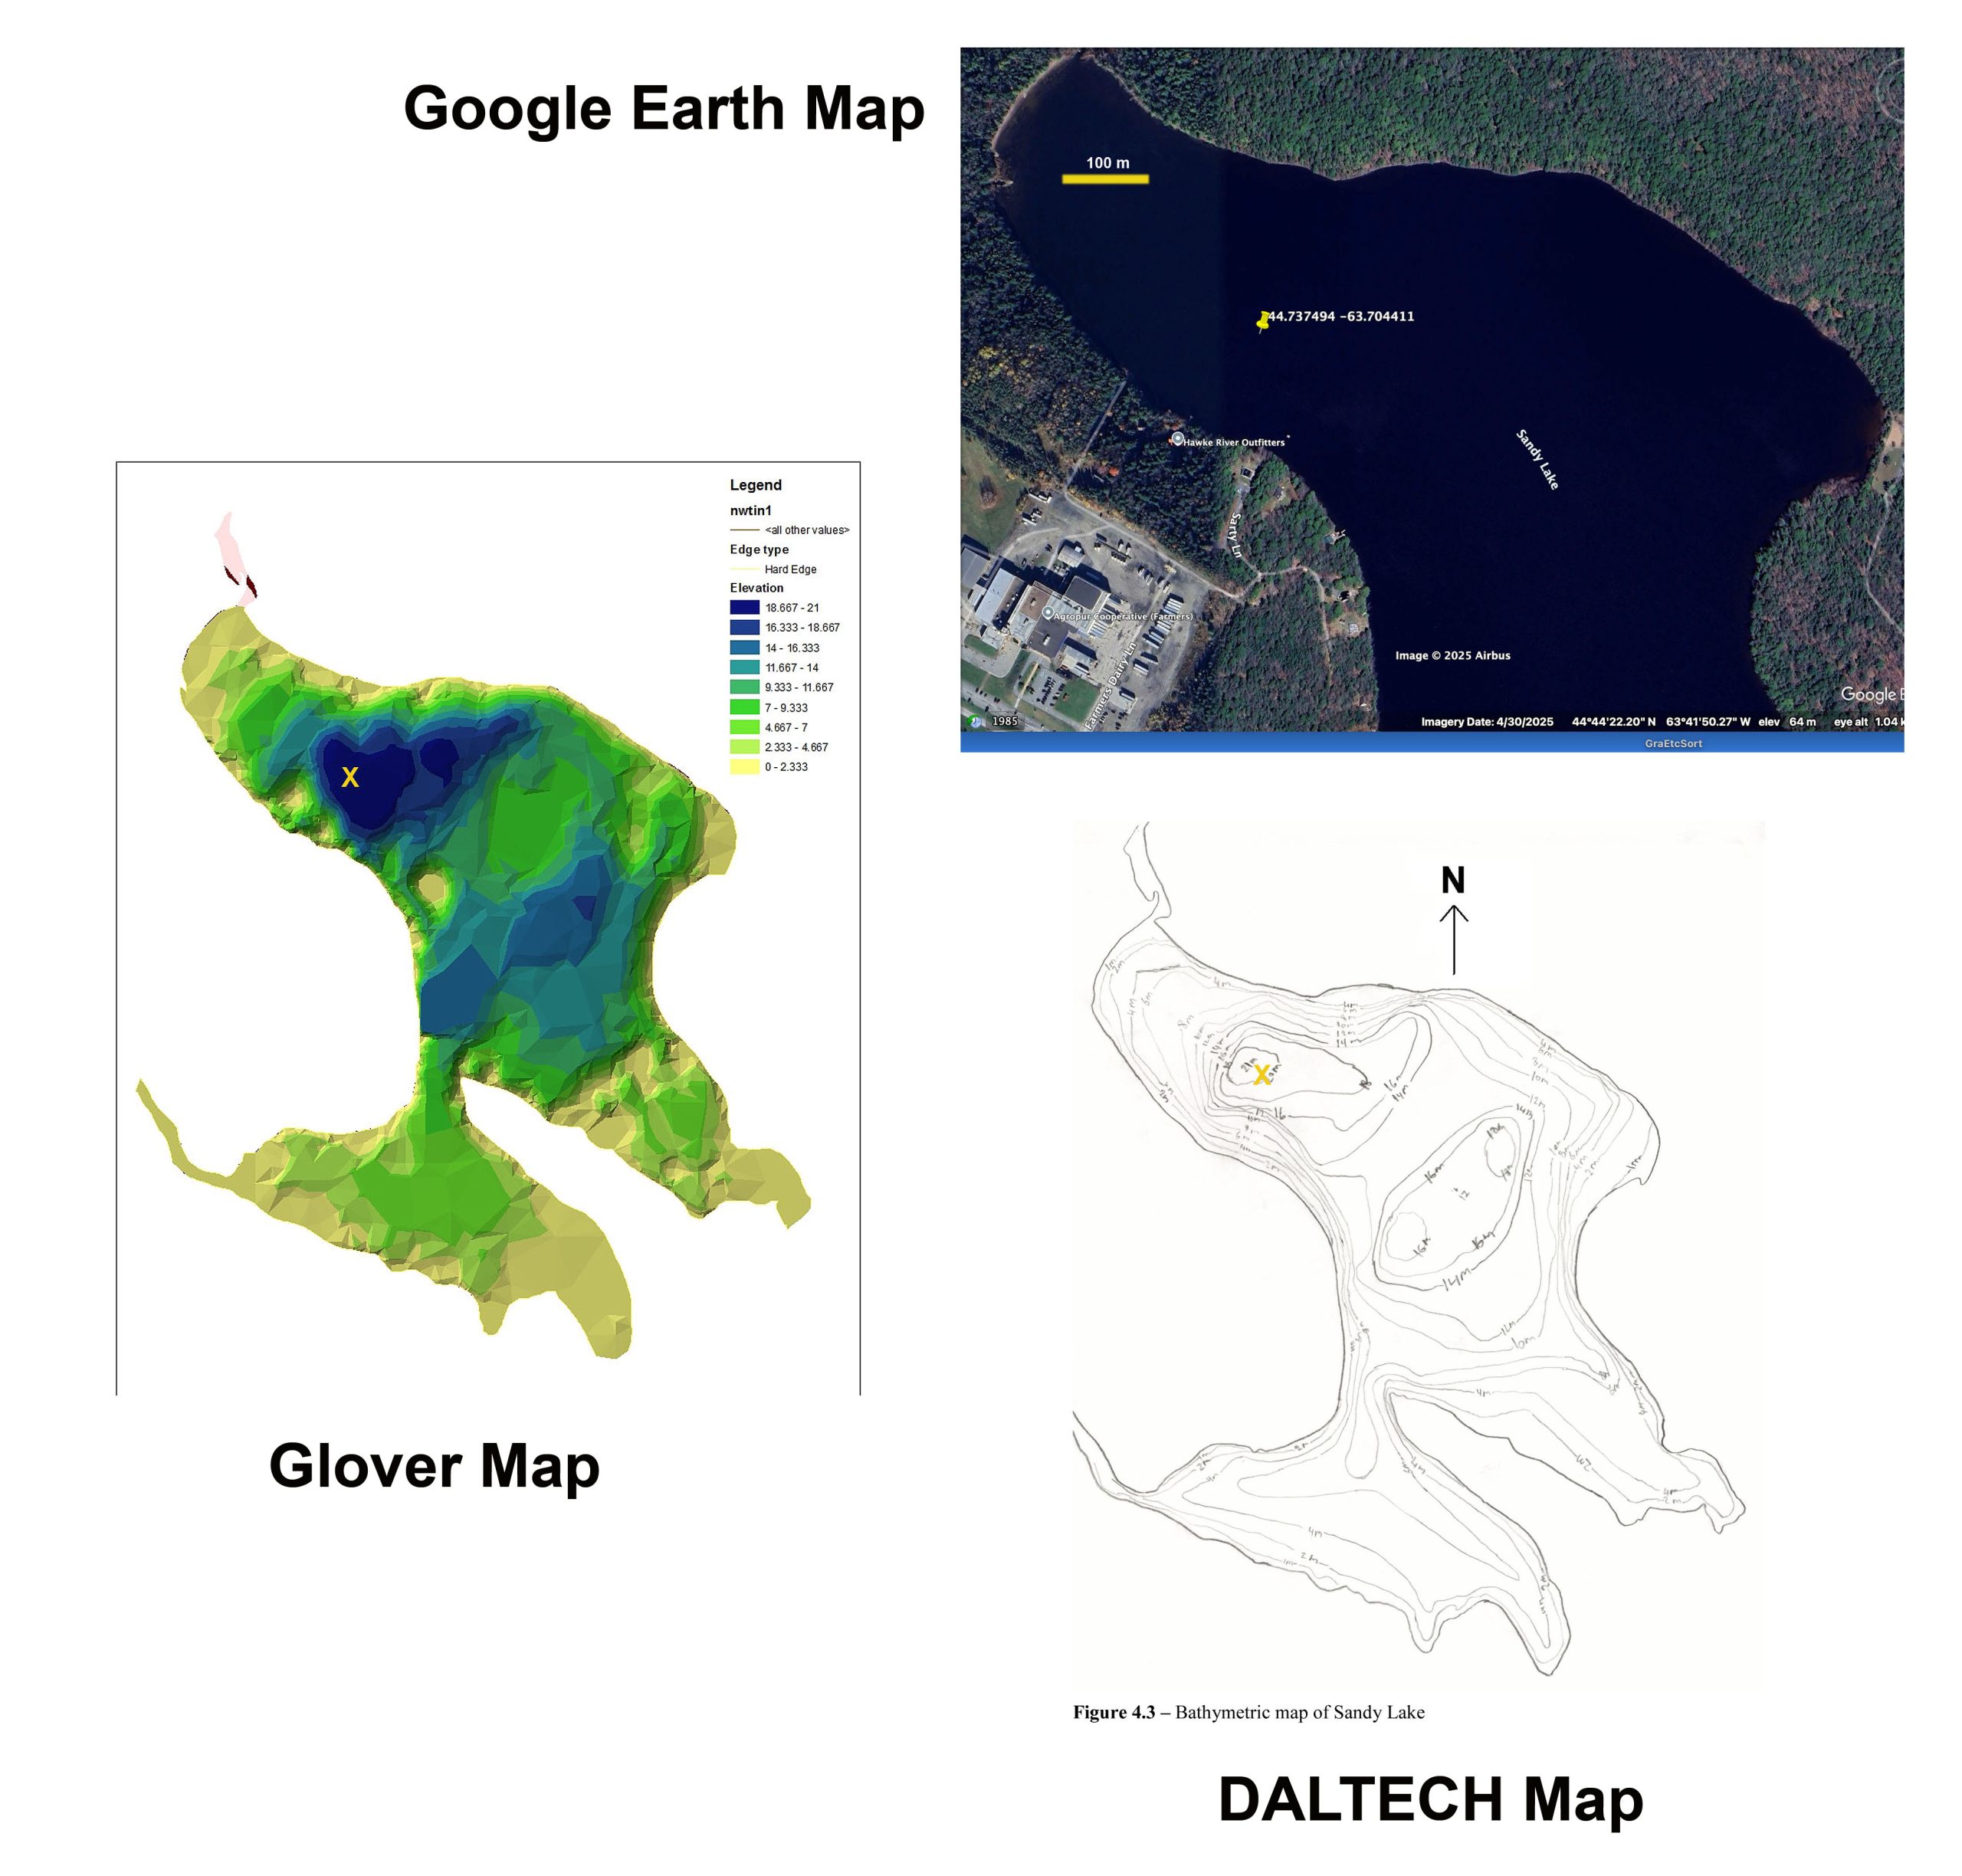
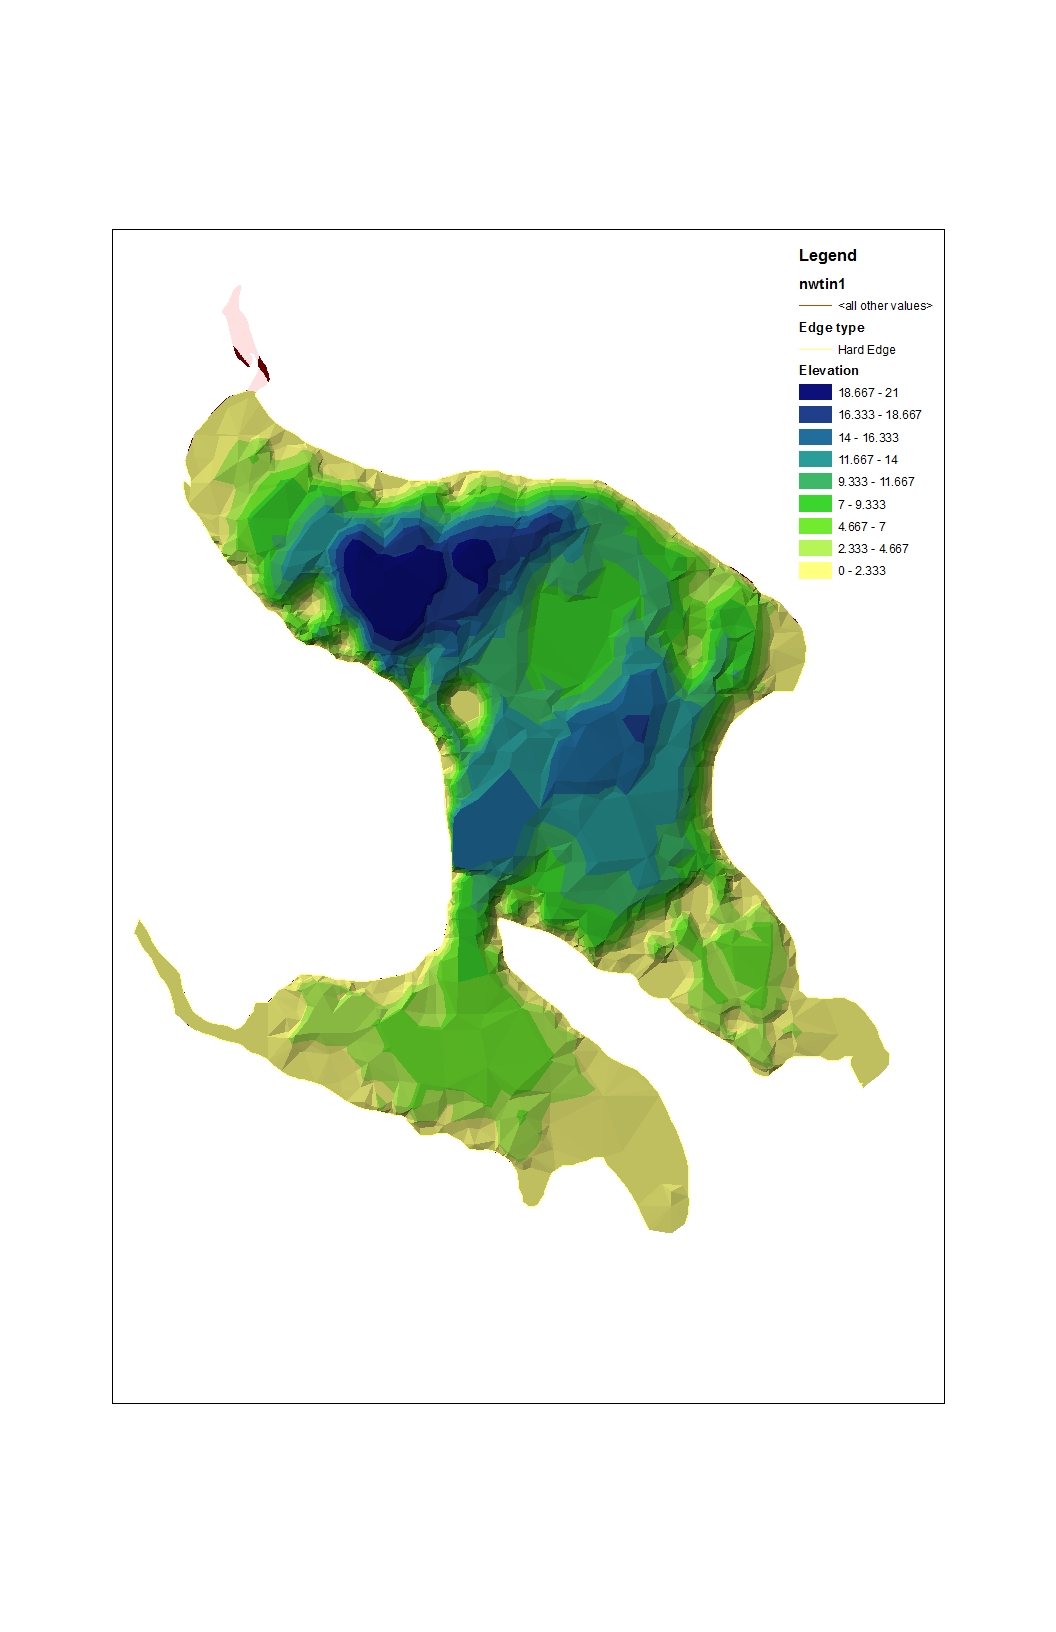
Location of Deep Sampling site Apr 21, 2023 shown on Google Earth Map (top), Ed Glover Bathymetric Map (bottom left) and DALTEC Bathymetric Map (bottom right)
Click on image for larger version
Vertical profiles of temperature, oxygen, electrical conductivity were obtained at 3 locations on Oct 3, 2017 including a deep point in the lake (17.5 m), and only at or close to the deepest spot (19-21 m) in the lake on Sep 30, 2019, Apr 19, 2021, May 7, 2022, Aug 22, 2022, Apr 21, 2023, Aug 12, 2024 and Apr 11, 2025. (Movement in the wind made it difficult to locate and/or stay on precisely the same location each time.)
A completely independently observed profile was obtained by Casey Doucet in August 2021 in connection with her Master of Applied Science thesis research at Dalhousie University; the thesis is available at DalSpace As noted on this page and elsewhere, the general concurrence of Casey’s observations conducted with professional support and that include what otherwise might be regarded as ‘odd aberrations’ in the profiles concur with our observations in 2022, 2023 and 2024 (re: a Metalimnetic Oxygen Minimum”); thus they add credibility to our observations*, conducted by volunteers borrowing equipment (2017 to Apr 2022) up until our support under the Halifax LakeWatchers program beginning in the summer of 2022.
*There is some evidence that “unsupervised” volunteer observations at Sandy Lake tend to get dismissed by consultants preparing reports for HRM/NS Gov, even if university profs were/are involved. Thus in the AECOM 2014 Report, volunteer observations were excluded without explanation; and likewise in the Draft LSA of 2024 (see 2. On Section 3.2.1.3 WATER QUALITY). It might be noted that in both instances, had those data been included, the condition of Sandy Lake would not been as healthy as the consultants portrayed.
Beginning on Aug 22, 2022, observations were conducted with equipment and specific directions provided by HRM under their new lake water quality sampling program. This includes a limnological profile at the deepest point with surface and water samples for chlorophyll and phosphorous; and surface readings and water sample at the outlet, both 2x/year (spring and late summer).
pH values were also observed in most years but are not reported on this page. View Methods.
THE PROFILES
1. Oct 3, 2017
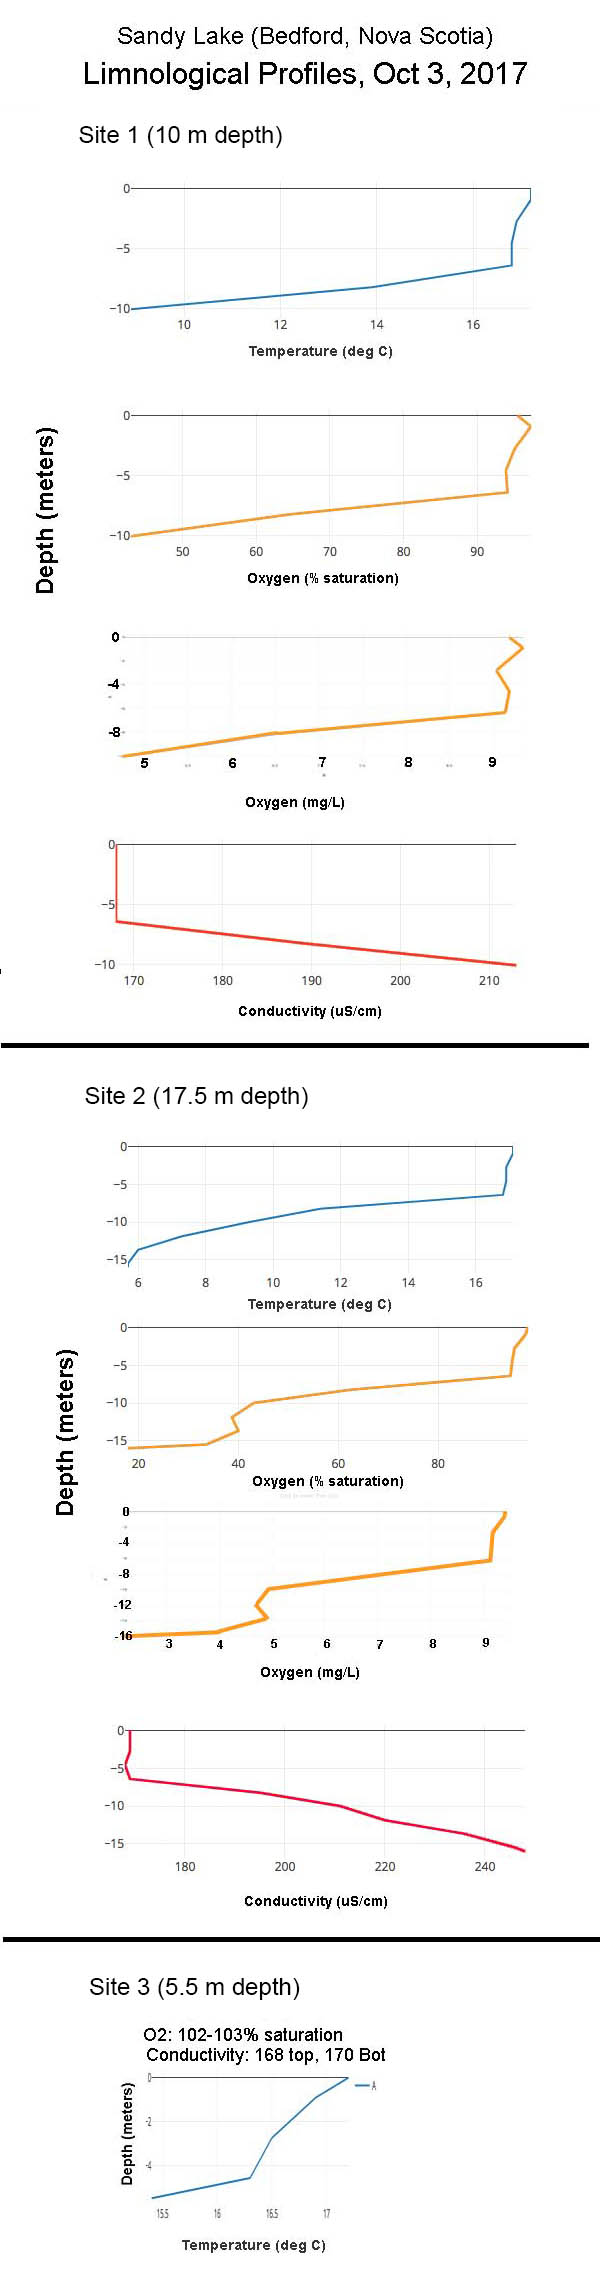
Profiles of temperature, oxygen, and electrical conductivity were obtained for 3 sites in Sandy Lake on Oct 3, 2017, as shown below.
The depths for sites 1, 2 and 3 were 10, 17.5 and 5.5 m. Site 2 was intended to be conducted at the deepest site in the lake, but it was only 17.5 m versus the 20-21 m indicated by the Ed Glover Map. In all subsequent profile observations, Ed Glover participated and we were able to locate the deepest spot more precisely.
Profiles at Sites 1 and 2 were similar with a distinct surface layer in the top 7 m, and then continuous declines in temperature and oxygen, and increases in conductivity to the bottom. It’s likely that in the summer when surface water temperature want up to 25 degrees C or higher, there were distinct surface and deep layers (epilimnion and hypolimnion) with a thermal gradient between them (the metalimnion), and that on Oct 3, that 2 -layer systems was in the process of breaking down.
Two features to note:
(i) There is a distinct gradient in conductivity (a measure of dissolved ions).
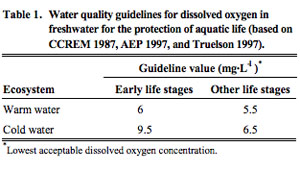
(ii) For the deepest profile (Site 1), the oxygen content of the deeper layers (2.25 mg/L) is below guidelines for both salmonids and more generally, aquatic life. The 2017 value is less than half of the value obtained on Aug 30 1971 when the lake was still in the oligotrophic range (that’s the only comparable historical data for Sandy Lake).
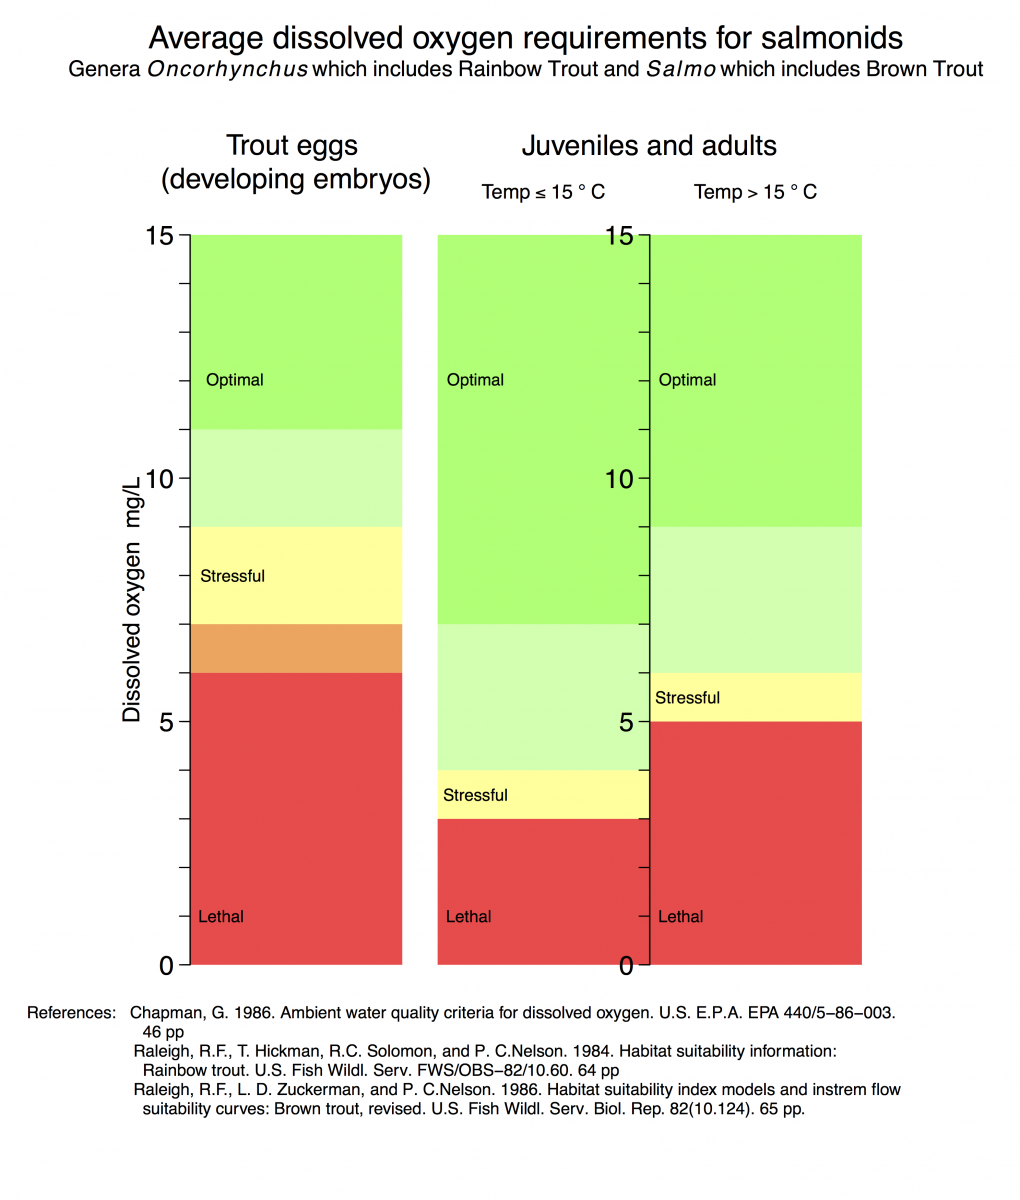 SOURCE: www.henrysfork.org/average-dissolved-oxygen-requirements-salmonids |
 Click on image above for the source document |
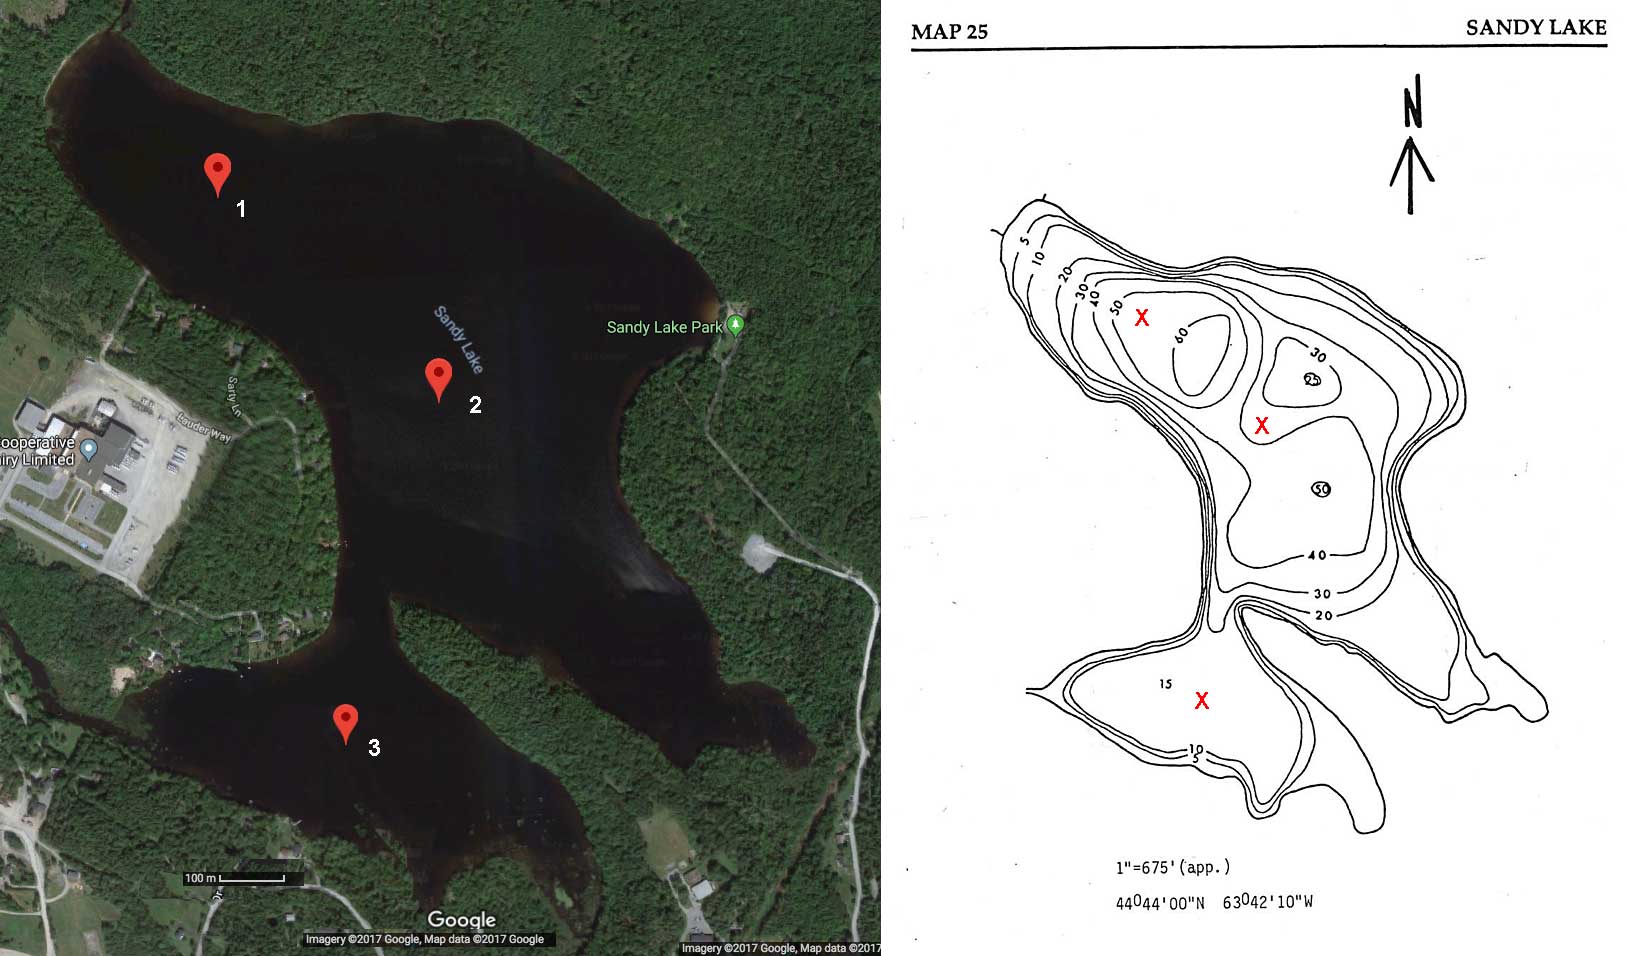
Location of three sites at which limnological profiles were obtained on Sandy Lake in 2017; bathymetric map at right . (Bathymetric map from P. Mandell, 1994. The effects of land use changes on water quality of urban lakes in the Halifax/Dartmouth region. MSc thesis, Dalhousie University. Also view Ed Glover Bathymetric Map
Click on image for larger version
View 2017 profile data
2. Sep 30, 2019
These data posted Dec 13, 2020
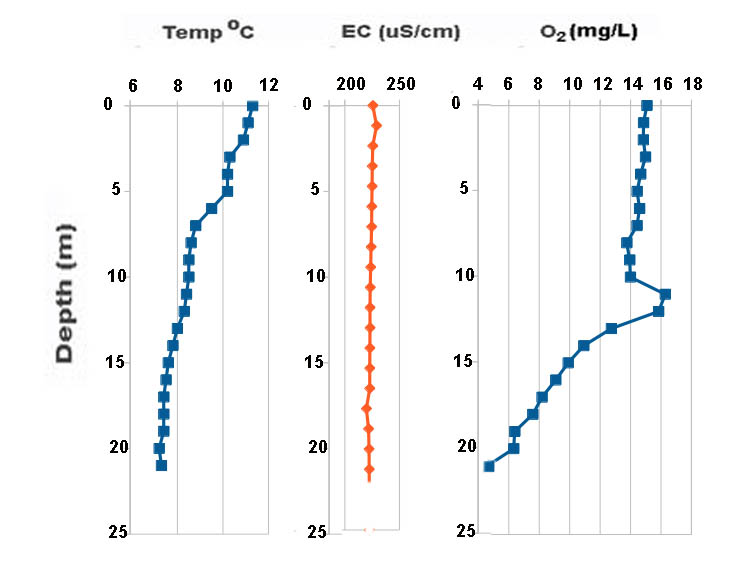
Using the same equipment and procedure, Ed Glover obtained these profiles at the deepest point in the lake on Sep 30, 2019:

View 2019 data file
These observations were at a deeper point than sampled at nearby site 1 in 2017.
Distinct stratification with a hypolimnion, thermocline (metalimnion) and hypolimnion are evident.
The overall patterns are similar to those for site #1 above with low O2 and saltier water in the deepest layer (hypolimnion).
The deepest water in 2019 was warmer (7.3 degrees at 17 meters; 7.2 at 21 m) than in 2017 (5.7 at 17.5 meters degrees, the deepest point) and less salty (195 uS/cm at 21 m in 2019 compared to 246 uS/cm at 17.5 m in 2017). Surface temperatures and EC values were more similar (17.1 degrees/169 uS/cm in 2017; 16.9 degrees, 159 uS/cm in 2019).
It also appears that the profile on Sep 30, 2019 was still in its summer, full stratification mode, while on Oct 3, 2017 it appeared to be breaking up.
Without measurements of chloride in the water, it cannot be said with absolute confidence that the higher EC in the hypolimnion compared to the epilimnion is entirely due to road salts. Mobilization of iron and manganese (and phosphorus) under anoxia is another possibility, however, the hypolimnion oxygen values on these two profiles, while low for salmonids, were still above 2 mg/L, the value generally cited for “hypoxic” water (e.g., from Nurnberg 2004: “2 mg L–1 measured by a DO probe about 1 m above the sediment usually coincides with anoxic conditions at the sediment surfaces located at that depth”. Such mobilization results in EC increases up to 30-40 uS/cm (e.g., Mortimer, 1942; OME 1993); the difference top to bottom in 2017 was about 80 uS/cm, in 2019 about 40 uS/cm.
Some pertinent chemical data are available for 1998:
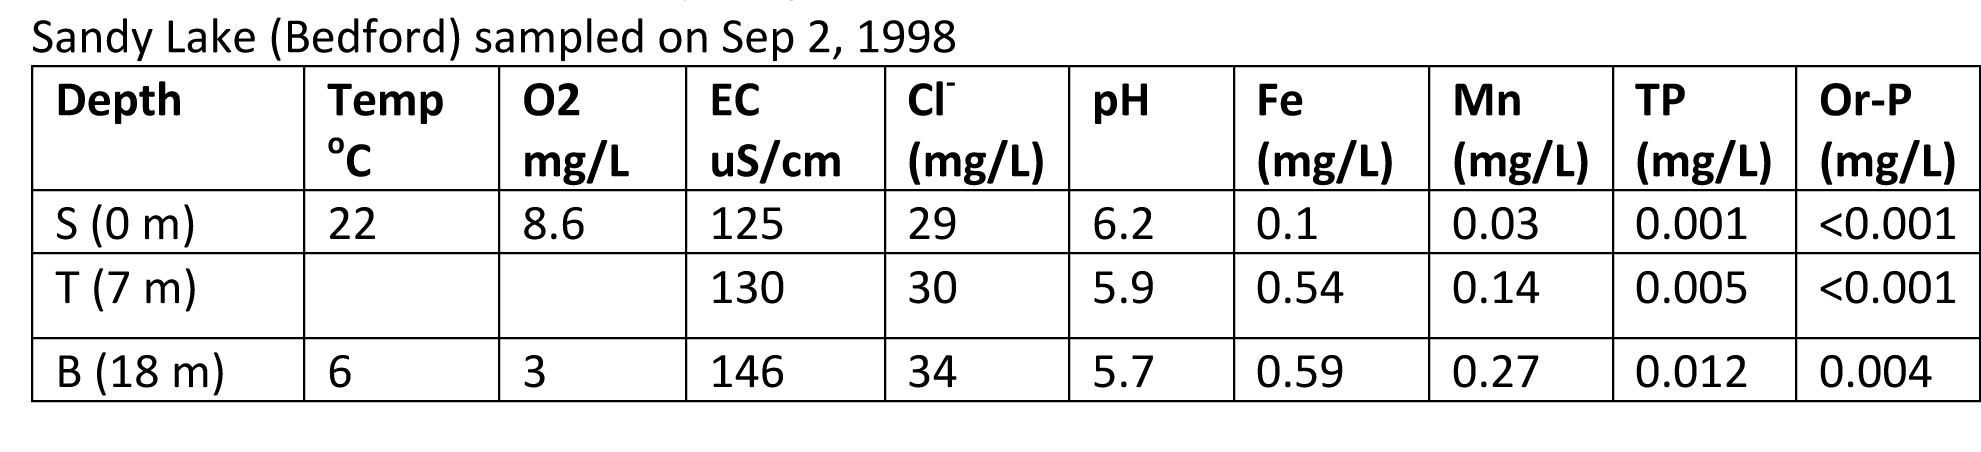
From Nova Scotia Lake Inventory Program. Files: Word doc | Excel
Samples taken at the surface, in the thermocline at 7 m depth, and at the bottom (18 m) on Sep 2, 1998 illustrate differences in EC and chloride, with equivalent differences between the surface and bottom for both EC and chloride: 34/29*125=146.6, i.e. changes in chloride appear to account for the differences in Electrical Conductivity. At the same time, there is some evidence for some mobilization of iron, manganese and phosphorous in the hypolimnion at an oxygen concentration of 3 mg/Lin early September.

Profiles for Apr 19, 2021
3. Apr 19, 2021
(David P and Ed G.) The profiles for temperature, oxygen and EC indicate that a normal spring turnover had occurred and the water column was well and uniformly oxygenated down to 19 m. A thermocline had been formed at 13-17 m (temperature 7 degrees dropping to 5 degrees). It was difficult to tell precisely when the probe was at the bottom. Separately, we lowered a bucket with rocks down; the bottom was at approx. 20 m – so the deepest probe sample (21 m) was likely within soft sediment. There was a sharp increase in EC between 20 m ( 172 uS/cm – compared to values of 169-171 uS/cm for 0 to 19 m ) and 21 m (193 uS/cm); oxygen declined from 86.3 to 78.5 mg/L (compared to values of 96 to 89 mg/L, surface to 19 m depth). View Profile19Apr2021.xlsx

Profiles for Temperature, Dissolved Oxygen and Total P shown in Doucet (2022), with permission.
4. Casey Doucet Profile during Aug 16-23 period, 2021
– see Identifying lake water quality trends and effective monitoring strategies in a rapidly urbanizing region by Casey Doucet. Master of Applied Science thesis 2022-12-08, Dalhousie University; and Fig B1 supplement. The Fig for Sandy Lake in the supplement shows Temperature, Dissolved Oxygem (mg/L) and Total P(ug/L) down to approx 19 m. The oxygen profiles exhibits a curious decline in the area of the thermocline with a min value circa 3 mg/l at approx. 6 m; it then increases to close to 5 mg/L at about 8 m, and then declines gradually until 15 m and then sharply between 15 and 19 m reaching a minimum of approx. 0.4 mg/L in the deepest sample at approx. 19 m. (We observed A similar decline of oxygen in the thermocline area in out August 2022 sampling shown below). The Total P sampled at 5 points only (approx. 0, 3, 7, 10 and 18 m is close to 10 ug/L for 0 to 10 m and increases from approx 10 ug/L at 10 m to approx. 22 ug/L at 18 m, suggesting some mobilization of P stimulated by anoxia in the bottom sediments,
Profiles for May 7, 2022
5. May 7, 2022
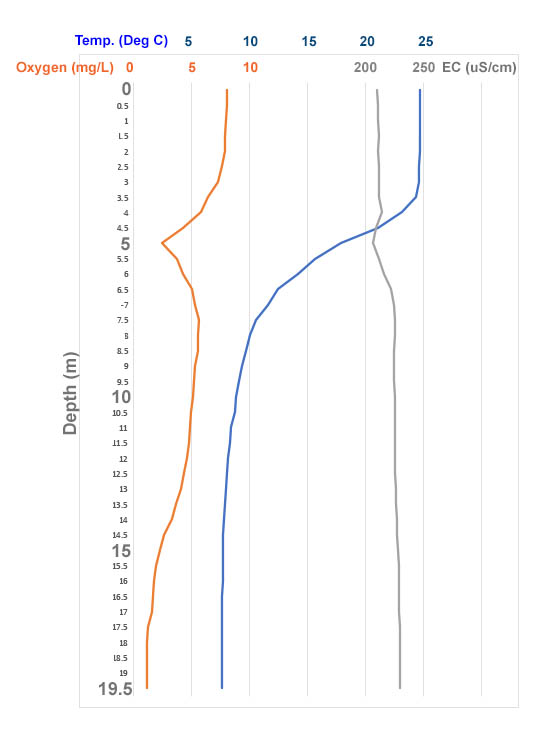
Ed G. & Derek S). The profiles for temperature, oxygen and EC indicate that a normal spring turnover had occurred. On May 7, a thermocline is developing at 5-7 m. EC values are close to uniform top (222 uS.cm) to bottom (224 uS/cm). Oxygen shows a sharp decline 12-21 m; however these values are a bit uncertain as the meter gave quite different values going down versus coming up. View file: SL_Data. The EC values are well above the values for Apr 19, 2021, likely reflecting higher salt loading over the winter in 2022 compared to 2021.
6. Aug 22, 2022
(Ed G, Derek S. David P. Secchi Disk: 2.5 m
These observations were conducted with equipment and specific directions provided by HRM under their new lake water quality sampling program. There were some oddities issues with the oxygen values – note curious dip in oxygen in the thermocline – however, the observations are consistent between the 2 sets of measurements in showing very low oxygen at the deepest point/not in the sediment (1.36 and 1.09 mg/L).
Profiles for Aug 22, 2022
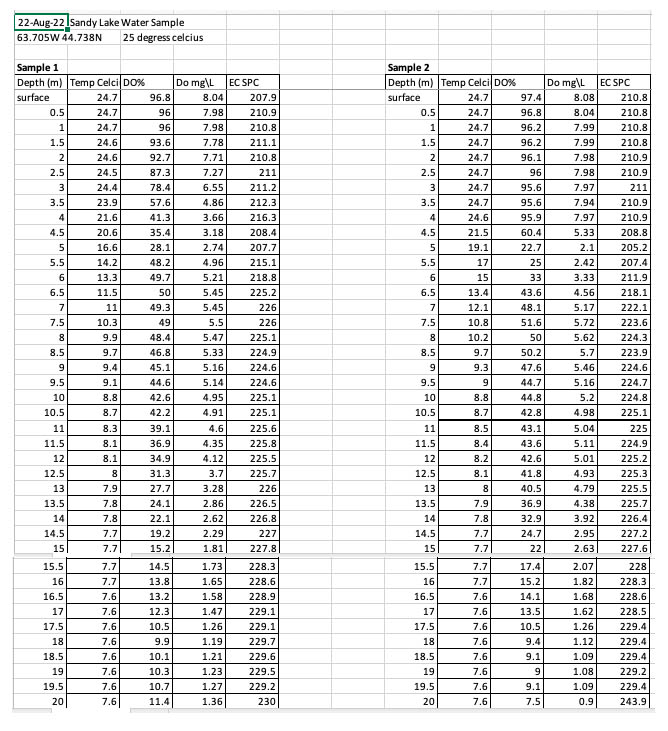
Image of Excel File. Click on image for larger version
| Comments by David P in Letter to HRM Hi Emma, |
A few notes:
It was a windy day, and we anticipated issues with the boat moving, detecting the bottom etc.
We attached the probe to a rope with bucket with rocks in it so all of the tension was on the rope. (see pic, attached). So you might add 30 cm to the observed depth values.
Ed navigated to the spot you gave as the location; we did it twice (with some anchoring issues); it was clear the bottom was at 15 meters, so we decided to go to the spot where we had sampled before when Ed was with us – (Sep 30, 2019, Apr 19, 2021, May 7, 2022), bottom at 21 m – http://versicolor.ca/sandylakebedford/waters/lakes/limnol-profiles/
In the course of events we lost Bruce’s large Danforth Anchor.. fortunately we were able to get another anchor from Bruce and anchored firmly on the desired second site. Observations are those as the we lowered the probe. In the first set we allowed only 5-10 secs at each level. Because of peculiar oxygen mid-way, we repeated with a second set, this time leaving the probe until the % oxygen had stabilized or was changing very slowly, that was often 1 minute plus
In both sets, we observed an exceptionally low O2 at 5 m, the value was lower in the second set than in the first.
The nearer the surface value s were higher in the second set than in the first, the values 15 m and deeper were more similar.
So I am wondering (i) the O2 probe/membrane might need to be replaced; (ii) regardless it seems there was something peculiar at ~4.5 to 6 meters or so which is also where the temperature started to drop.
For the the very last measurement in the second set, I allowed the rope to sink into the bottom (after the bucket had hit bottom) there is a jump in electrical conductivity which is what I have observed before then you allow the probe to go right onto the bottom (so EC values may provide some indication of where the bottom is when a bucket or other bottom-detecting device is not used; I did not do that with the first set and there is no jump in the final EC value).
Ed I am thinking it would be helpful if you send Emma your lake bathymetry map with both locations shown; please add additional comments as you might think appropriate.
— David P
Thx to Bruce Sarty for anchors!
6B. Comparison of May 7 and Aug 22, 2022 profiles
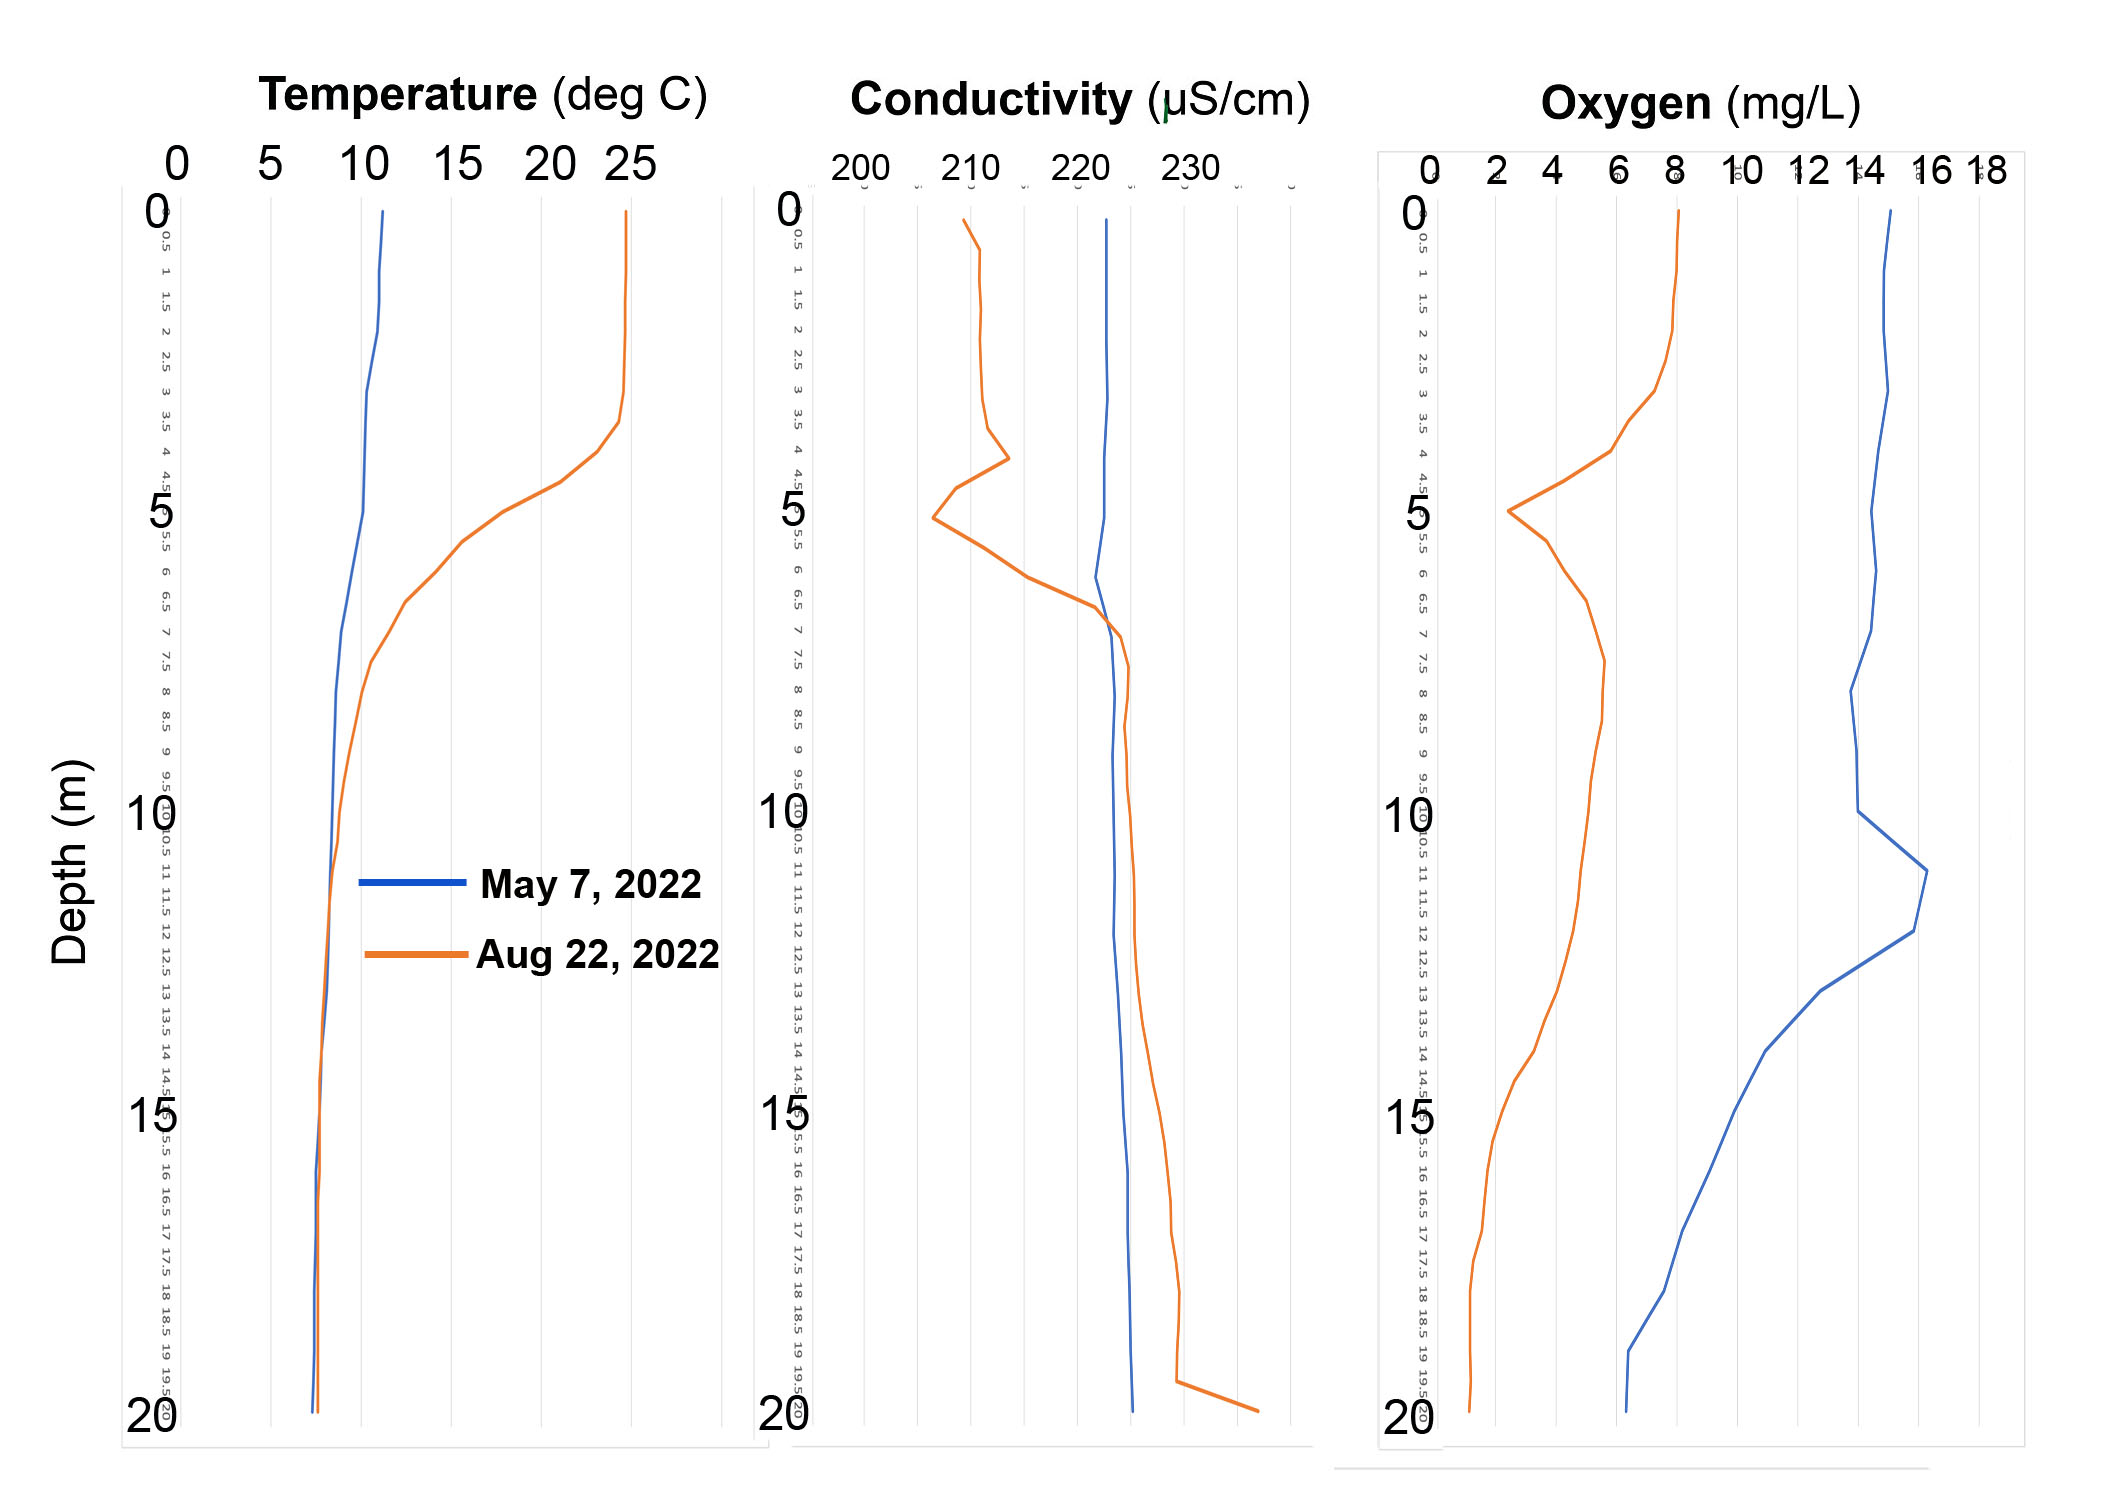
Of particular notice: Drop in EC in surface waters and some increase in EC of deeper waters in Aug compared to May; oxygen minimum at 5 m in Aug,
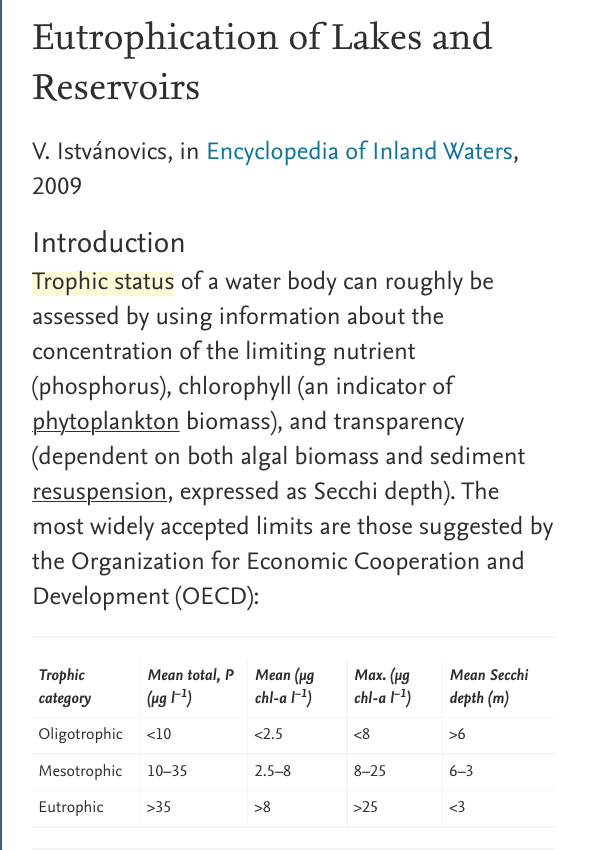
Extract from Encyclopedia of Inland Waters Accessed via ScienceDirect
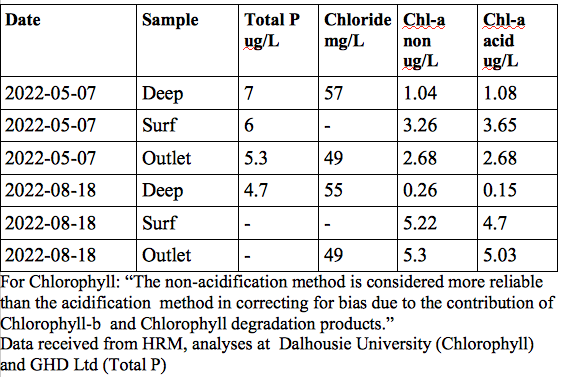
6C. Total P, chloride and Total P values on May 7 and Aug 22, 2022
Our observations of May and Aug 22, 2022 were conducted in collaboration with HRM’s LakeWatcher program; the profile monitoring equipment was provided by HRM.
In addition, HRM provided a Van Dorn bottle for taking water samples and the top and bottom at the deepest site and at the outlet.
The water samples were analyzed for Total P, and Chlrophyll-a, whihc are measures of the tropic status of a lake (see fig at right).
The deep-water P values compared to surface values in the late summer provide some indication whether “internal P-loading” is occurring – as documented by C. Doucet in her Aug 2021 sampling of Sandy Lake cited above. Deep water P was not elevated according to these data, in 2022:
7. April 21, 2023
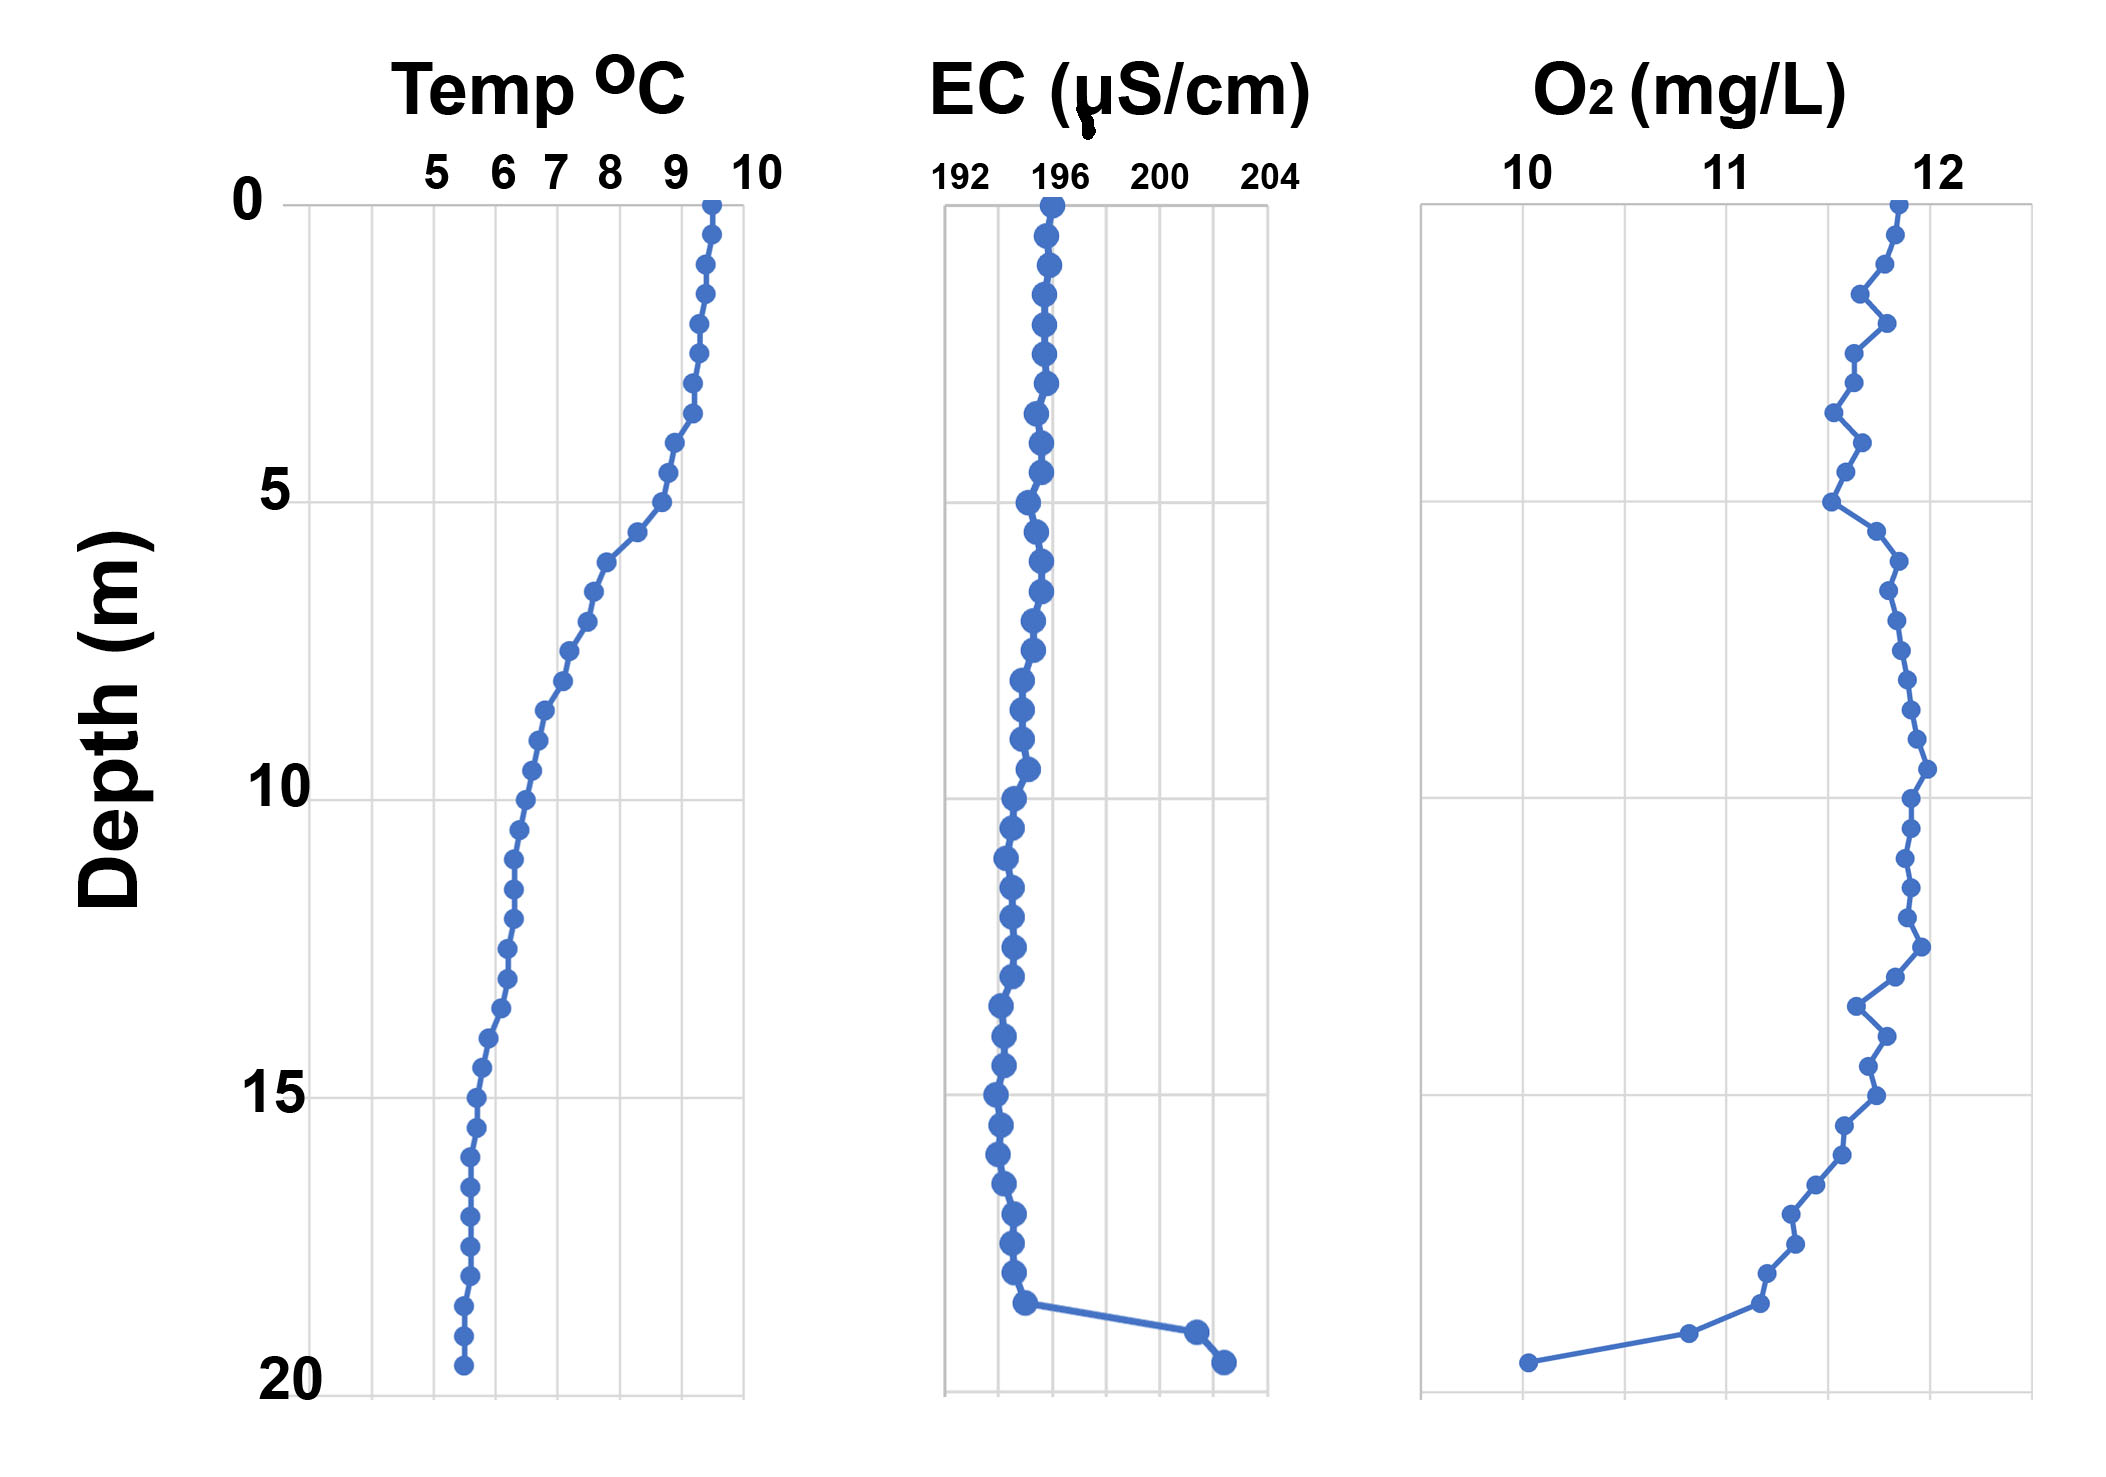
Profiles for April 21, 2023
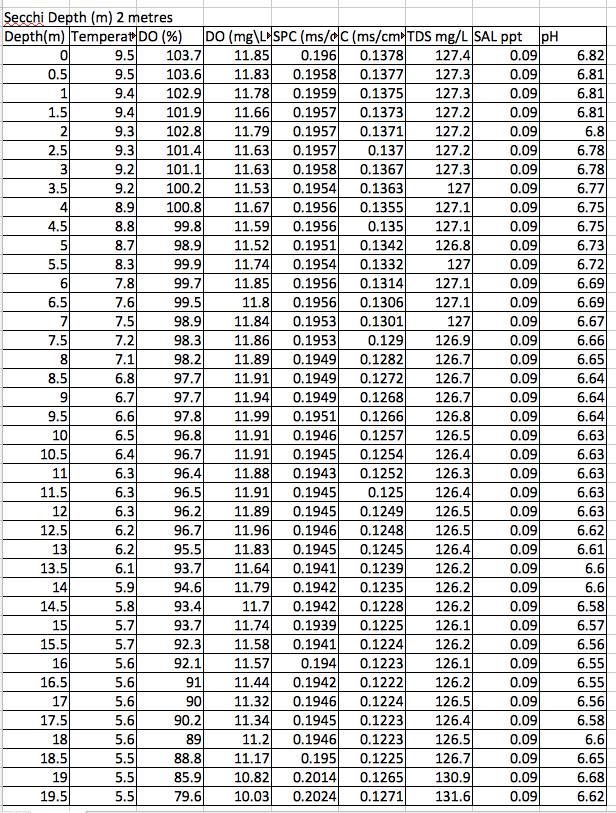
SandyLake_WaterQualityData_21Apr2023.xlsx
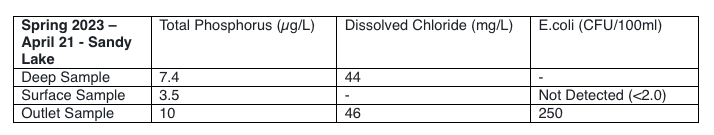
LAB RESULTS FOR APR 21, 2023 SAMPLING
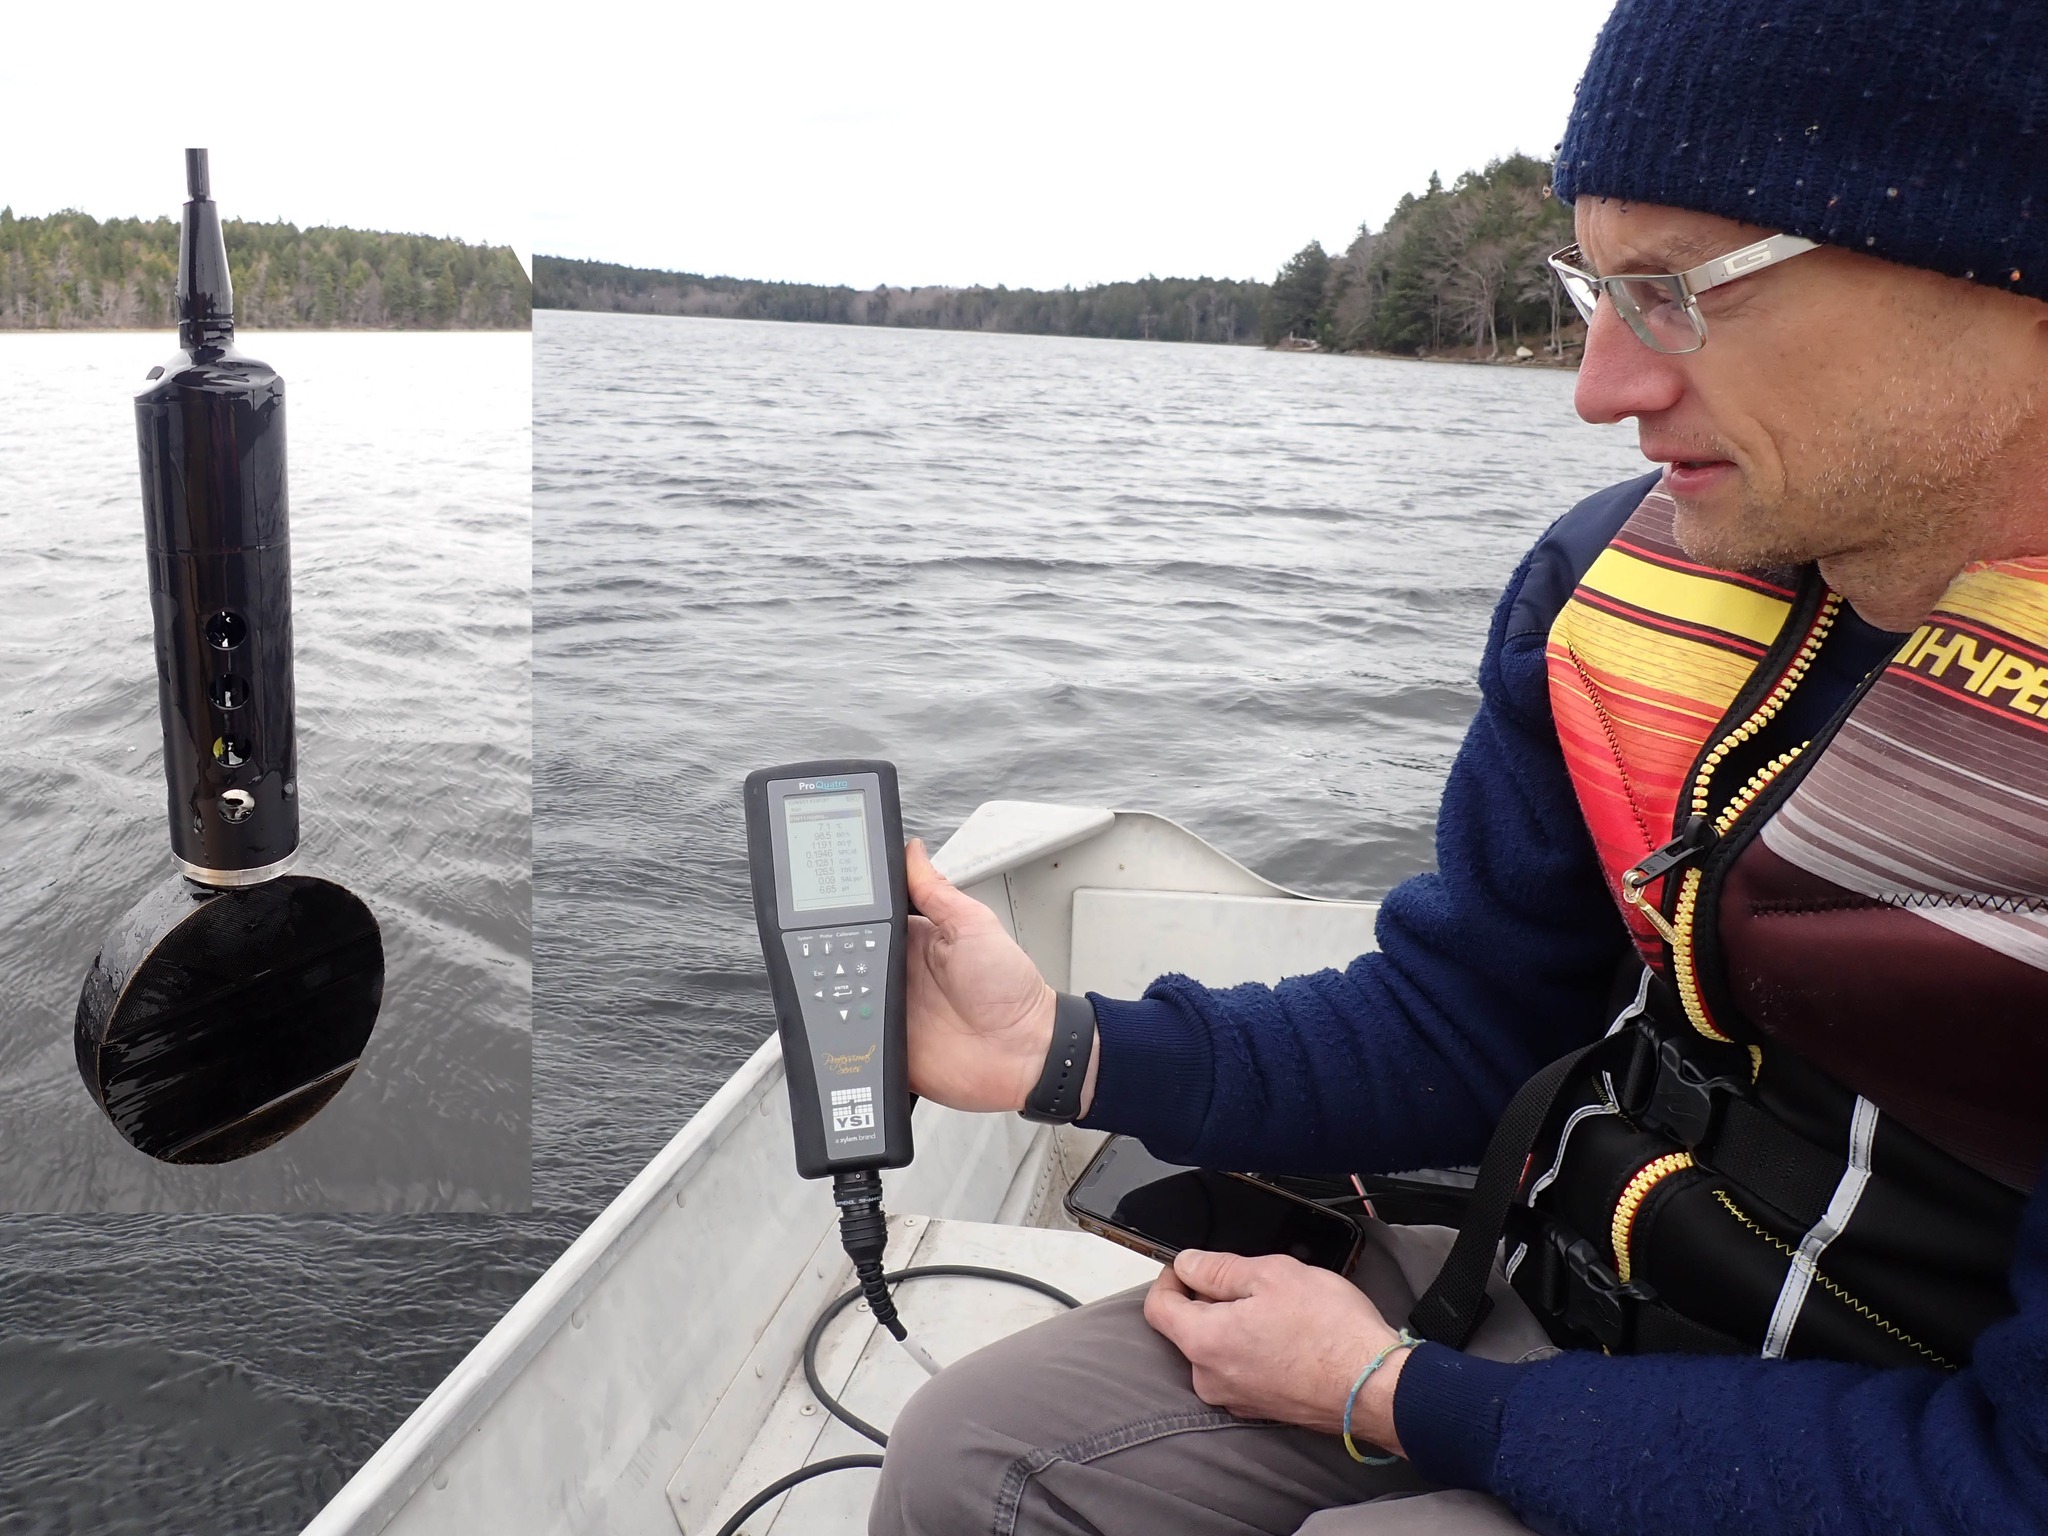
Ed S. with YSI instrument Right) and probe with weight (left)
7B. Notes: As on Aug 22, 2022, these observations were conducted with equipment and specific directions provided by HRM under their new lake water quality sampling program. We also sampled water at the outlet. In the past, we have attached the probe to a separate line with a weighted bucket at the end of it to facilitate our sensing when the probe/bucket reaches the bottom. This year Bruce S. made special weight that goes directly on the probe (there was already a threaded groove on the bottom of the probe). This worked very well. The 19.5 m sample above was with the probe sitting freely on the bottom.
Samplimg sites
It’s notable that the temperature at 5 m and above were approx, 2 deg warmer than they were on April 19, 2022; also it appears the water column has turned over and is developing a thermocline at ~ 5 to 7.5 m. Comparison with the two spring profiles obtained in 2022 (Apr 19 and May 7) suggests faster warming and earlier turnover. Ice cover of Sandy Lake in 2022/2023 was much more restricted than in 2021/2022.
For comparison of YSI Specific Conductivity values with values we measure with the pocket Aquapro Water Tester (see Seasonal Monitoring), I made measurements as below:
| Location | Water Temperature (degC) | EC(uS/cm) |
| Outlet (Surface water) | 12.1 | 207 |
| At Deep Spot Surface | 11.8 | 198 |
| At Deep Spot.V-D bottle at 0.5 m | 10.5 | 205 |
8. Aug 14, 2023
Profiles for Aug 14, 2023
SandyLake_WaterQualityData_14Aug2023
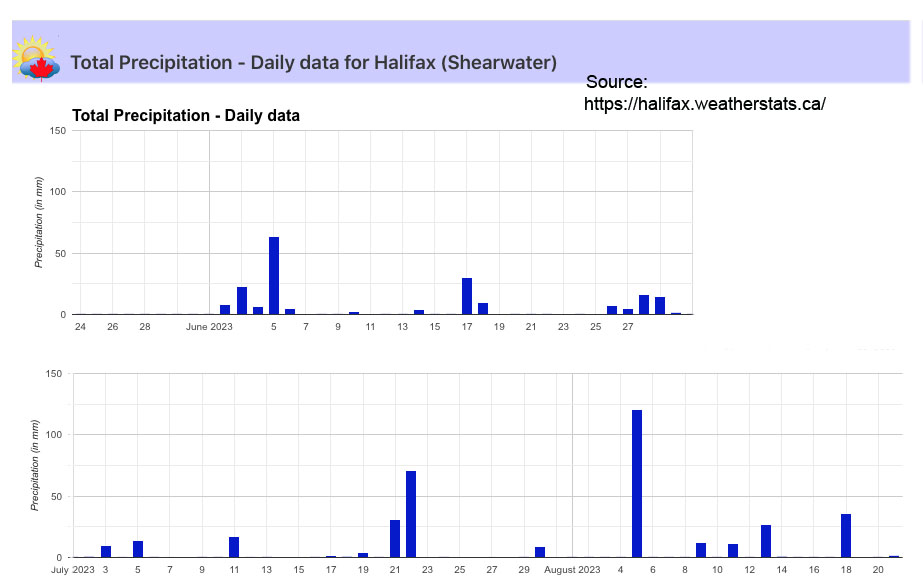
Comment: We had very high rainfall events in July and August with flash floods associated with the rainfall on July 21 & 22, and Aug 5 affecting the Sandy Lake/Bedford area, the latter much less so than the earlier date (Weather Network Aug 5, 2023; Reuters July 24, 2023). Sandy Lake was impacted by overflow from a sewage pumping station on Farmers Dairy Lane: “A wastewater treatment facility in Bedford, N.S., has flooded due to heavy rainfall in the area over the weekend. Its pump and electrical systems have failed. Halifax Water said in a statement Sunday night its wastewater pump station on Farmer’s Dairy Lane is now offline and untreated waste water is overflowing directly into nearby Sandy Lake.” (CTV news July 24, 2023) That overflow was contained by July 26 (HalifaxWater message July 26, 2023). The water level in Sandy lake went 5-6ft higher (B. Sarty, lakeside resident). The surface EC was 182 uS/cm on the June 7th sampling, and 101 uS/cm on Aug 2 (see Seasonal Monitoring page)
8B. Comparison of Apr 21 and Aug 14, 2023 profiles
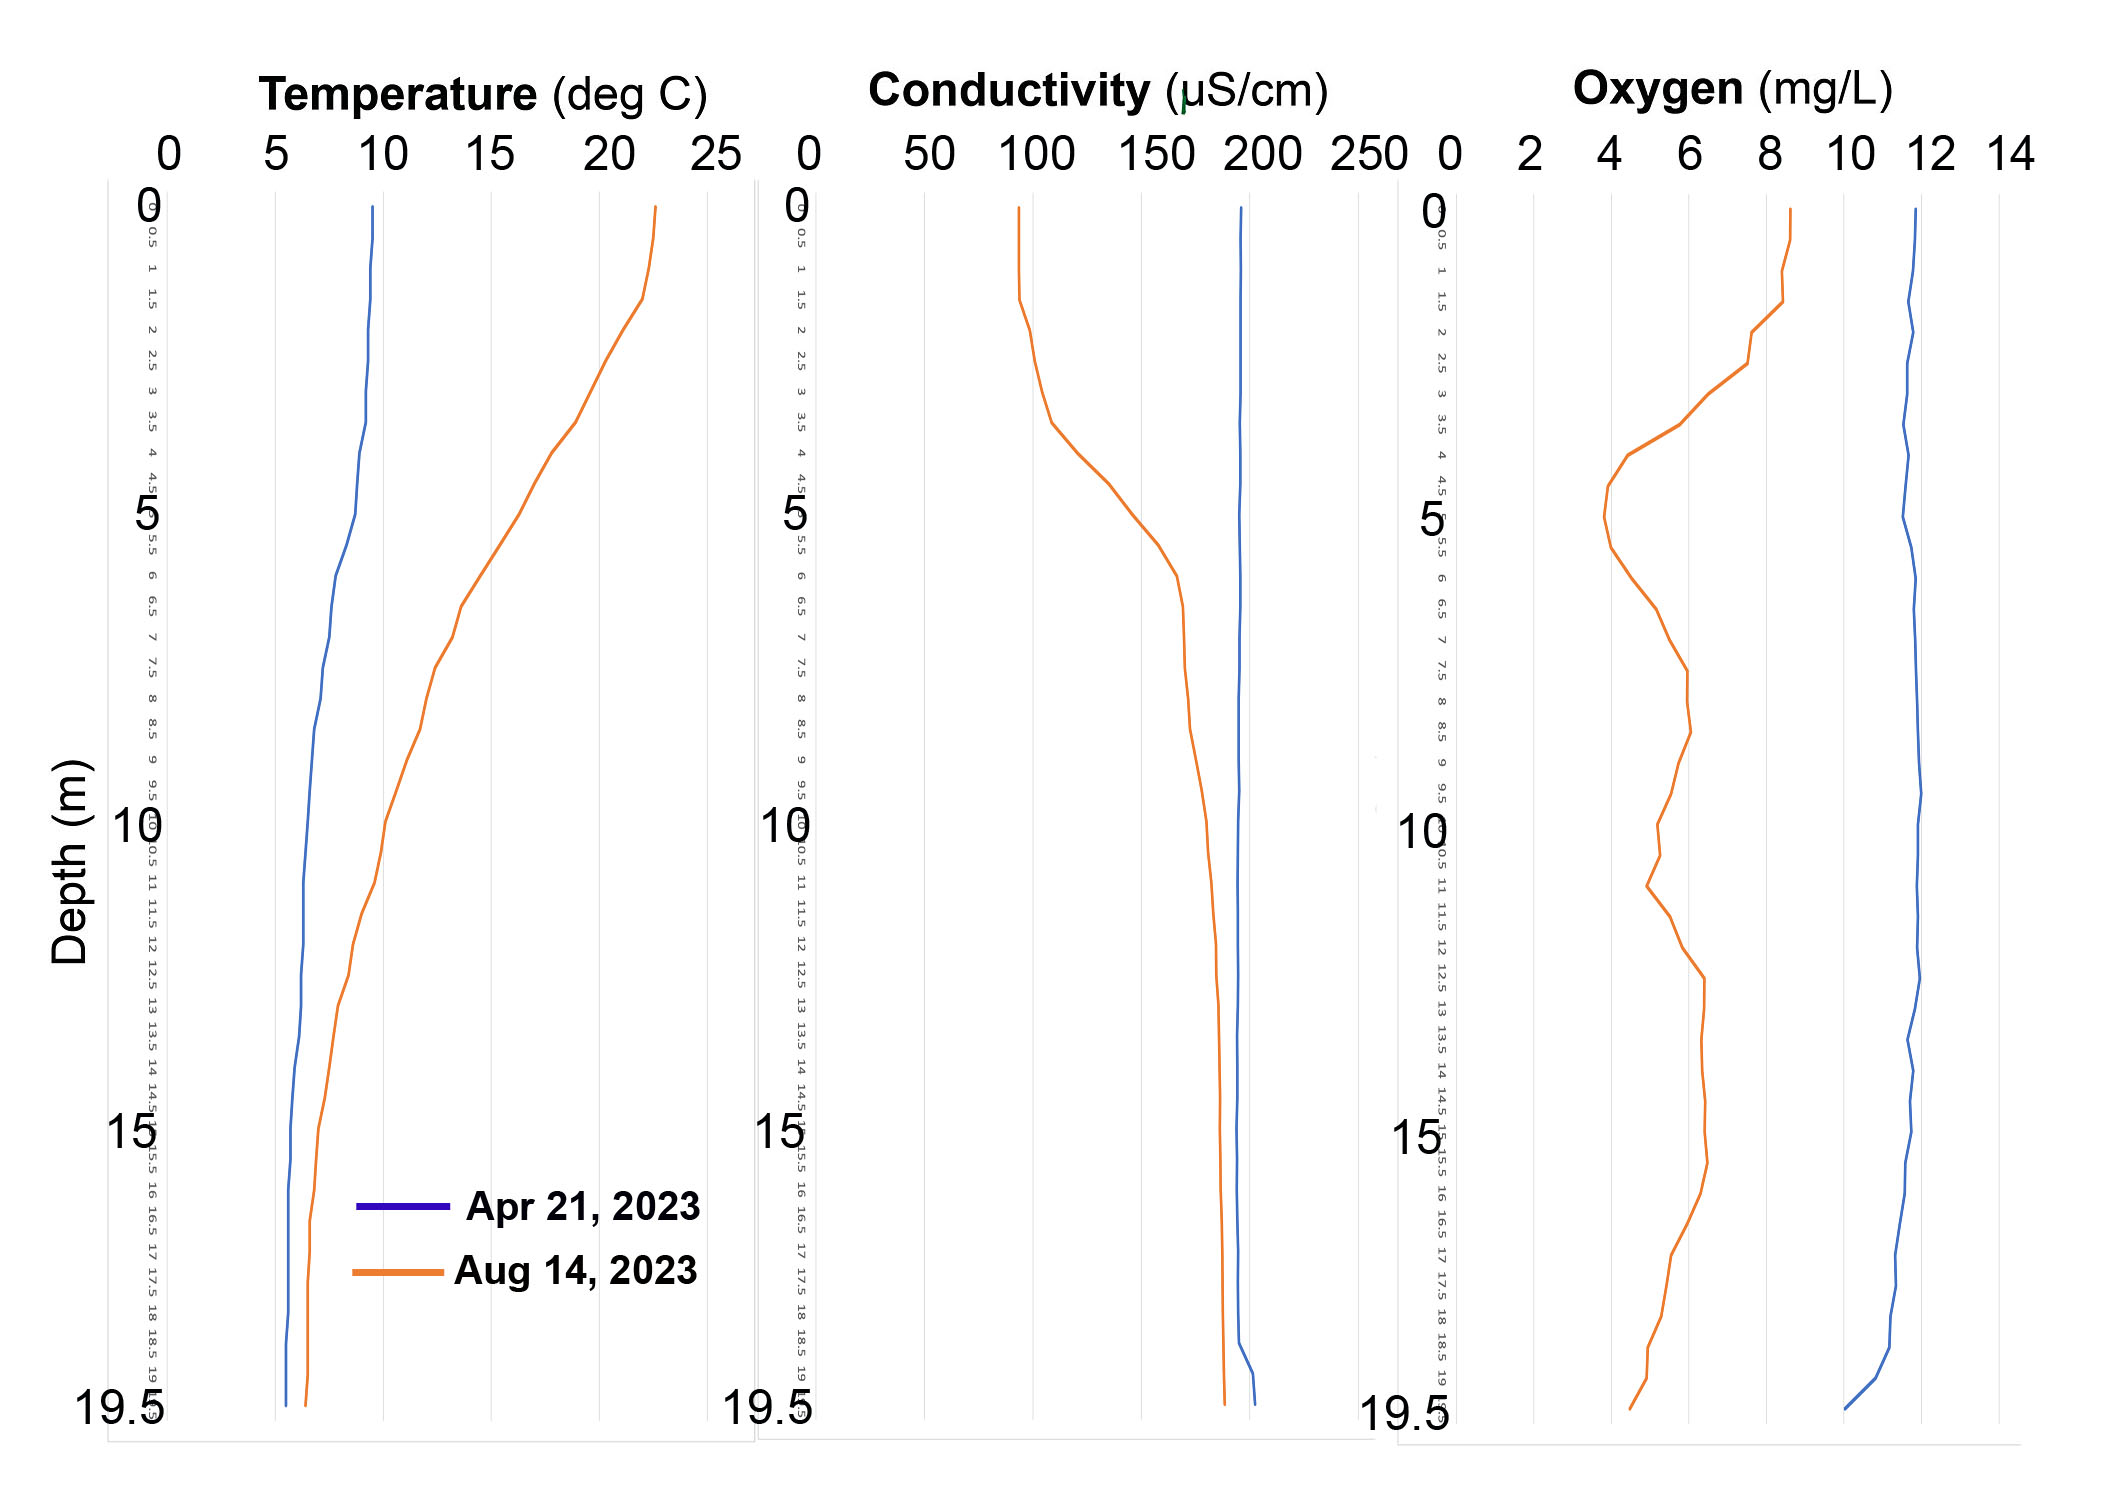
Of particular note: Freshening of entire water column in Aug.
8C. Comparison of mid-August profiles 2022 and 2023
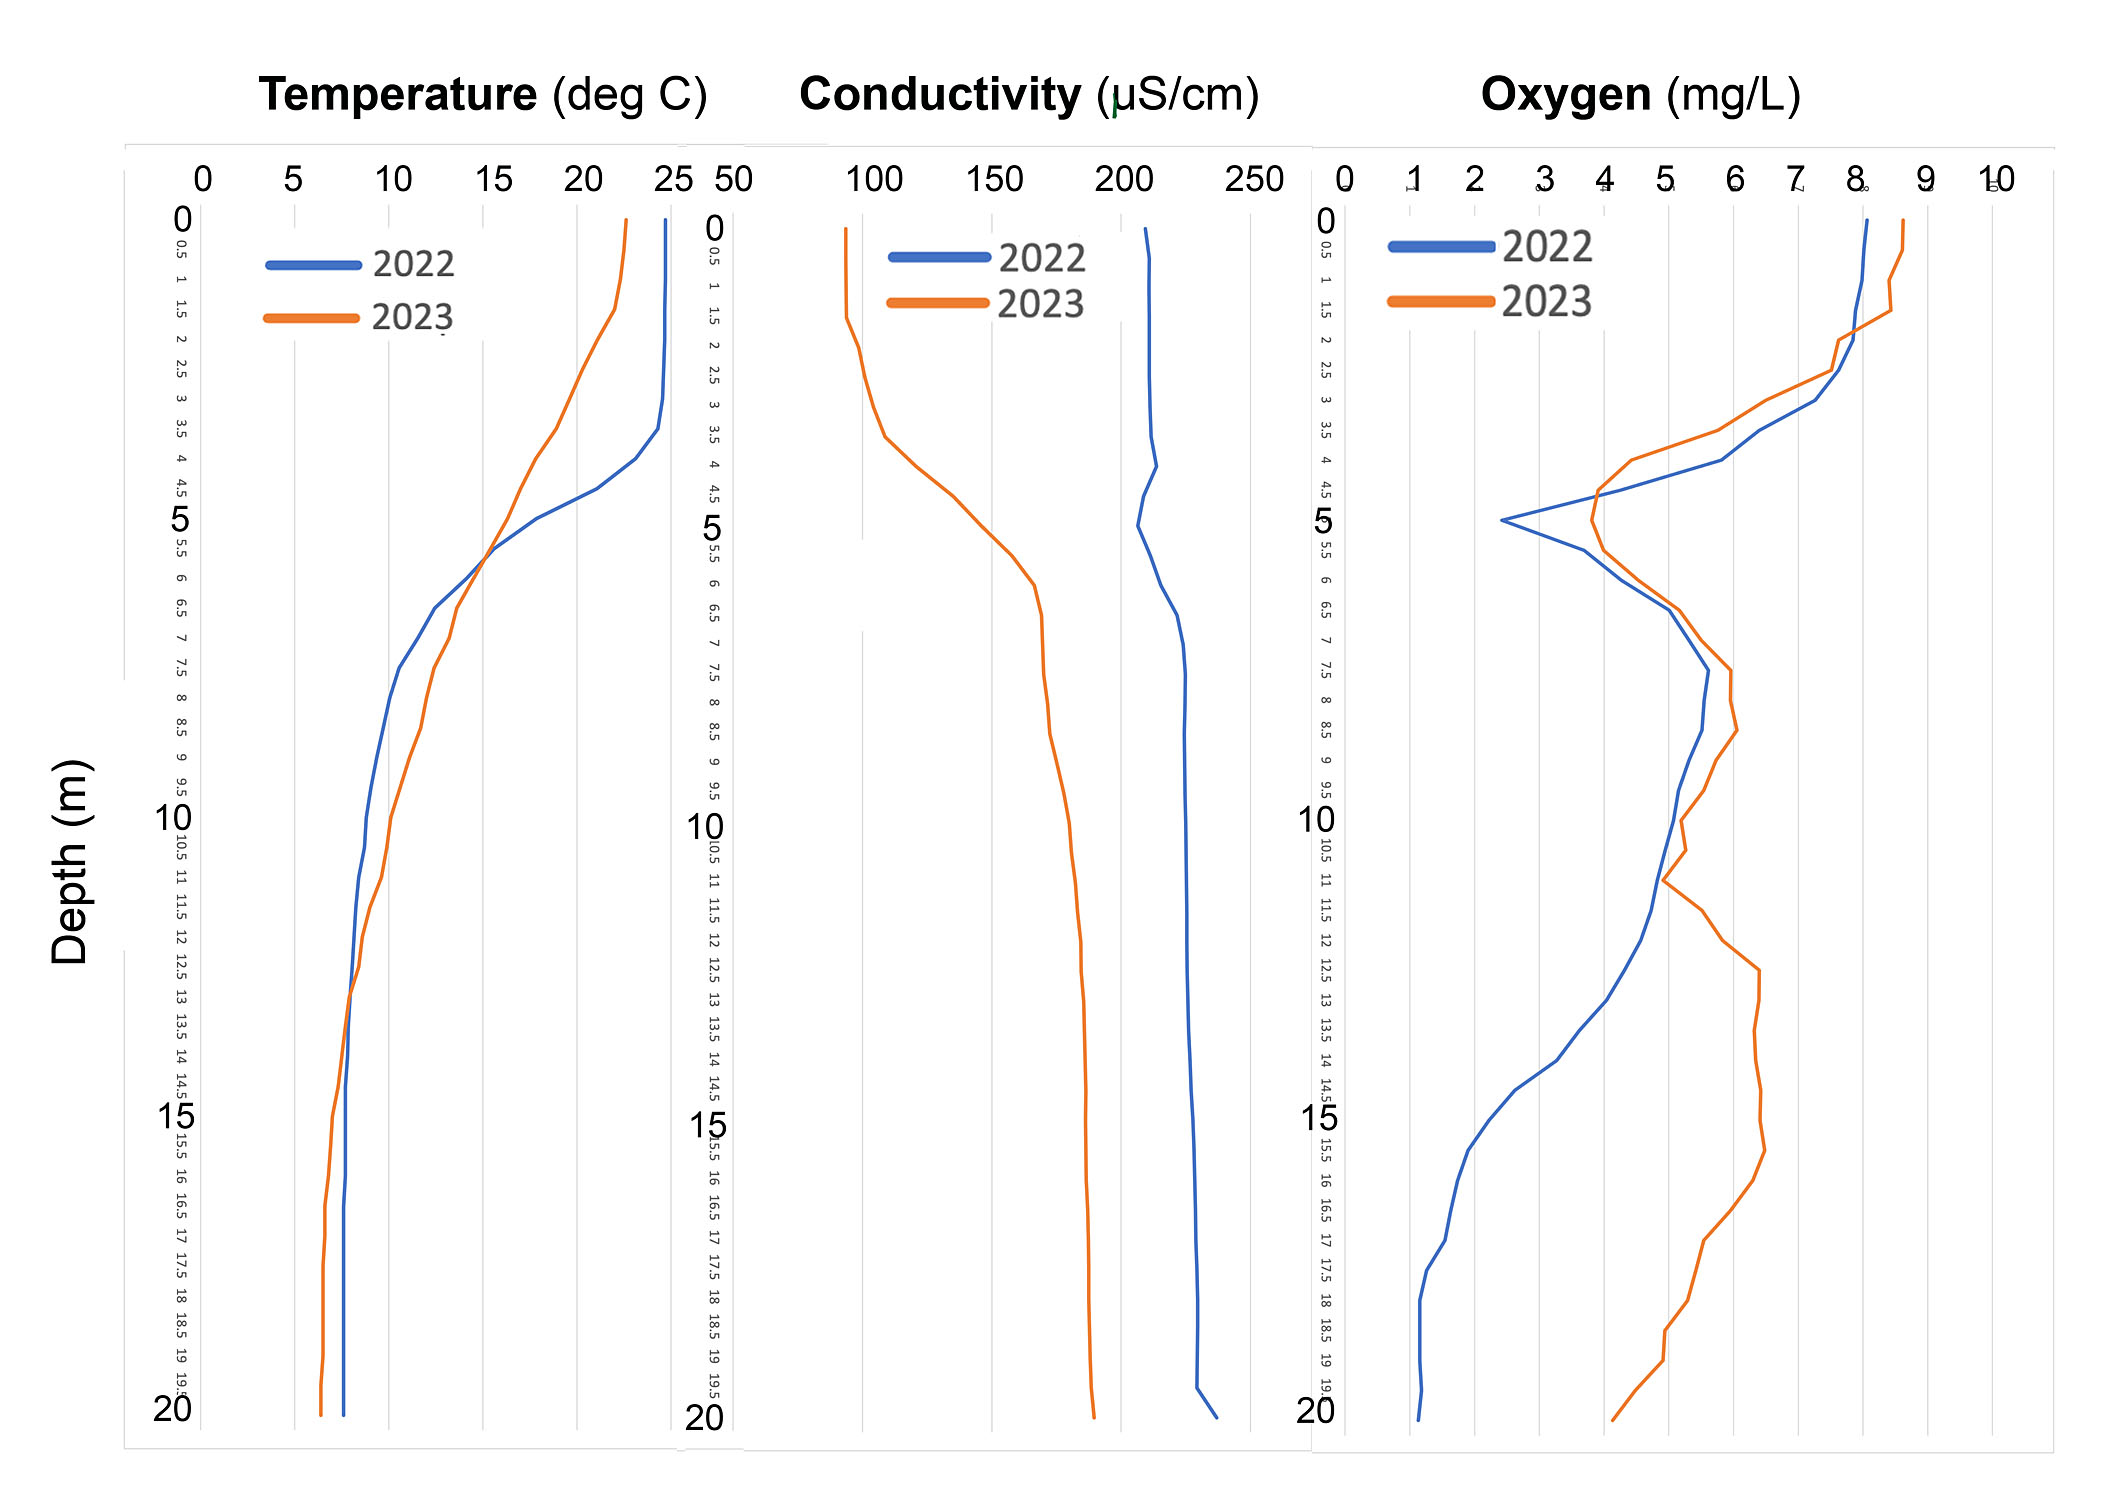
In 2023 compared to 2022: (i) weakening of thermal stratification; (ii) “freshening” of entire water column & increased salt stratification; (iii) Hypolimnion oxygen increased; Metalimnion Oxygen Minimum at 5 m retained; there is a second minimum at 12 m – is that the “old” 5 m minimum pushed deeper, or a new one?
Also see this subpage for more discussion of the 2023 results: 2023 Limnological Profiles & effects of episodic precipitation
LAB RESULTS FOR AUG 14, 2023 SAMPLING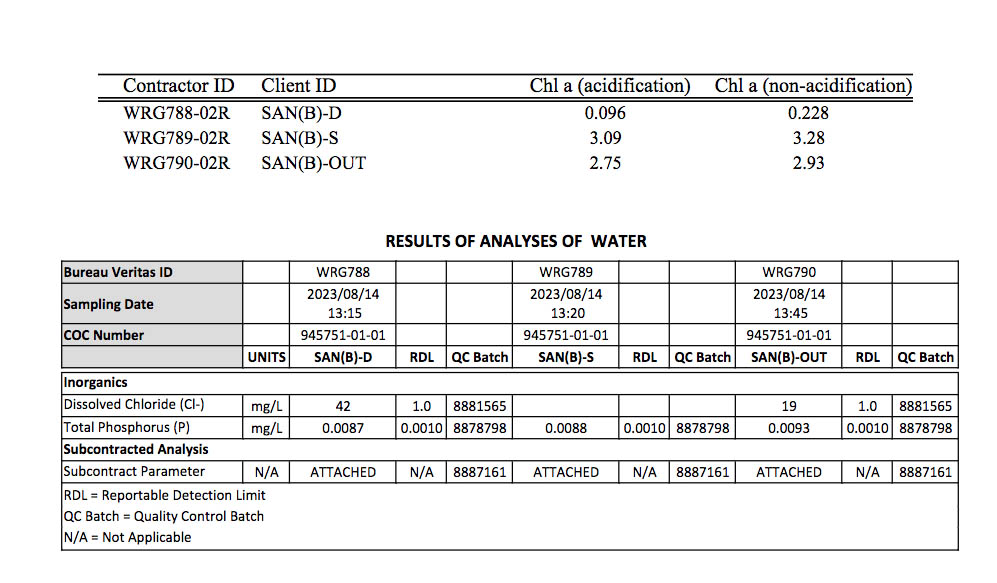
All Report Files received from the HRM LakeWatchers Program for analyses of water samples from Aug 14, 2023 (titles inserted) :
ChlorophyllaResults.pdf
ChainOfCustory.pdf
ChloridePhosphorusEcoli.pdf
Results in Excel File Saved as PDF.pdf
Results in Excel File.xlsx
CCME Guidelines for Chloride .pdf
CCME Guidliens for dissolved-oxygen.pdf
CCME Guideleins for phosphorus.pdf
& this link given to help in interpretation: A MONITOR’S GUIDE TO WATER QUALITY
9. Apr 15. 2024

Ed G, Chris K (foreground), photo by Derek S
Courtesy of Sandy Lake volunteers Ed G. Derek S., and Lake Watchers Halifax’s Chris K.
Normal spring turnover!
A sharp increase in conductivity between 19 and 20 m (see table below) indicates the 20 m sample was on/within the bottom, so the plotted profiles go to 19 m, not 21.
SandyLake_WaterQualityData_15Apr2024.xlsx
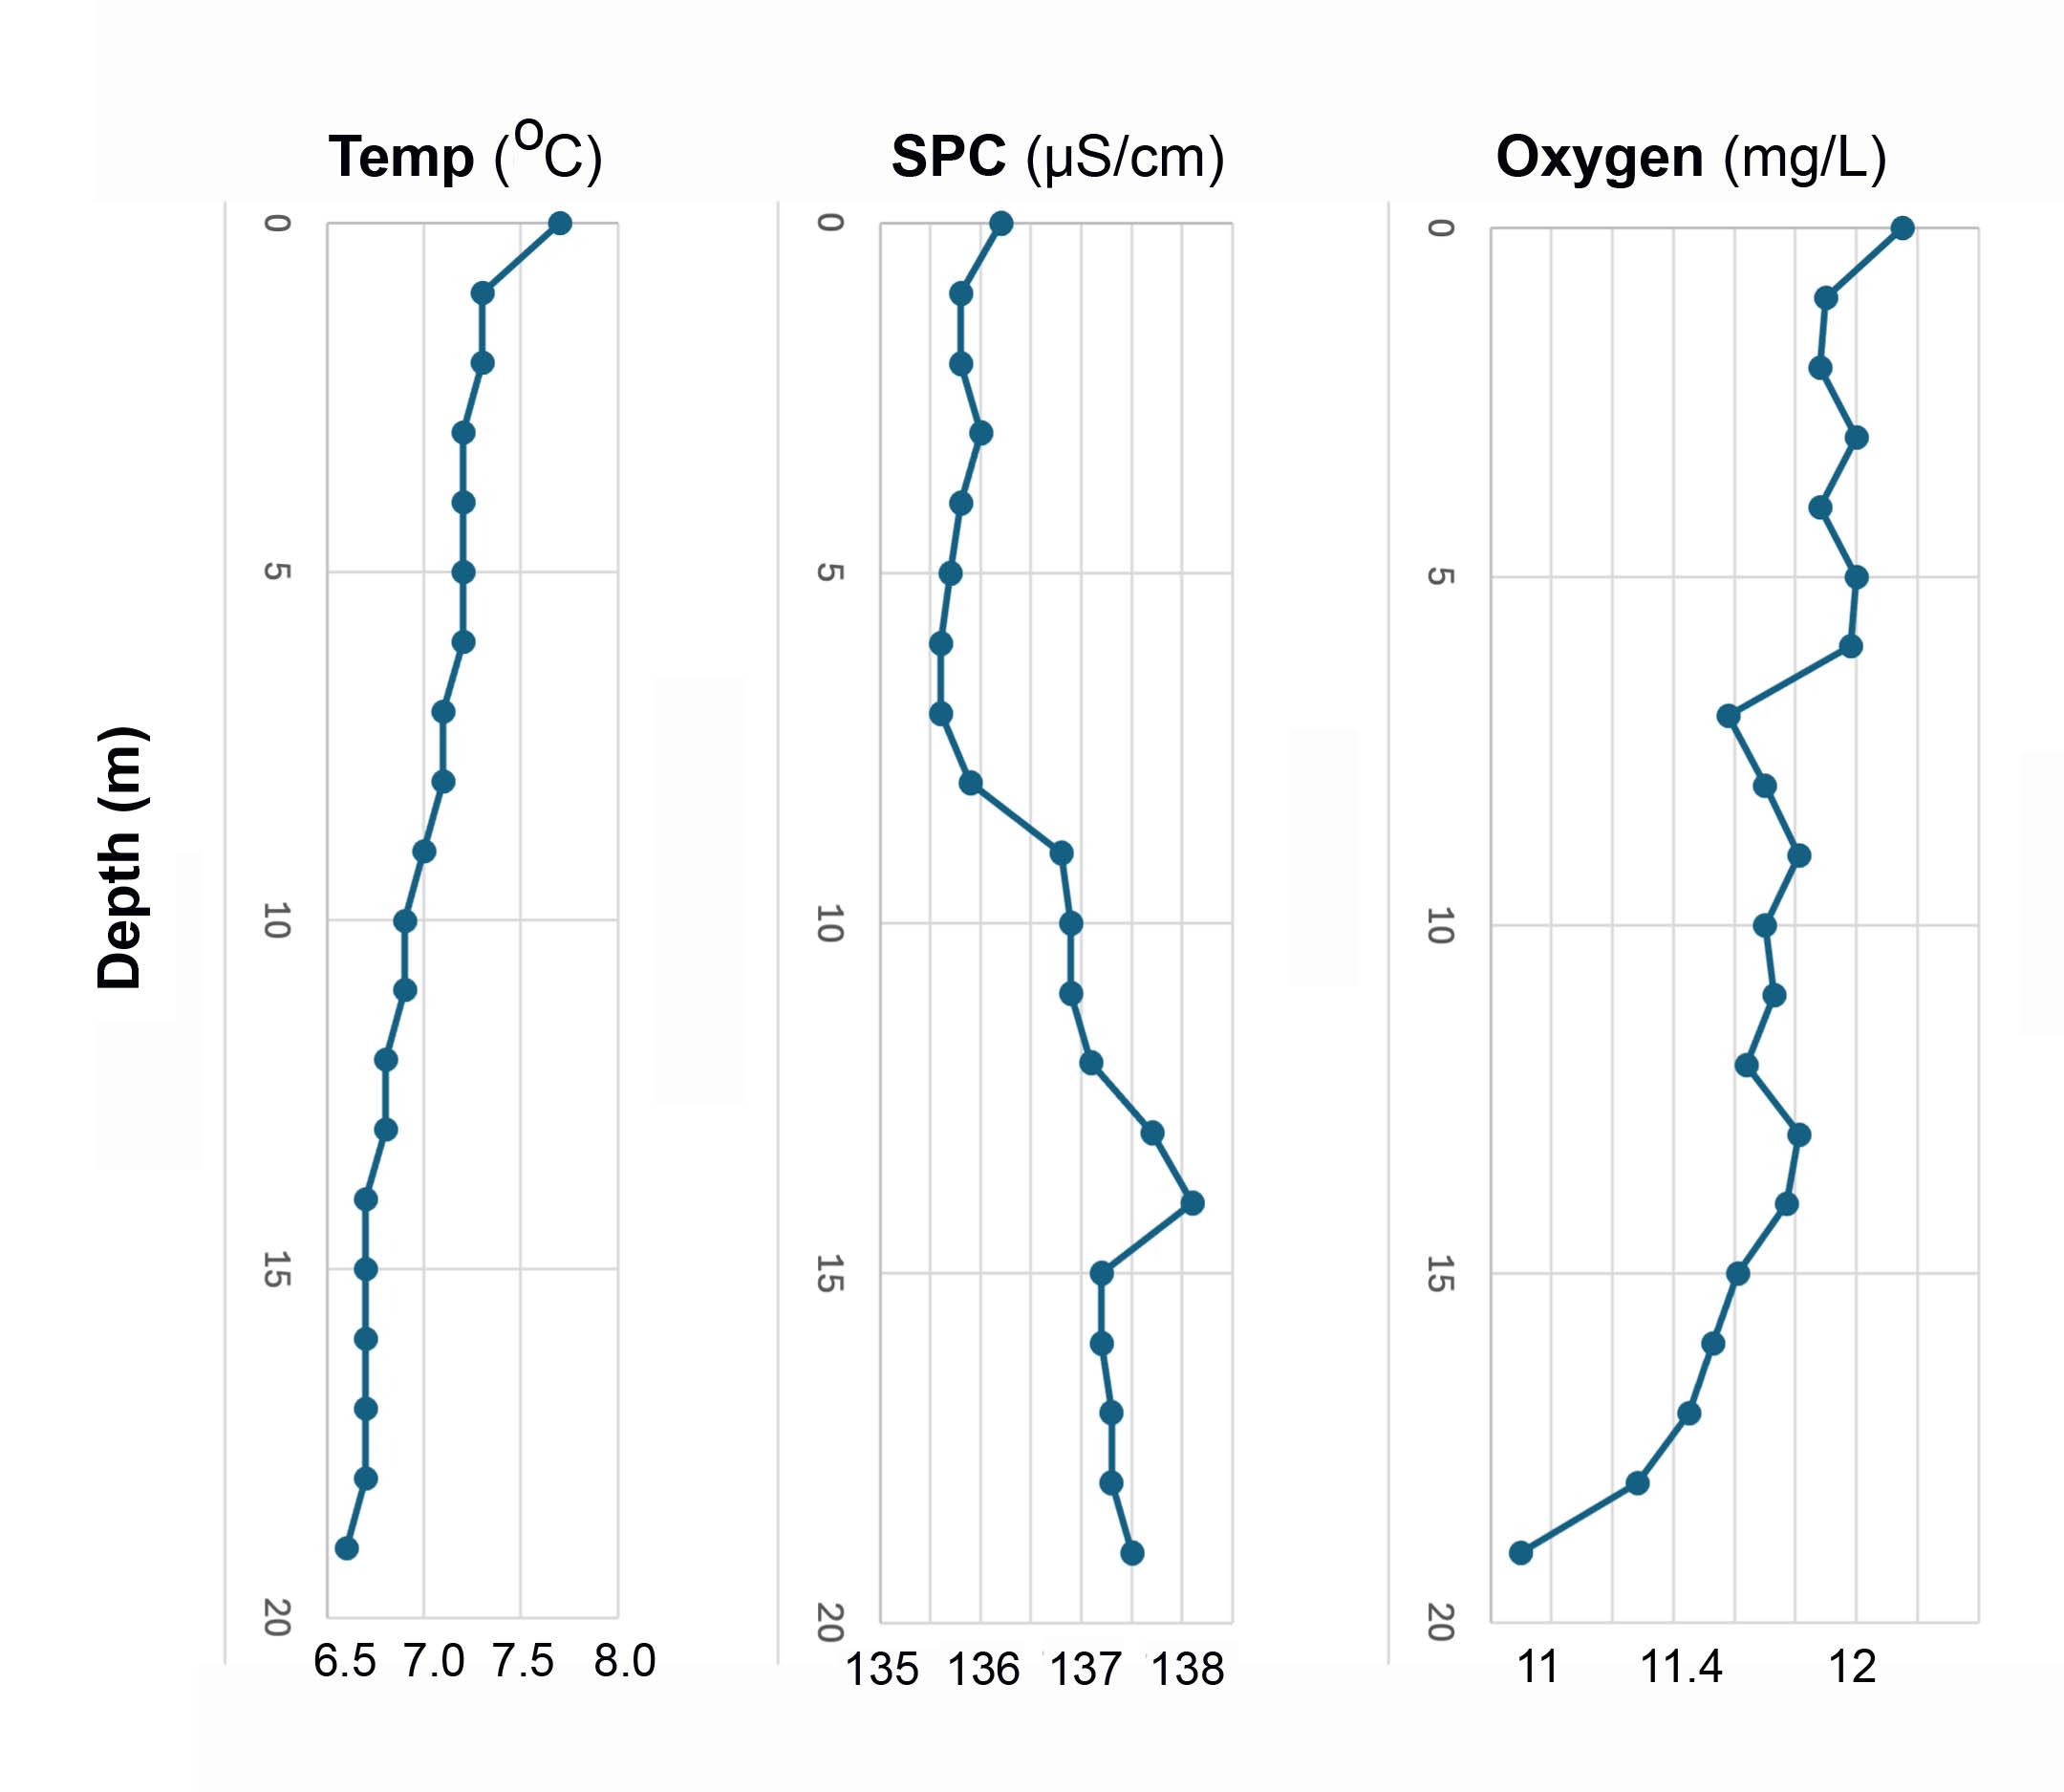
Vertical Profiles for Apr 15, 2024. Note narrow ranges of the variables (1.1 deg for temperature; 2.5 uS/cm for conductivity, 1.25 mg/L for oxygen with all values above 10 and 89% saturation.

LAB RESULTS FOR APR 15, 2024 SAMPLING
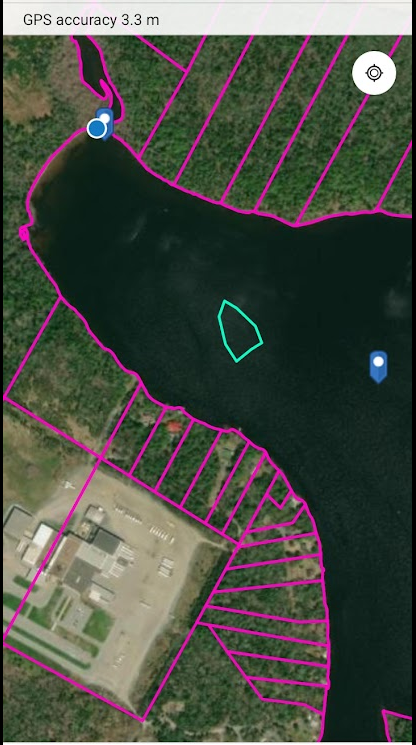
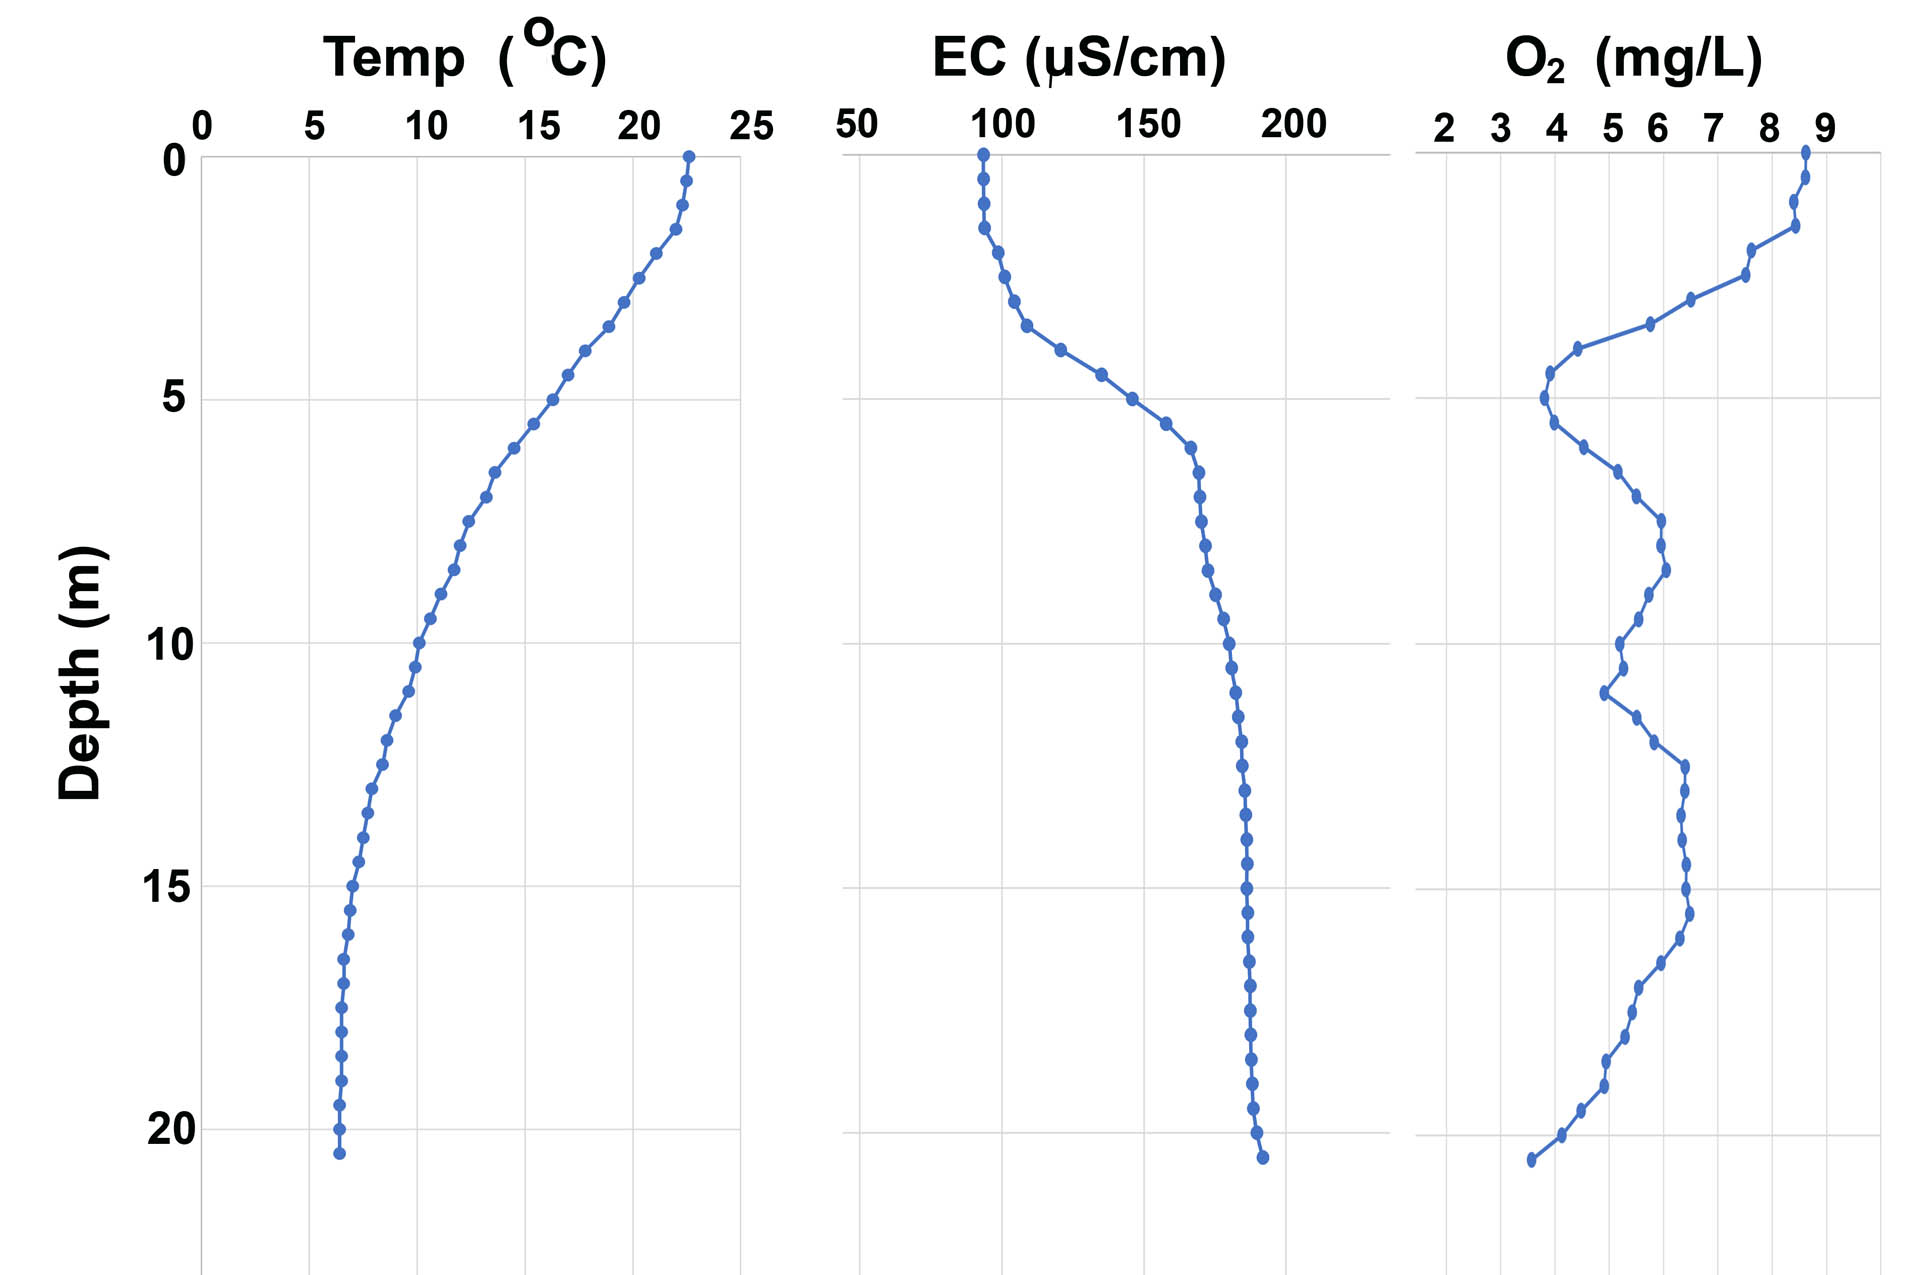
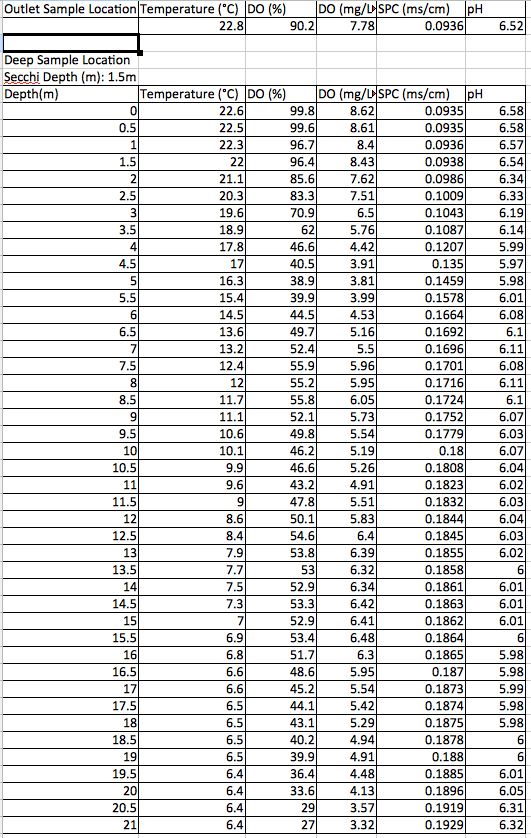
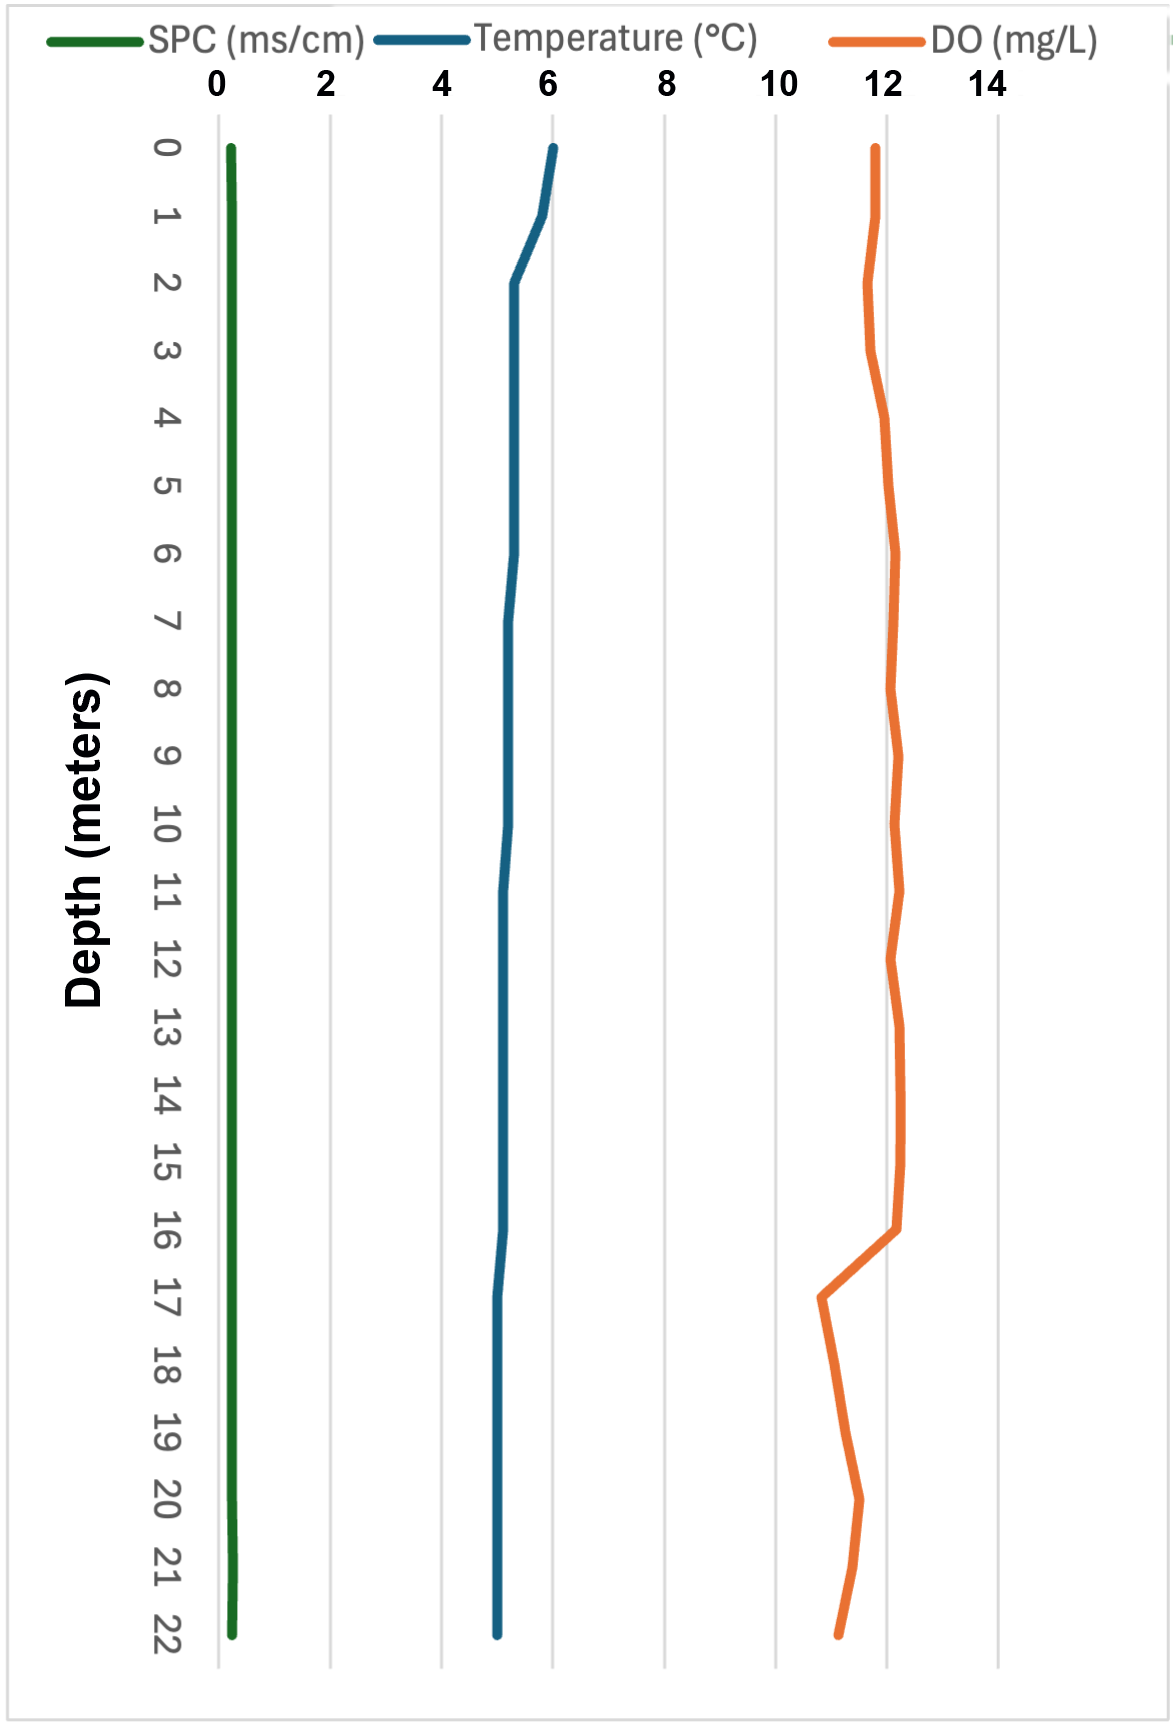
10. Aug 12, 2024
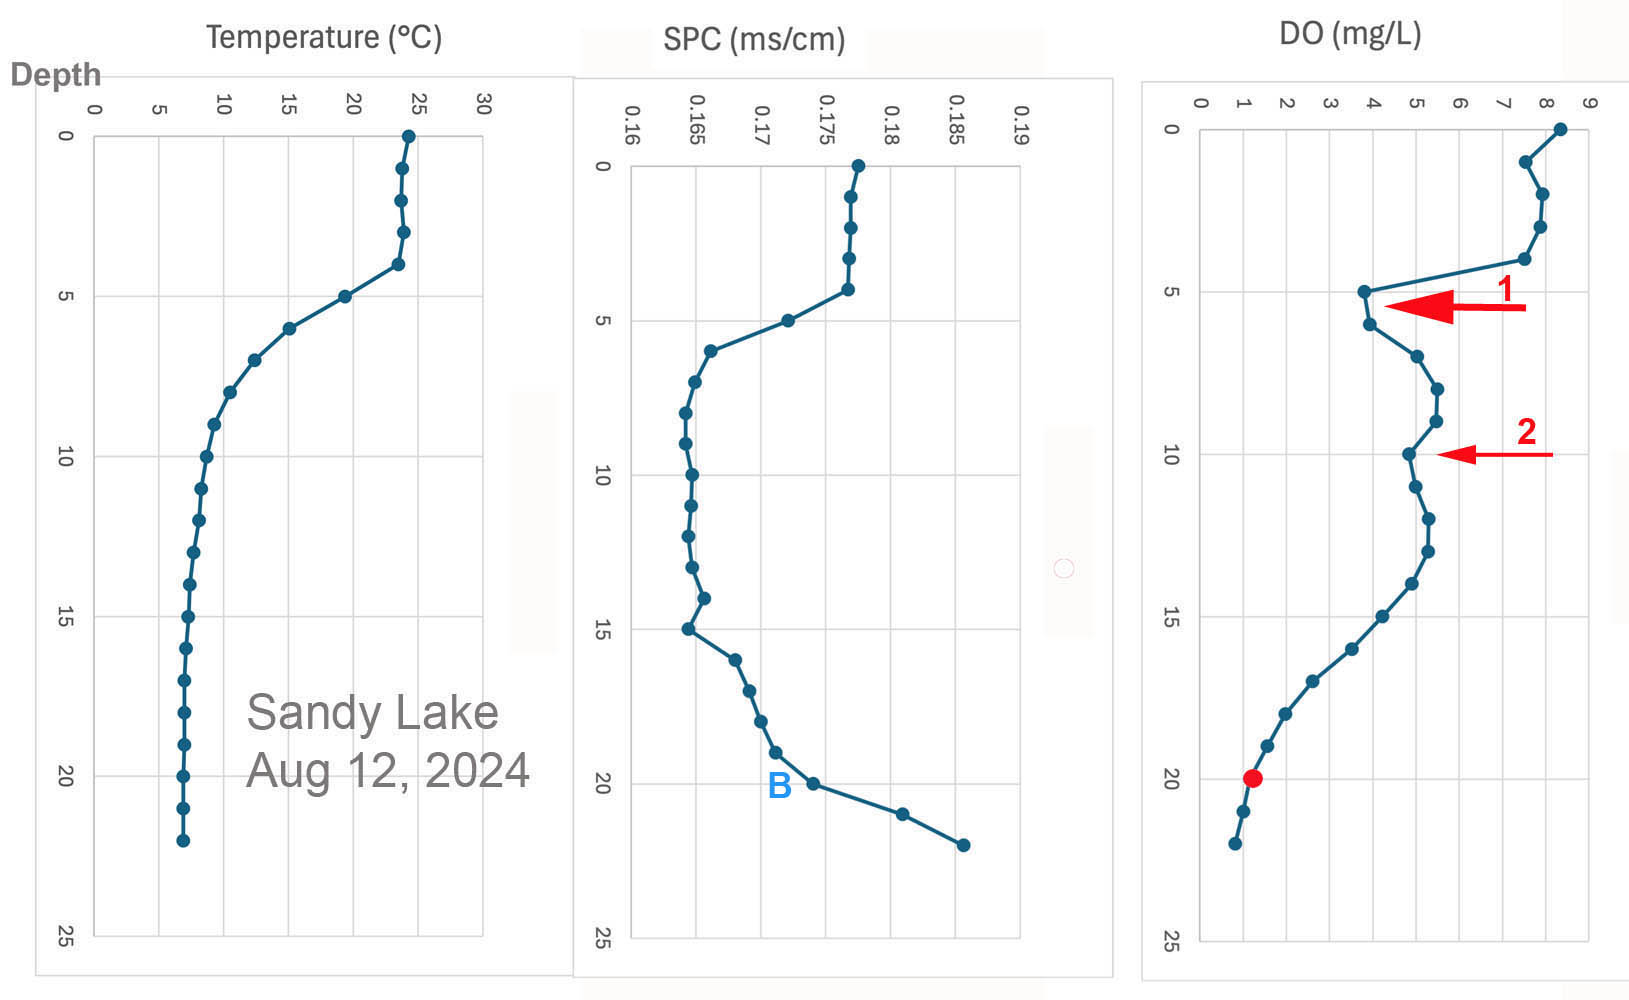
Vertical Profiles for Aug 12, 2024. Note the narrow range of SPC values. “B” is bottom* It is curious that water between 5 & 17 m is sightly fresher than 0-5 m; also colder, so still stratified. Possibly reflects saltier water entering the lake as the summer progressed. The D.O. plot again shows the “Metalimnion Oxygen Minimum” (arrow 1)at approx 5 m as in 2021, 2022 and 2023, and a weaker minimum at about 10 m (arrow 2) – observed also in 2023 but not in 2021 and 2022 – and the deep water/Bottom oxygen is again very low, unlike last year when heavy summer rains appeared to flush the lake top to bottom.
See Subpages:
– 2023 Limnological Profiles & effects of episodic precipitation…
– 2024 Limnological Profiles – return to historic trends
*Typically SPC increases suddenly once the probe in on the bottom. On this occasion we did not have the weight we usually attach to the probe -see photo above, which allows us to sense the bottom, however when the Van Dorn bottle was lowered, we detected the bottom at 20 m.
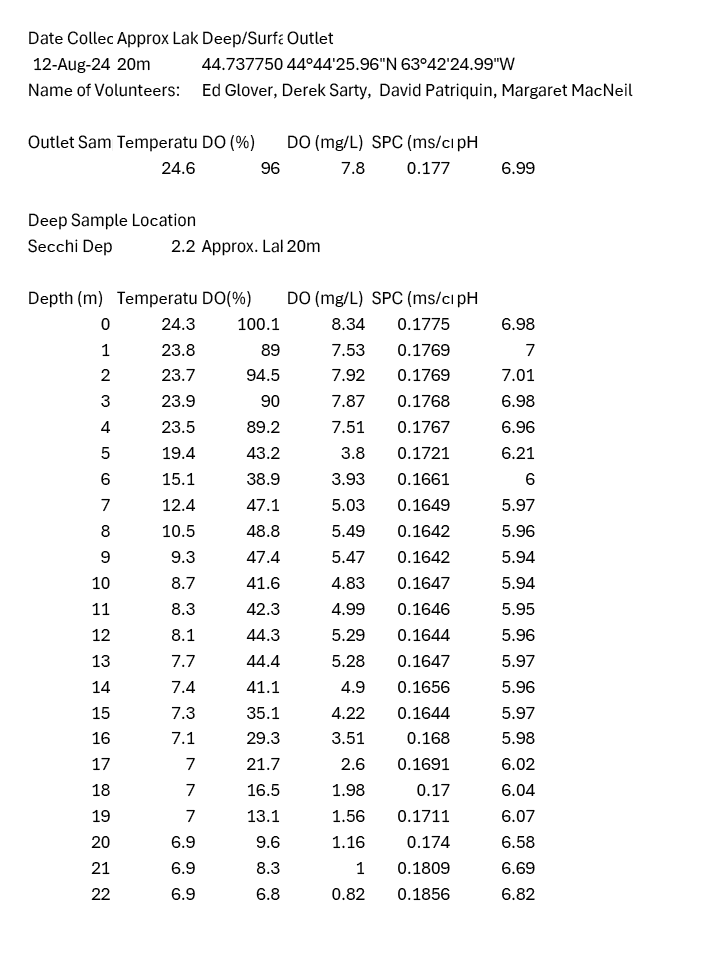
Screen capture from data files (below)
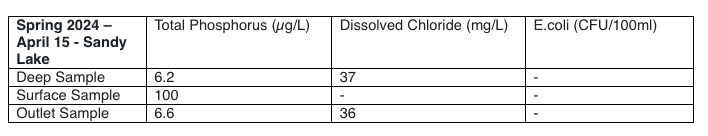
LAB RESULTS FOR AUG 12, 2024 SAMPLING
Received Sep 12, 2024 from LakeWatchers:
Note the excoeptonally high Deep Sample P – given the very low oxygen near the bottom, 1.16 mg/L at 20 m, this likely is due to sediment P mobilization under anoxic conditions.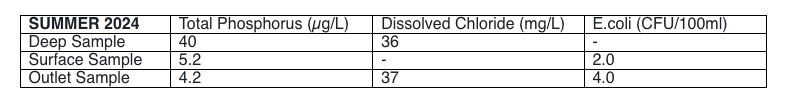
SandyLake_WaterQualityData_12Aug2024.PDF
SandyLake_WaterQualityData_12Aug2024.xlsx
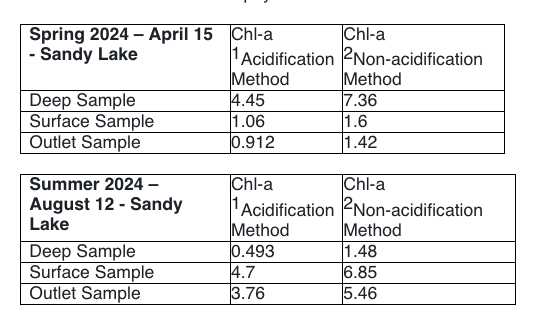
1) Holm-Hansen O, Lorenzen CJ, Holmes RW, Strickland JDH (1965) Fluorometric determination of chlorophyll. J Conseil 30:3-15
2) Welschmeyer NA (1994) Fluorometric analysis of chlorophyll a in the presence of chlorophyll b and phaeopigments. Limnol Oceanogr 39:1985-1992
11. April 11, 2025
Normal Spring Turnover! Ice-out was March 21, 2025 (Bruce S.)
EC values bumped up from prev few years, reflecting colder winter, more salting

LIT/LINKS CITED
Quantified Hypoxia and Anoxia in Lakes and Reservoirs
Gertrud K. Nürnberg. 2004 The Scientific World Journal 4, 42–54
The Exchange of Dissolved Substances between Mud and Water in Lakes
Clifford H. Mortimer 1942. Journal of Ecology 30: 147-201
Chesley Lake 1991 Water Quality Assessment
Ontario Ministry of Environment, 1993
On the Metalimnion Oxygen Minimum:
See
– Surface Waters/ Lit & Links: Metalimnetic Oxygen Minima
– 2023 Limnological Profiles & effects of episodic precipitation