
‘workin on it
“EC” is shorthand for Electrical Conductivity. It is a property of water routinely included in water quality measurements. Along with temperature and oxygen (and sometimes pH) it is one of the basic variables that is measured with multiparameter water-quality instruments to characterize “vertical profiles” of lakes.
EC is a measure of the capacity of water to conduct electricity, a property than can be measured readily and reliably with very simple instruments.
The standard units for electrical conductivity in fresh waters are microsiemens per centimeter, µS/cm or sometimes without the special symbol for “micro” as uS/cm.
EC increases with ionic content.
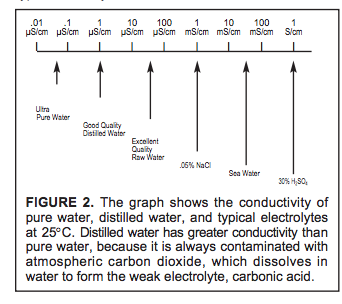
Conductivity is a measure of water’s capability to pass electrical flow. This ability is directly related to the concentration of ions in the water. These conductive ions come from dissolved salts and inorganic materials such as alkalis, chlorides, sulfides and carbonate compounds.. Compounds that dissolve into ions are also known as electrolytes The more ions that are present, the higher the conductivity of water. Likewise, the fewer ions that are in the water, the less conductive it is. Distilled or deionized water can act as an insulator due to its very low (if not negligible) conductivity value. Sea water, on the other hand, has a very high conductivity. – Read more at Conductivity, Salinity & Total Dissolved Solids: What is Conductivity?on fondriest.com
The “limnologically important ions“ are the cations Ca2+ Mg2+ Na+ K+ NH4+ and the anions HCO3–, SO42- Cl– NO3– F– CO32-; the bolded ions typically account for 99% of the EC.
If all of the major ions (cations and anions) are measured, a “Theoretical Conductivity” can be calculated. Typically the calculated values are very close to observed values; if not it’s an indication that something has been missed in the ion analysis, e.g., metals that could be entering surface waters from mining operations.
EC is influenced by temperature. So for precise comparison of EC values, EC values should be adjusted to a standard temperature.
Conductivity increases approximately 2-3% per 1°C increase in temperature, though in pure water it will increase approximately 5% per 1°C 11. This variation is why many professionals use a standardized comparison of conductivity, known as specific conductance, that is temperature corrected to 25°C – from Fondriest
The meter we have been using for most EC measurements, the AP-2: AquaPro Water Quality Tester (EC) provides Automatic Temperature Compensation
Typical EC values
| Water Type | Electrical Conductivity (uS/cm) |
| Distilled water | . 0.5 – 3 |
| Melted snow | 2 – 42 |
| Tap water | 50 – 800 |
| Potable water | 30- 1500 |
| Freshwater streams | 50 – 2000 |
| Industrial wastewater | 10,000 |
| Seawater | 50,000 |
*From Conductivity, Salinity & Total Dissolved Solids: What is Conductivity on fondriest.com; except that the lowest value for freshwater streams was changed from 100 to 25 to better represent values in Nova Scotia. Most lakes without significant development or seawater influence in NS have values in the range 30 to 400 uS, the higher values commonly associated with lakes in areas of gypsum or limestone deposits. In the Halifax area, EC values of pristine lakes and associated streams are typically fall within the range 30-60 uS/cm.
TDS or Total Dissolved Solids is the weight of all particles smaller than 2 microns in water, expressed as milligrams per liter, mg/L and is measured by measuring the weight remaining when all of the water in a sample has evaporated. In “clean water”, TDS are made up mostly of ionic substances and there is a close relationship between TDS and EC, so TDS can be estimated from the more readily measured EC. The exact relationship varies with ionic composition (see Fondriest article). “Dirty water” may include significant components of small non-ionic substances such as urea and hydrocarbons; for such waters, there may be a very poor relationship between TDS and EC (see Rusydi, 2017 for examples).
Salt, Salinity EC increases with increasing content of “salts” as defined chemically, so EC could be thought of as a measure of the salt content. “Salty waters” are waters with sufficiently high content of common ions that they taste “salty”. “Salinity” is a term generally applied only to seawater. Seawater has highly consistent proportions of the major ions and so there is a highly consistent relationship between “salinity” as traditionally measured in seawater* and electrical conductivity; today salinity of seawater is generally determined by measuring its electrical conductivity and applying particular formulas or conversion factors to give the “salinity” in units that describe the weight of salt in a kilogram of seawater, typically g/kg or “parts per thousand”, ppt. Typical seawater has values in the range of about 32 to 35 g salt/kilogram of water (32-35 ppt).
__________________
*By determination of chloride content or the “chlorinity”; or from measurement of the weight of a sample of water of known volume at a known temperature, i.e. its “density”, the weight per unit volume.
The units for salinity are similar to units for TDS, except TDS is expressed per liter of water not per kilogram; one kilogram of pure water occupies one liter (a density of 1 g/mL) at 4 deg C. The differences are very small numerically, but can be important in relation to oceanographic calculations that involve density.
Sources of conductivity. To Add
Some links & lit
Conductivity, Salinity & Total Dissolved Solids: What is Conductivity?
On fondriest.com
Calculating the conductivity of natural waters
Rich Pawlowicz Limnol. Oceanogr.: Methods 6, 2008, 489–501
A Simplified Model to Estimate the Concentration of Inorganic Ions and Heavy Metals in Rivers
Clemêncio Nhantumbo et al., Water 2016, 8, 453 (pdf)
Understanding Lake Quality
US EPA 57 page pdf.
Water on the Web: Ecoregions
Illustrate how EC and other variables differ between Ecoregions. Also view Water on the Web: Electrical Conductivity
Electrical conductance – a versatile guide in freshwater science
J.F. Talling 2009. Freshwater Reviews 2, pp. 65-78
CAN YOU DETERMINE WATER HARDNESS FROM CONDUCTIVITY OR TOTAL DISSOLVED SOLIDS MEASUREMENTS?
THE CONDUCTIVITY OF LOW CONCENTRATIONS OF CO2DISSOLVED IN ULTRAPURE WATER FROM 0-100°C
Truman S. Light et al., 1995
https://www.mt.com/dam/mt_ext_files/Editorial/Generic/7/Paper-THOR-Gray-CONDUCTIVITY_Editorial-Generic_1201100849793_files/iwc_06-29_gray_conductivity.pdf. A Comprehensive Look at Conductivity Measurement
in Steam and Power Generation Waters
file:///Users/davidpatriquin/Downloads/Bhateria-Jain2016_Article_WaterQualityAssessmentOfLakeWa.pdf
EC (electrical conductivity)
Conductivity shows significant correlation with parameters such as temperature, pH value alkalinity, total hardness, calcium, total solids, total dissolved solids and
chemical oxygen demand chloride and iron concentration
of water. Conductivity in streams and rivers is affected
primarily by the geology of the area through which the
water flows. Streams that run through areas with granite
bedrock tend to have lower conductivity because granite
is composed of more inert materials that do not ionize
(dissolve into ionic components) when washed into the
water (Gupta and Paul 2010). Streams that run through
areas with clay soils tend to have higher conductivity
because of the presence of materials that ionize when
washed into the water. Ground water inflows can have the
same effects depending on the bedrock they flow through.
Discharges to streams can change the conductivity
depending on their make-up. A failing sewage system
would raise the conductivity because of the presence of
chloride, phosphate and nitrate; an oil spill would lower
the conductivity.
Conductivity
Theory and Practice http://www.analytical-chemistry.uoc.gr/files/items/6/618/agwgimometria_2.pdf
soil EC measurement dS/m
https://www.nrcs.usda.gov/Internet/FSE_DOCUMENTS/nrcs142p2_053280.pdf
Understanding
lake data. https://www.uwsp.edu/cnr-ap/weal/Documents/G3582.pdf. ***
The presence of chloride (Cl–) where it does not
occur naturally indicates possible water
pollution. Chloride does not affect plant and
algae growth and is not toxic to aquatic
organisms at most of the levels found in
Wisconsin. Chloride is not common in Wisconsin
soils, rocks or minerals, except in areas with
limestone deposits. Figure 7 shows the
geographic distribution of chloride in Wisconsin
lakes.
Sources of chloride include septic systems
(chloride values of 50 to 100 mg/l are common in
septic tank effluent), animal waste, potash
fertilizer (potash = potassium chloride), and
drainage from road-salting chemicals. Increases
in chloride, either seasonally or over time, can
mean that one or more of these sources is
affecting the lake.
An increase in chloride from human or animal
waste suggests that other nutrients are also
entering the lake. Higher chloride concentrations
from spring to fall may be the effect of lawn
fertilizer runoff or septic systems during heavy
use by summer residents. Higher values in
spring after the snow melts may signify runoff
from drainage basins or highways as a major
source of chloride. Since lakes vary in their
natural chloride content, it is important to have
background data or a long term database to
document changes.
http://aquaticcommons.org/5193/1/1984_52_davi_trea.pdf TREADING IN MORTIMER’S FOOTSTEPS: THE GEOCHEMICAL CYCLING
OF IRON AND MANGANESE IN ESTHWAITE WATER
The electrolytic conductivity of pure water equilibrated with atmospheric CO2 is typically
taken to be 1.05 µS/cm
https://www.nist.gov/system/files/documents/srm/260-142-2ndVersion.pdf
…Why is pH measured in the first place? A good case can be made that in pure water it is
unnecessary to monitor pH since a conductivity measurement is simpler and assures high
purity. For example, if the conductivity is less than 0.06 µS/cm then the pH must be
between 6.9 and 7.2—the extremes possible with strong acid and base contaminants,
respectively. This pH vs. conductivity relationship has been documented in graphic form
for strongly ionized acids and bases and for weakly ionized carbon dioxide and ammonia
typical of power plant samples.1,2,3
Measuring the pH of pure water is difficult because of inherently low
solution conductivity (between 0.056 and 10.0 microSiemens/cm) or
resistivity (between 18.2 and 10 megohm–cm at 25ºC). Several
problem areas can lead to gross measurement errors in this type of
application. Eliminating these potential interferences requires special
measurement considerations.
Why Do We Need to Measure Pure Water pH?
The measurement of pure water pH can be one of the quickest indicators of process contamination in
the production or distribution of pure water. The presence of gaseous contaminants such as air or
carbon dioxide will shift the pH of the pure water, indicating air or gas intrusion into the process line.
The exhaustion of resin beds used to prepare or polish pure water can introduce contaminants that will
cause a shift in pH. These resin beds are typically cation and/or anion exchange resins in a hydronium
ion form (cation exchange) or hydroxide ion form (anion exchange). While conductivity measurements
will clearly indicate an ionic leakage, pH measurement changes can be diagnostic as to which resin is
exhausted. If the pH increases, the cation resin bed is becoming exhausted; if the pH decreases, the
anion resin bed is becoming exhausted.
Boilers require pure water to reduce scaling and
 https://www.emerson.com/documents/automation/application-data-sheet-theory-application-of-conductivity-rosemount-en-68442.pdf
Open Access
Published: 08 June 2017
From Bacteria to Fish: Ecological Consequences of Seasonal Hypoxia in a Great Lakes Estuary ****
https://link.springer.com/article/10.1007/s10021-017-0160-x
https://wmich.edu/sites/default/files/attachments/u486/2015/Koretsky2012.pdf