
In a previous set of observations on Aug 20. 2020, I identified some elevated EC (electrical conductivity) values, circa 600 uS/cm in a stream originating south of Hammonds Plains Road, raising some concern that it could be a significant source of salt and possibly other pollutants entering Sandy Lake. However it had been very droughty and streamflows overall at that time were very low, so it was difficult to get some further idea of its possible contribution compared to other streams.
There were some significant rainfalls towards the end of September, recharging most streams. With the collaboration of Bruce Sarty, on Oct 2, 2020, EC (Electrical Conductivity) measurements were obtained at the sites shown in the map below.
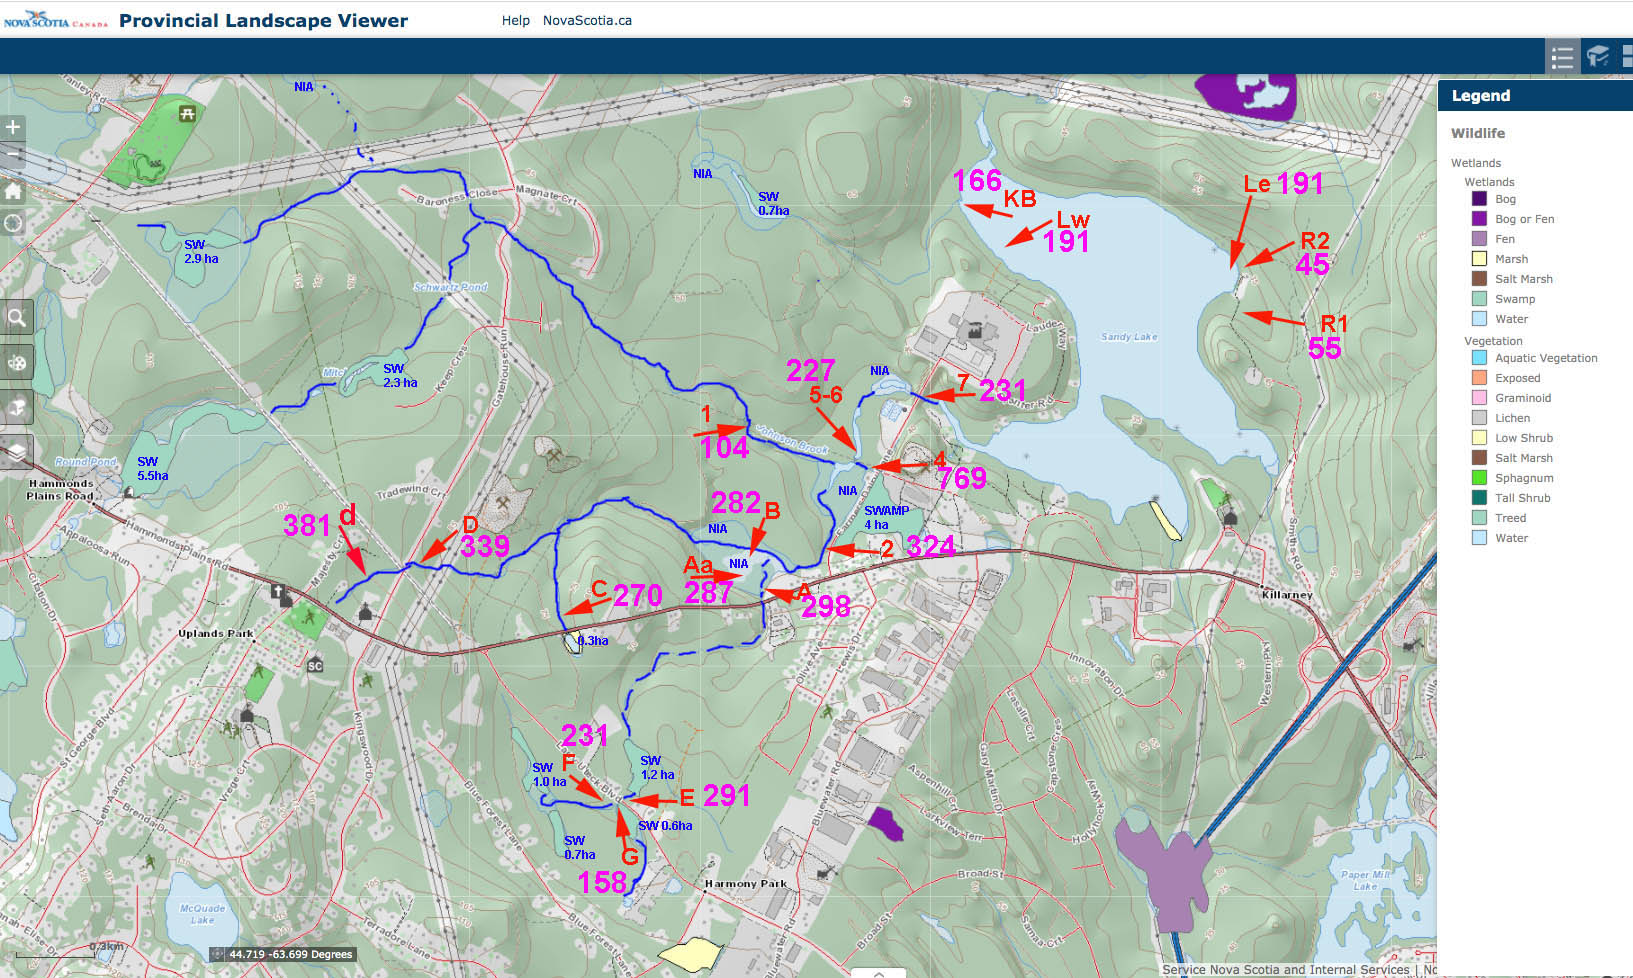
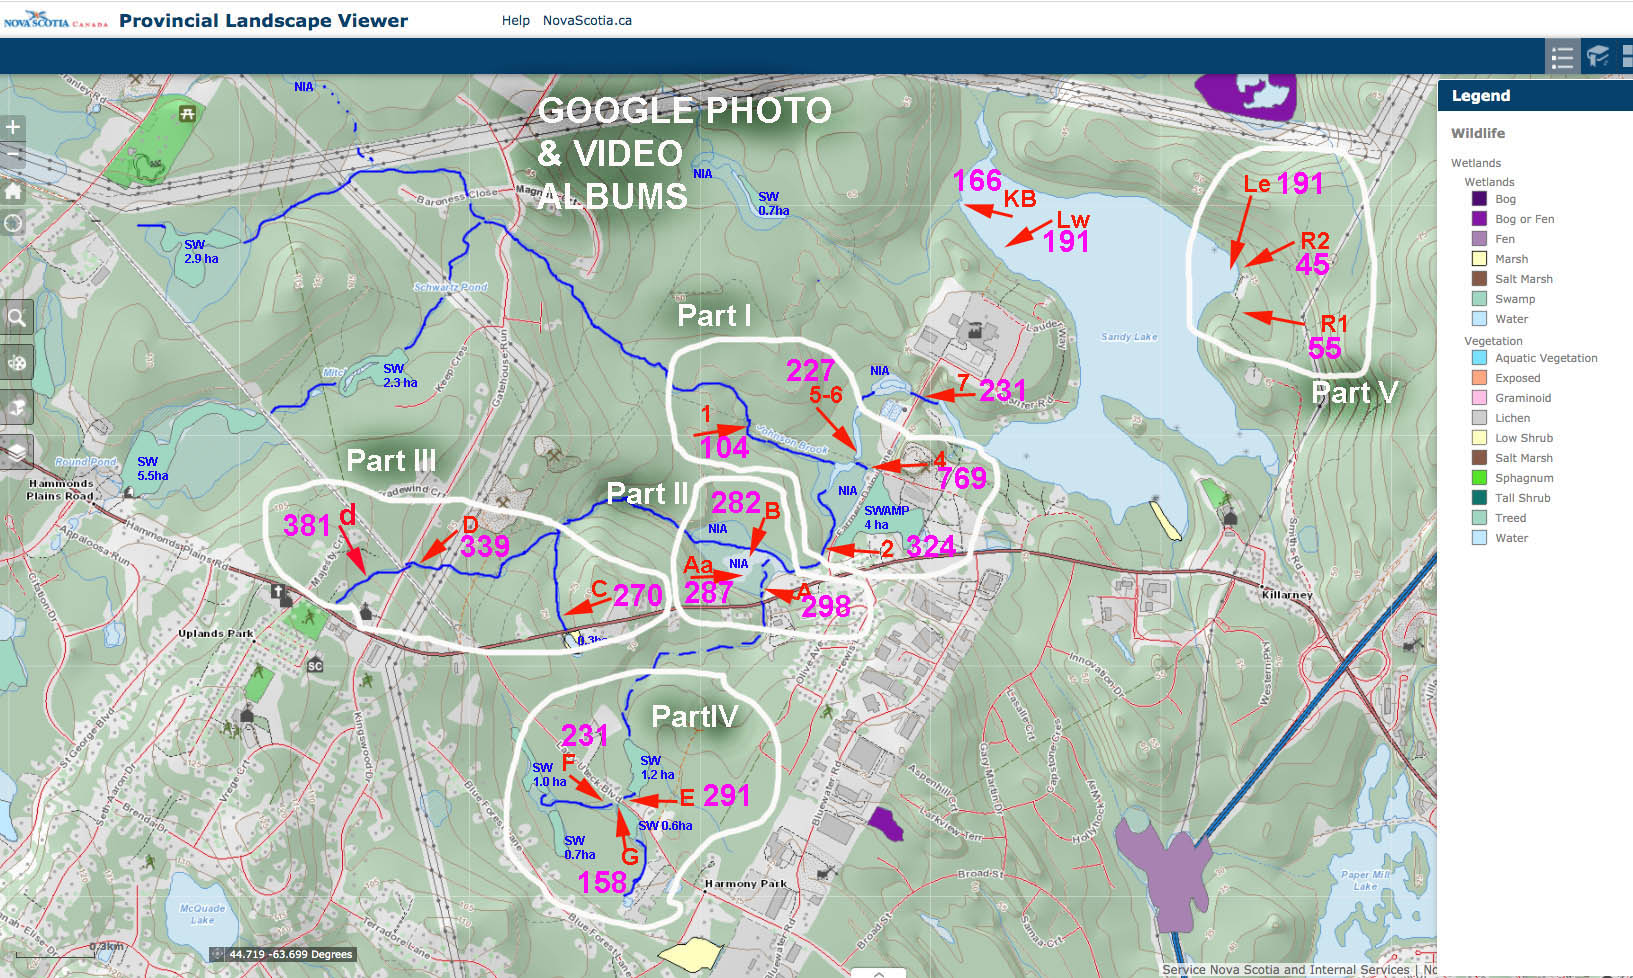
Map is from the Provincial Landscape Viewer (PLV). Streams converging at the southeast corner of the lake are highlighted (dark blue). Numbers in purple are the Electrical Conductivity values (uS/cm) on Oct 2, 2020. SW= swamp as identified on the PLV. NIA=”No Information Available” as cited on the PLV. Point d is a few meters from the outfall at the Uplands Park Waste Water Treatment Facility
I had hoped that by getting EC values on the two major watercourses that converge on Site 2, one extending back to Site d just below the Uplands Park Waste Water Treatment Facility, and one draining areas within the Sandy Lake Watershed below Hammonds Plains Road, I could make an estimate of the relative contributions of those two watercourses to the flow at Site 2 by a simple mass balance for the EC (salt) values; likewise to estimate the relative contributions of the flow from Site 2 and from Site 1 (Bob’s Brook) into the lake (Site 7) via Site 5-6.
There are many possible issues with such calculations, one for example is that the EC values for the converging streams should be taken as close as possible to the point at which they converge, likewise that EC value after convergence is close to the point of convergence; then the values for the converging streams are the product of all flows from the respective watersheds of those streams. But the concept is useful. For example, based on the EC values at Site A (298 uS/cm) and Site B (282 uS/cm), we would expect the value at site 2 to be intermediate between those two values, but it’s actually greater (325 uS/cm). That suggests there are surface &/or groundwater flows of higher EC water into the main watercourse between the point where flows at A & B converge, and Site 2. That’s a settled area, so the increase in EC is not surprising and points to further local sources of salts and possibly other pollutants into waters flowing into Sandy Lake.
The EC values of the stream going from Site d to Site D to Site B (“Stream dDB”) decline progresssively, suggesting a point source of salts at Site d – i.e. the water flowing from the Uplands Park Waste Water Treatment Facility – that becomes diluted as the stream moves through undeveloped landscape. Then, as noted above, as it moves from the convergence to Site 2 it goes by the edge of settled landscape and the EC content increases, illustrating a simple relationship between settled areas and salt inputs.
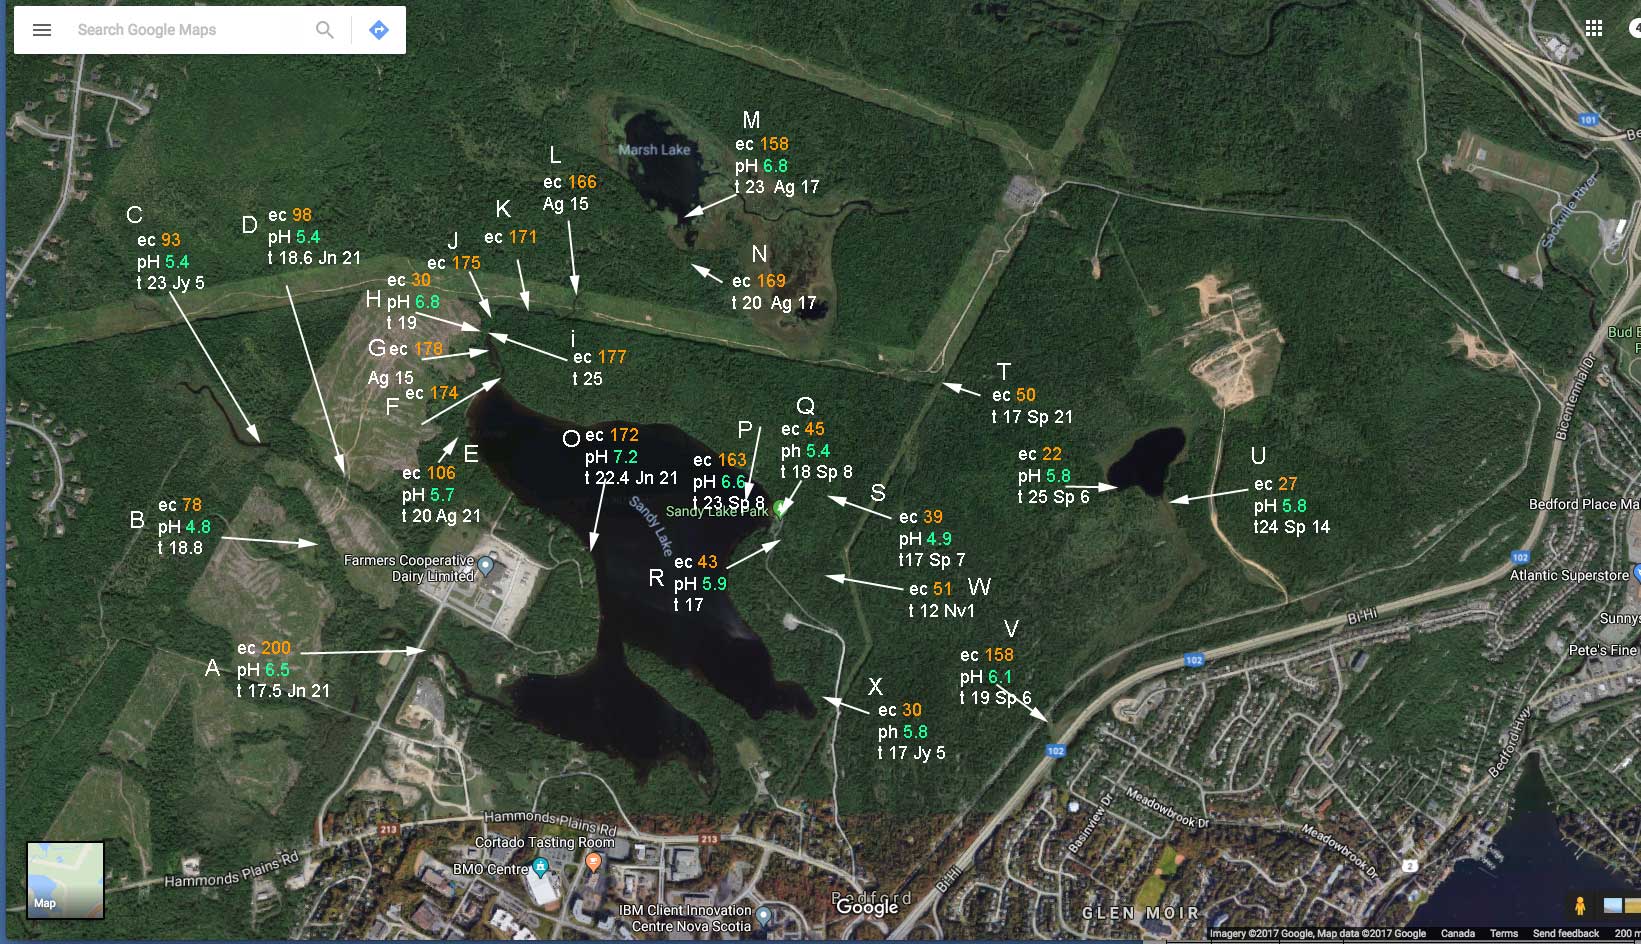
That point is illustrated on a larger scale by comparing the EC values of streams to the west and southwest of Sandy Lake which drain settled areas (EC values 104 to 769, most are above 200) with the values of two stream on the east side which drain unsettled, ecologically intact landscape (EC values 55 and 45 – see more values for intact landscapes on this map; description here).
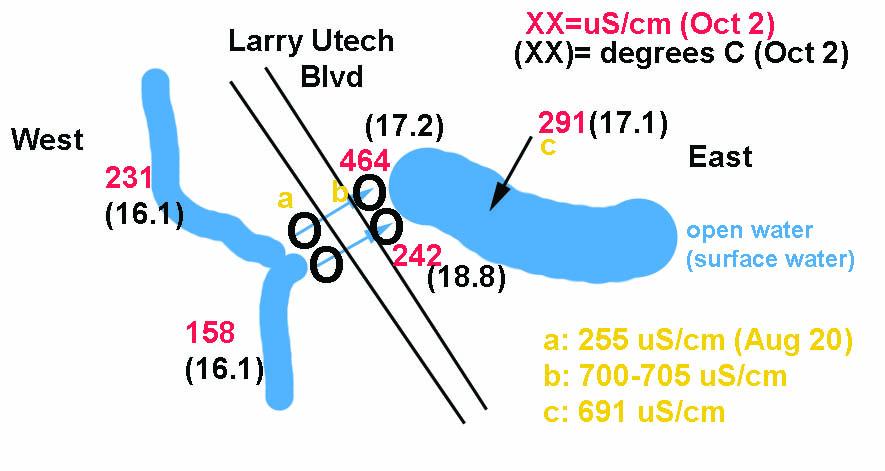
| THE WATER-CROSSING-UNDER-THE-ROAD ENIGMA On both Aug 20, 2020 and Oct 2, 2020, water coming out of culverts of the east side of Larry Utech Blvd had a higher EC than in water entering the culverts or culvert (only one was running on Aug 20) on the west side of the road. I don’t have an explanation.*Update May 17, 2026: Concrete could have been the source of the elevated EC , see Wright, I., Davies, P., Findlay, S., & Jonasson, O. (2011). A new type of water pollution: concrete drainage infrastructure and geochemical contamination of urban waters. Marine and Freshwater Research, 62(12), 1355–1361. https://doi.org/10.1071/MF10296
|
SITE DESCRIPTIONS
Videos and GPS tagged photos of Wetlands and Riparian areas to W & SW of Sandy Lake, Oct 2, 2020 posted in Google Photo Albums. These photos provide a lot of detail about ‘what’s there’. The photos are GPS tagged, so they can serve as baseline records of ‘what was there’ in 2020. There are five albums (PART I, II, III, IV, V):
|
PART I – Johnson’s (Bob’s) Brook & Murphy’s Pit area PART II – Confluence of the “HPR South Watercourse” & the “UPWWTF Watercourse” within a Big Wetland/Riparian area (NIA1) PART III – Uplands Park Waste Water Treatment Facility and associated stream; small adjacent watercourse beginning near HPR PART IV – Junction of two of the tree major source streams for the HPR South Watercourse, on Larry Utech Blvd. Also View South of HPR 20Aug2020 and the associated Photo&Video Album to view info on a significant wetland and riparian corridor in the HPR South Watercourse. PART V – Two streams draining intact landscapes on the east side of Sandy Lake in the vicinity of Sandy Lake Beach Park, were sampled to compare with values for streams in disturbed landscapes in Parts I to IV. (Earlier data for both sides of the lake are available here.) |
USING THE GOOGLE ALBUMS
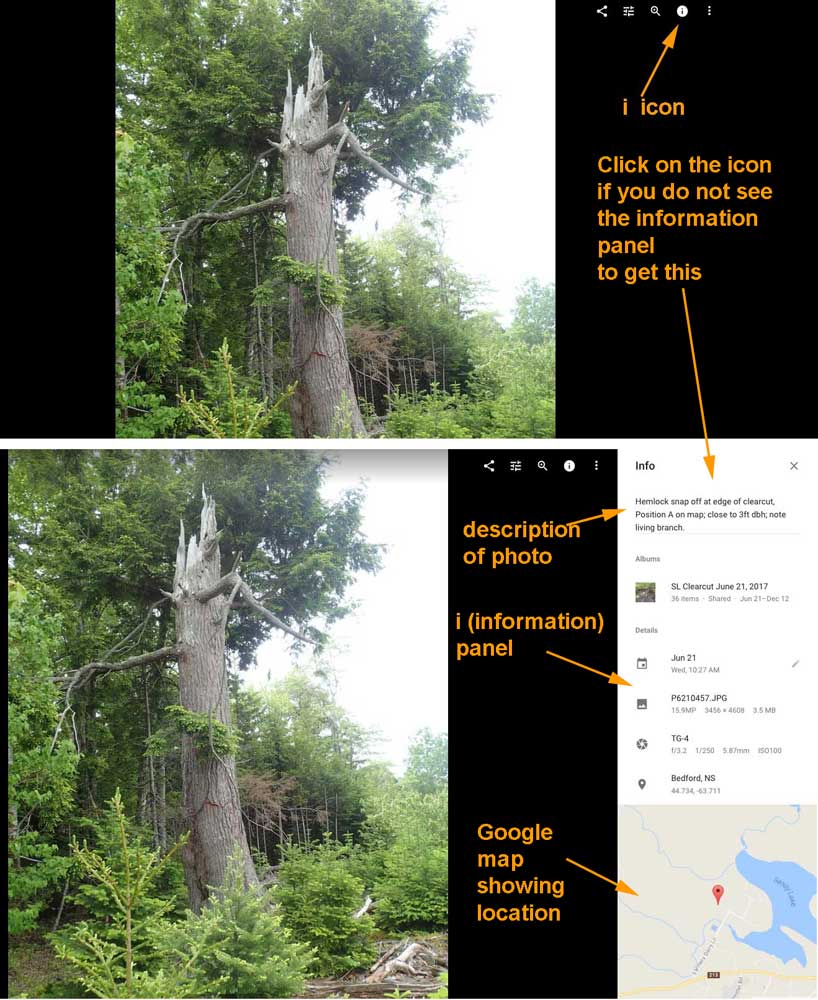
These Google Photos Album provide GPS tagged photos and ‘working videos’ with observational notes. You can start at the beginning of an album and go through it quite quickly, pausing as you might wish, e.g. to enlarge a photo for closer examination or look at Satellite view on a Google Map. |
MAP LOCATIONS SHOWING LOCATIONS FOR EACH PART
There are five Albums
MORE MAPS
Click on images for larger versions.
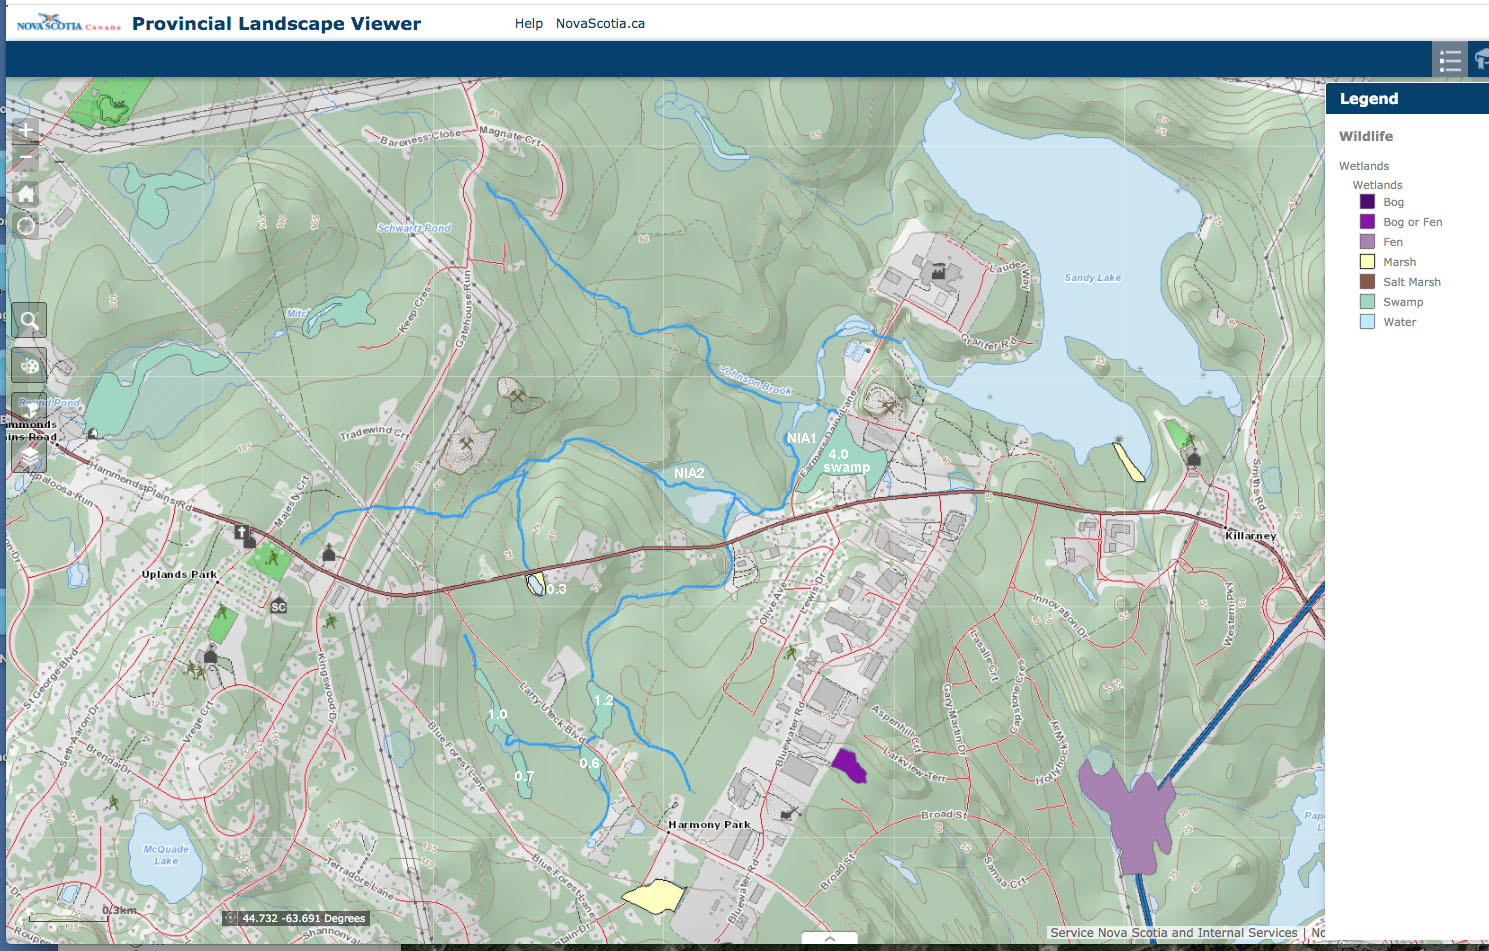
From the Provincial Landscape Viewer. Areas of wetlands are in hectares, taken from the PLV; stream highlighting inserted. NIA: “No Information Available” – These are significant wetlands beside open watercourses in NIA1 and NIA2. They are not identified as “wetlands” in the AECOM 2014 Report Figure 1, but do appear as in the Figure 7 Constraints Map as “Watercourses, Wetlands and Riparian Buffers”
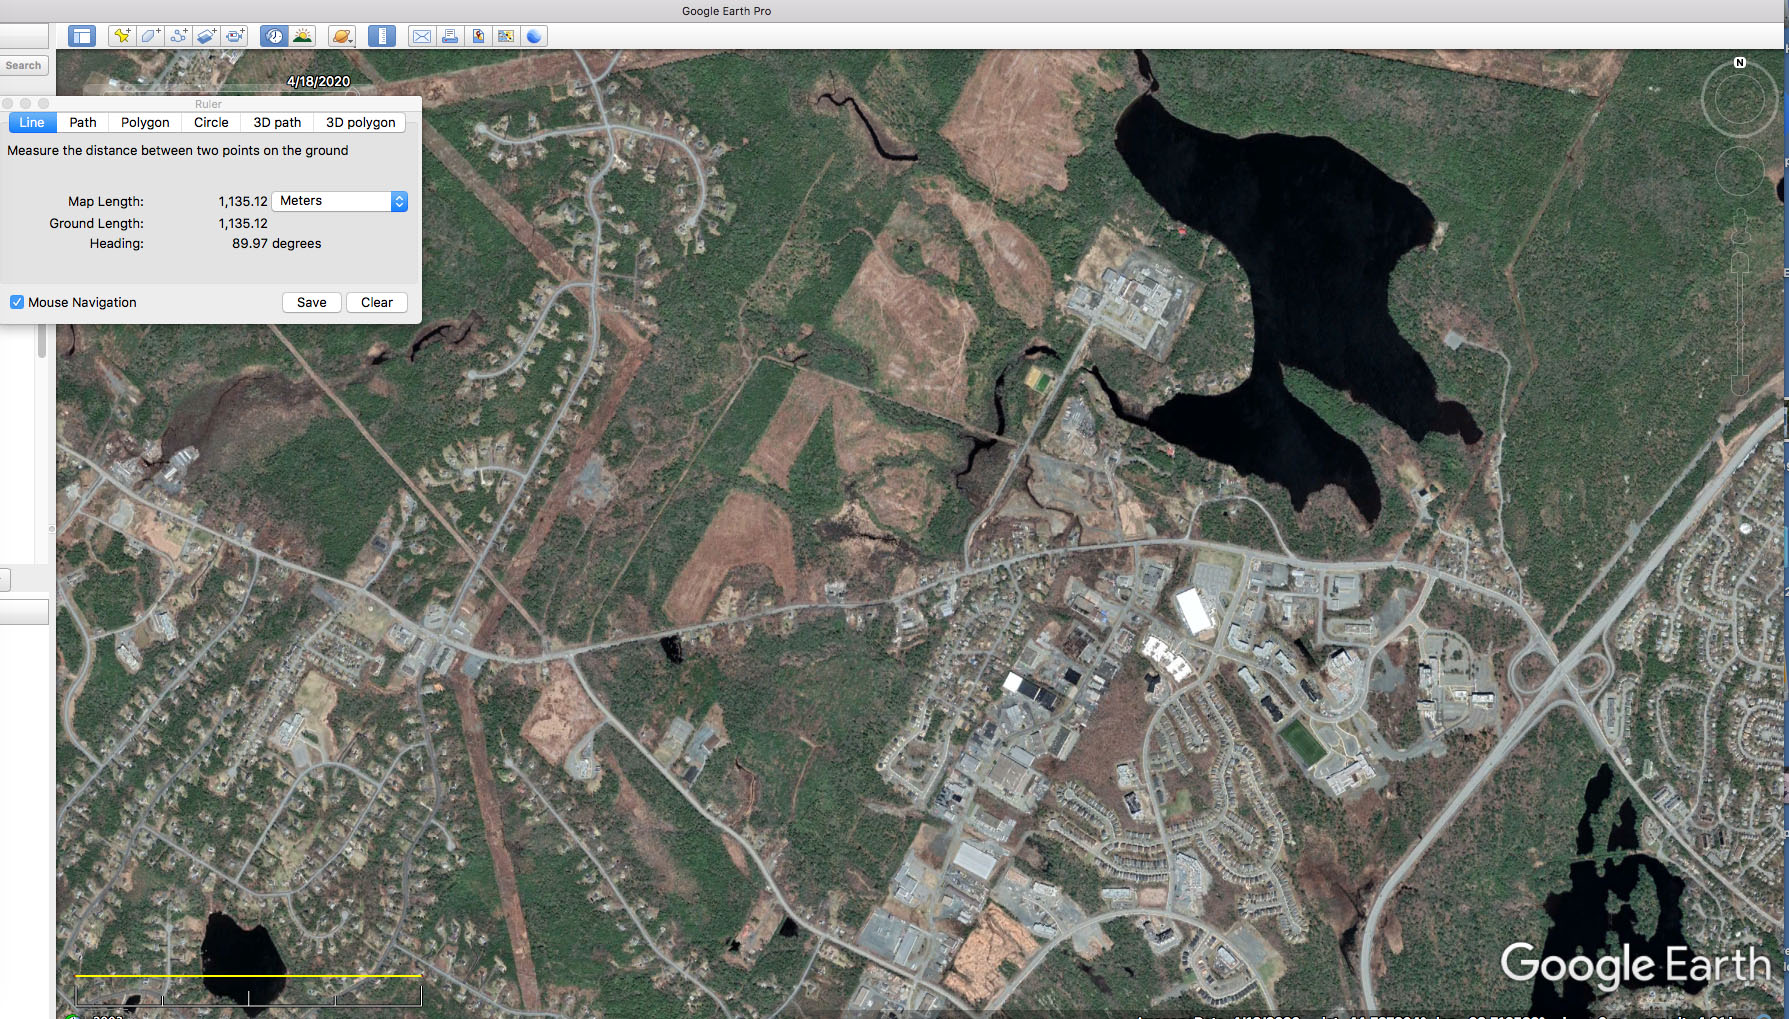
Same area as the above in a recent Google Earth Image
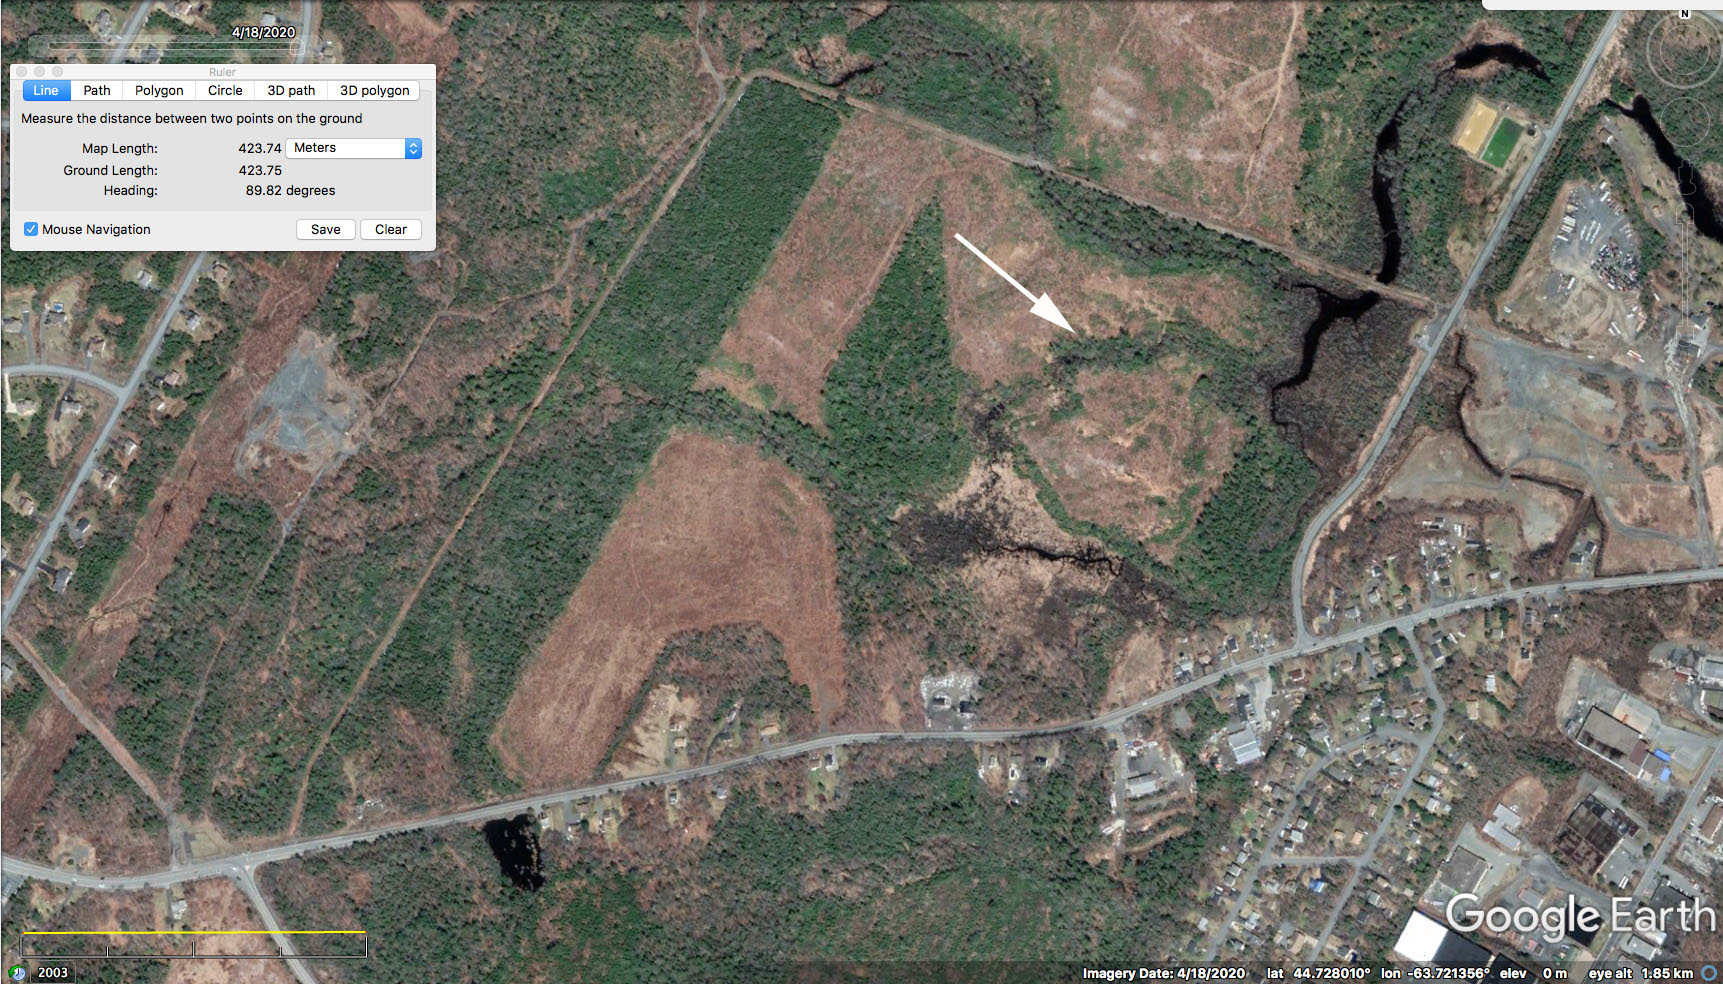
Closer up in area of NIA1 and NAI2. The arrow points to a watercourse not identified in the PLV (Provincial Landscape Viewer) Map. It is identified as a Riparian area in AECOM 2014 Report Fig. 7.