
PAGE BEING MODIFIED…. most contents to be placed on other pages…. I am deleting content as I transfer it.
dp Jan9, 2021
I have estimated that two-thirds or more of the water entering Sandy Lake is carried by the watercourse entering the lake at its southwest corner. It is fed by streams that with their tributaries reach out to the extremities of the watershed to the west and southwest of Sandy Lake.
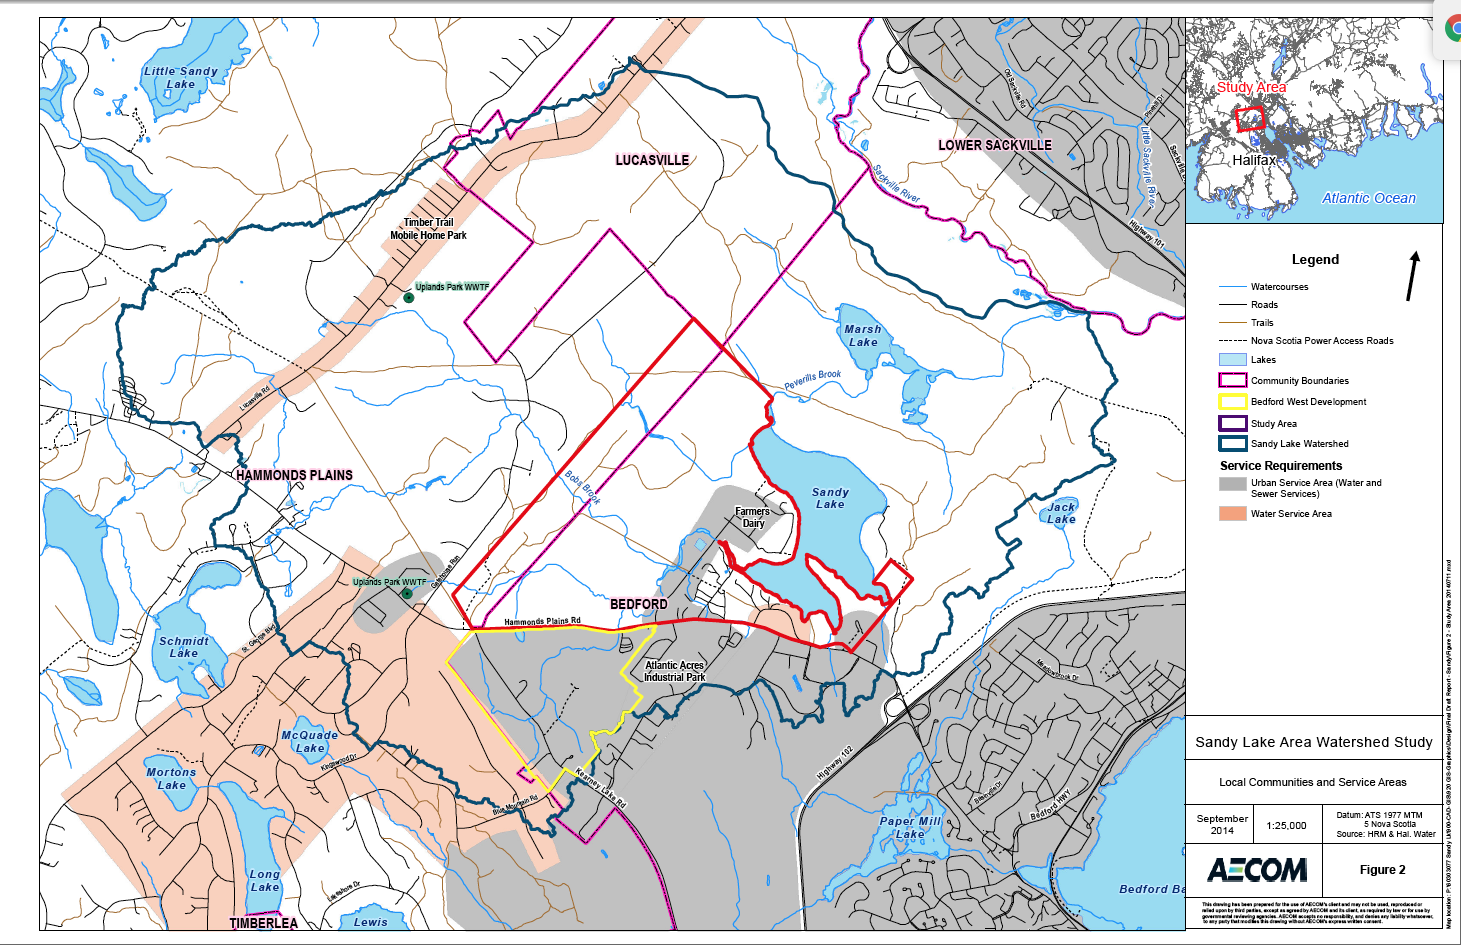
AECOM 2014 Fig 2 Local Communities and Service Areas. Screen capture image, see AECOM Report for better image. The map also shows watershed boundaries, watercourses, roads. The area below Hammonds Plains Road enclosed in a yellow polygon is the Bedford West Development. The area above HPR enclosed in the red polygon is the Proposed Sandy Lake West Development . Click on image for a larger version.
WHAT IS THE “AECOM REPORT”?
The full title:
Halifax Regional Municipality Sandy Lake Watershed Study Final Report
Prepared by AECOM Canada Ltd., submitted August 25, 2014. 64 pages + Appendices (66 pages).“This body of work represents our current understanding of the environmental conditions in the watershed with a focus on lake water quality. The application of a phosphorus load model (Lake Capacity Model) provides a numerical narrative of how development may impact water quality. We identify several methods that can be utilized to mitigate water quality impacts.” Regardless of many issues with the phosphorus model, the AECOM Report provides a valuable compilation of information about Sandy Lake including many maps. The report is available here (from the Sandy Lake Conservation Association). Except for a few samples of lake water, the AECOM Report is entirely a “desktop study” (as requested by HRM).
This landscape is currently partially developed. More development has been approved, notably for the Bedford West Development south of Hammonds Plains Road; and a large area above HPR on the west side of Sandy Lake has been “proposed for eventual residential, commercial and industrial development” (AECOM 2014) – see Map above. I refer to this latter area as the “Proposed Sandy Lake West Development”.
These two development areas enclose major portions, and all of the lower portions, of streams feeding the watercourse that enters Sandy Lake and its southwest corner.
MATERIALS DELETED, now at http://versicolor.ca/sandylakebedford/streams-wetlands/wetlands/wetlands-sw-of-sandy-lake/
DOES IT MATTER?
Before any development actually occurs, on-site observations would have to be conducted and would hopefully reveal the deficiencies of the desktop studies, and precautions taken accordingly and as required legally to protect watercourses and wetlands. However, discussions and decisions made up to the stage that result in a development being approved are too often based on desktop studies with very little on-the-ground observation to verify or not that the assumptions and interpretations are valid. And then it is too late or very difficult to backtrack and reverse or re-do the approval process.
Would it make a difference in this case? Would the conclusions of the AECOM report be different if they had been required by HRM to do more on-the-ground observations? (Such observations were limited to a few samples of lake water). It’s definitely possible. And AECOM was explicit on this score. The third page in the report is a Statement of Qualifications and Limitations, standard legalese stuff. More relevant, is this statement on page iii of the Executive Summary:
“The predictions from the phosphorus load model are consistent with observations of urbanization in other watersheds. However, the degree of influence of urbanization on water quality in Sandy Lake can only be approximated using the phosphorus load model because of limitations arising from assumptions and uncertainty in the application of the model. Therefore a robust water quality monitoring plan is proposed for the Sandy Lake watershed to provide a further assessment of current conditions and to evaluate the impacts of development on the water quality.”
Section 9 (p 42) in the AECOM Report provides specific recommendations for robust Water Quality Monitoring. The report was submitted in 2014. In 2020, such monitoring has still not been initiated, and, I am told, a request for Secondary Planning in the study area of the AECOM report was submitted to HRM in the summer of 2020. So we could be proceeding to secondary planning without any validation of the AECOM model as advised by AECOM.
POSSIBLE SIGNIFICANCE OF THE WETLANDS ON LAKE WATER QUALITY
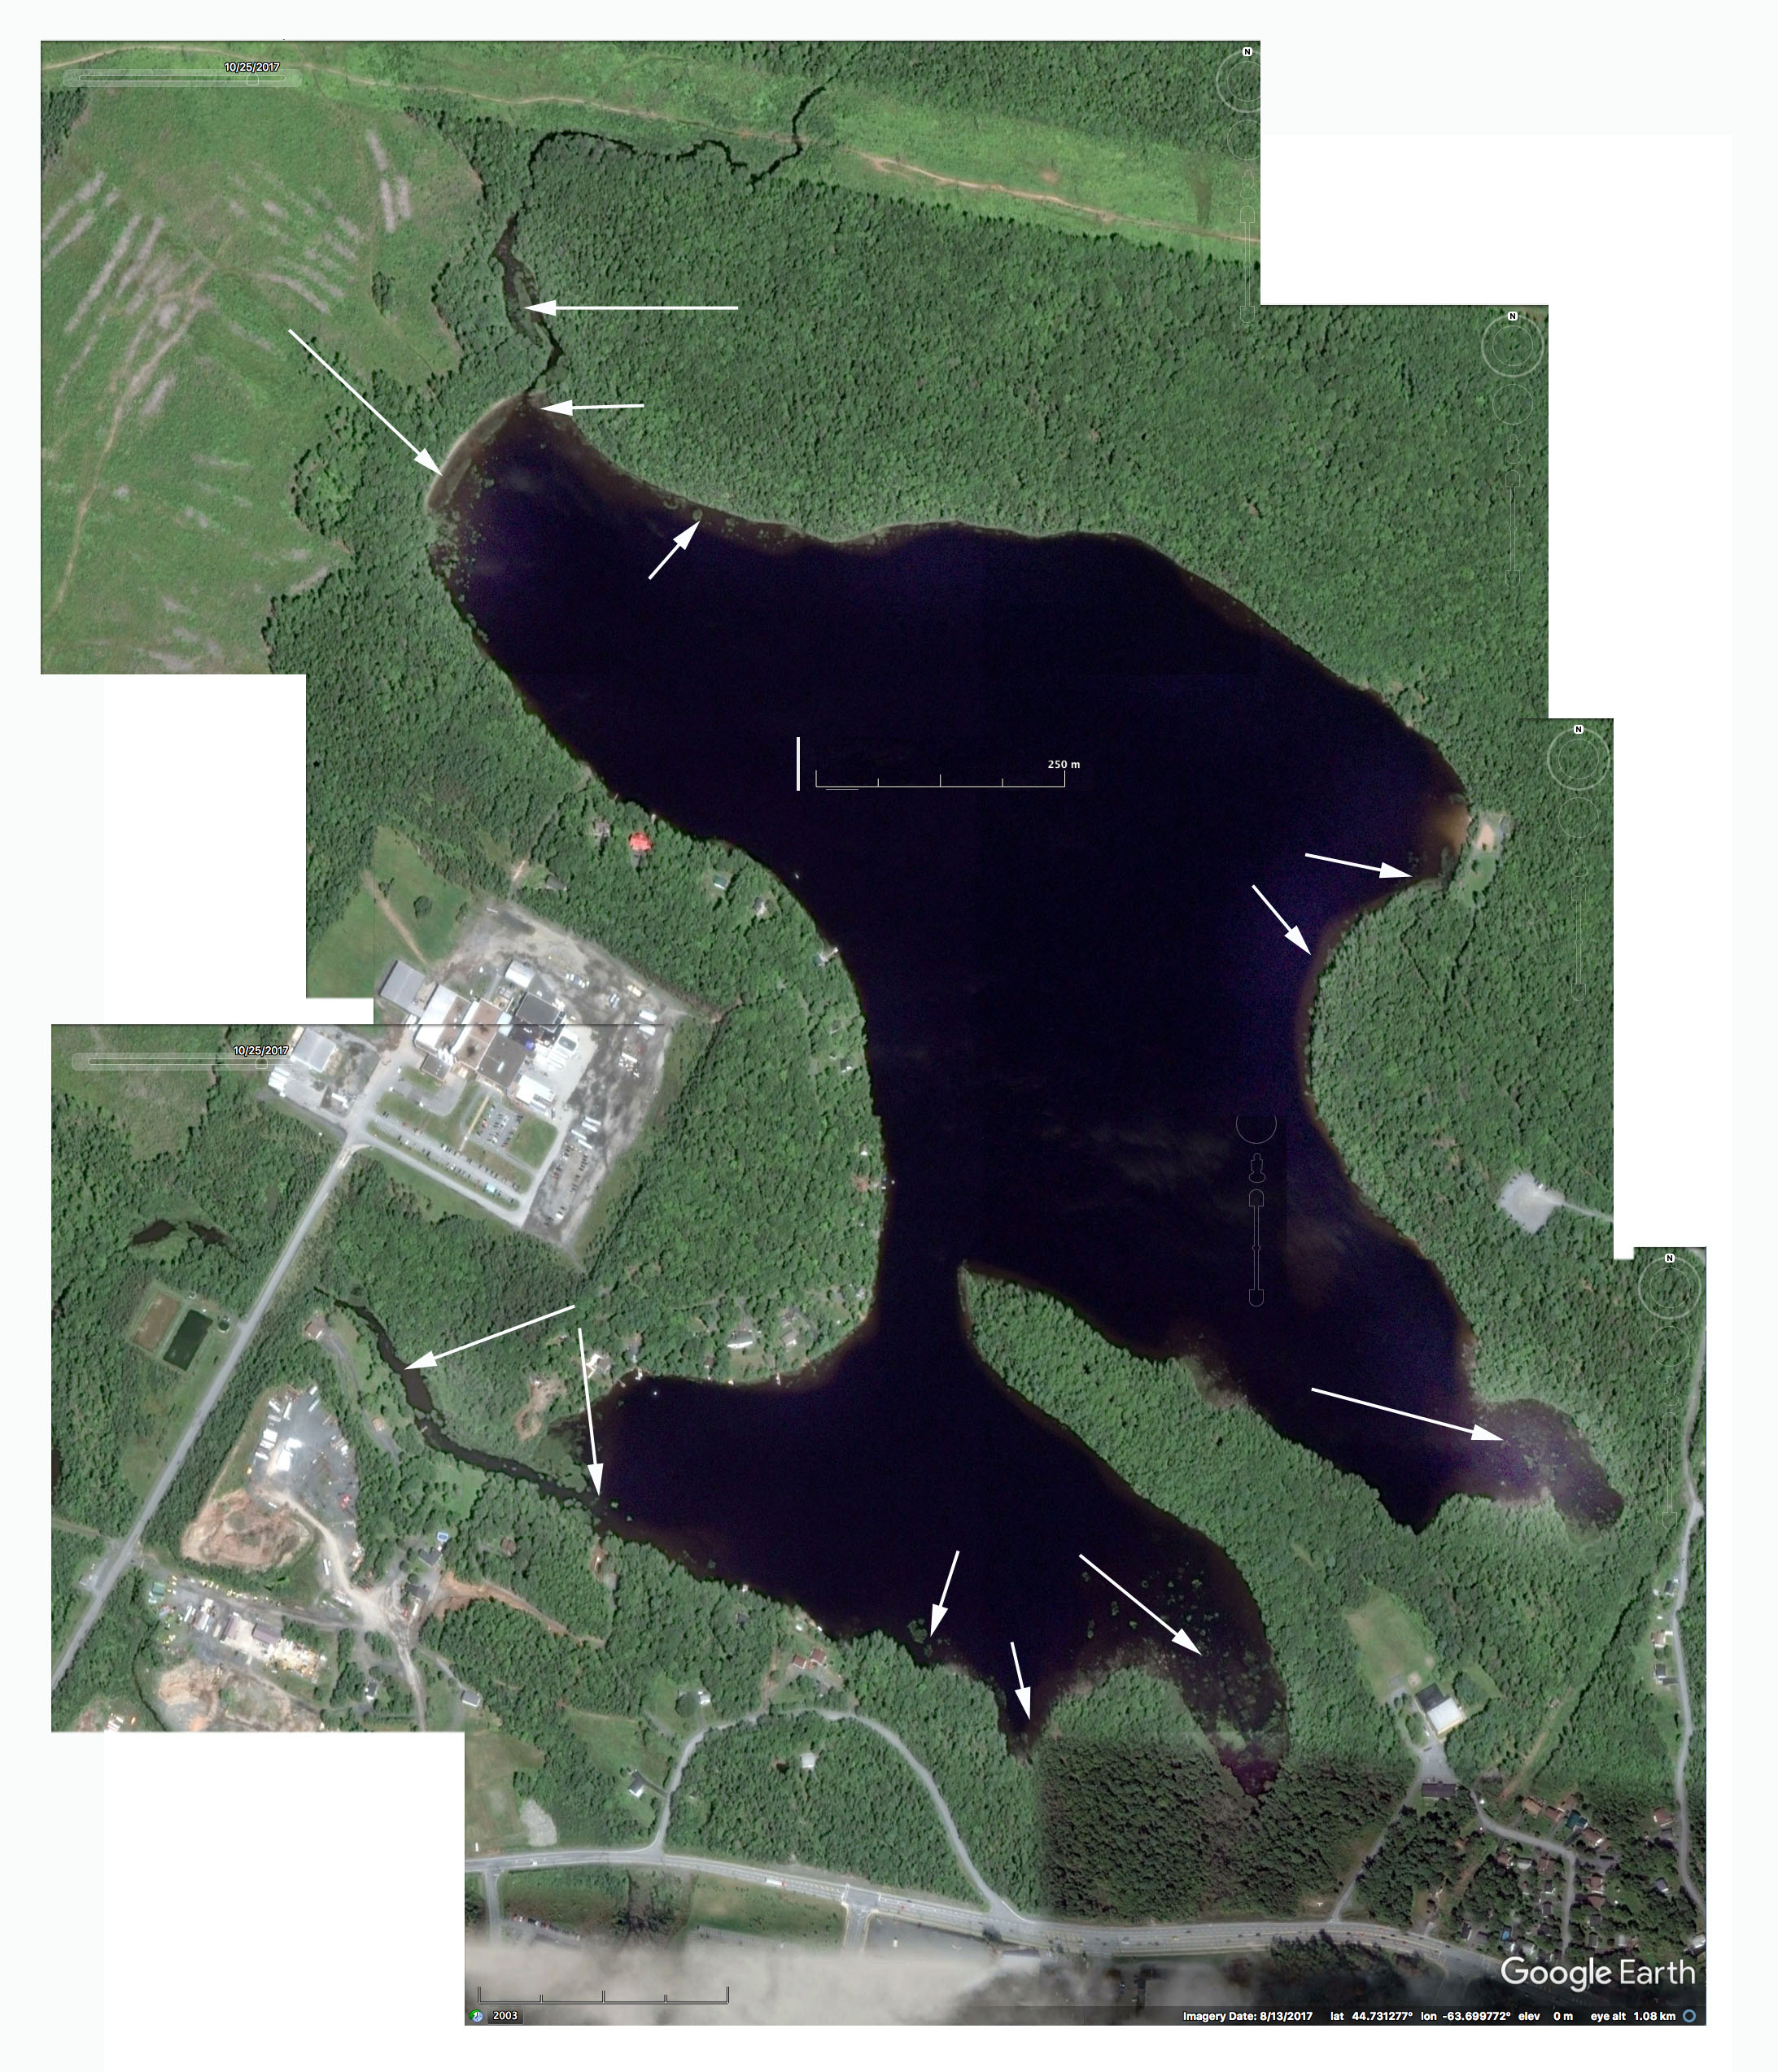
Areas of substantive fringing marsh on Sandy Lake viewable on Google Earth; streams enter the lake in these areas; or leave the lake (Peverill’s Brook at the extreme north of the lake). More info here.
Click on image for larger version
Besides NIA 1,2 and 3, there are significant lacustrine wetlands at the margins of Sandy Lake that are not recognized on the PLV or in the AECOM Report, notably at the southwest corner of the lake where Johnson’s Brook enters, in two bays at the southeast, at the NW of the lake where NW Brook (aka Karen’s Brook) enters, and at the entrance to Peverills Brook at the extreme north of the lake from whence water flows to Marsh Lake and then on to the Sackville River.
Wetlands of these types are known to remove significant amounts of phosphorous from waters flowing over them, although not consistently, and they may even be a source of phosphorus – on the ground observations of changes in phosphorus levels as waters move through wetlands are required to determine what particular wetlands are doing.
It’s important to make such determinations because many studies in temperate lakes have documented a relationship between Total Phosphorus and the trophic status status of a lake. Basically, the higher the Total Phosphorus, the more likely it is that a lake will go ‘skunky’ with algal blooms, loss of fish and other species and the like. The Lakeshore Capacity Model (LCM) applied in the AECOM 2014 Report attempts to predict the impacts of development on Total Phosphorus. To calibrate the model, they use data on existing conditions to test/calibrate the model. AECOM found that their model overestimated the existing Total Phosphorus concentration (12 ug/L) by a big factor – the estimated value was 20 μg/L.
SO WHY DOUBT THE CONCLUSIONS?
(i) As cited by AECOM itself, modelled phosphorus concentrations differed by far more than 20% of the measured concentrations, indicating the model is not valid.
(ii) The modelled changes in land use with development involve development occurring directly over the large NIA1 wetland and close to NIA2 (see AECOM Figs 13 and 14) and also to forested riparian areas (which would be protected by 20 m buffers) but the possible role of development in these areas on wetland function including possible removal of phosphorus are not considered – the model is not designed to do that, but nor are such possible impacts discussed.
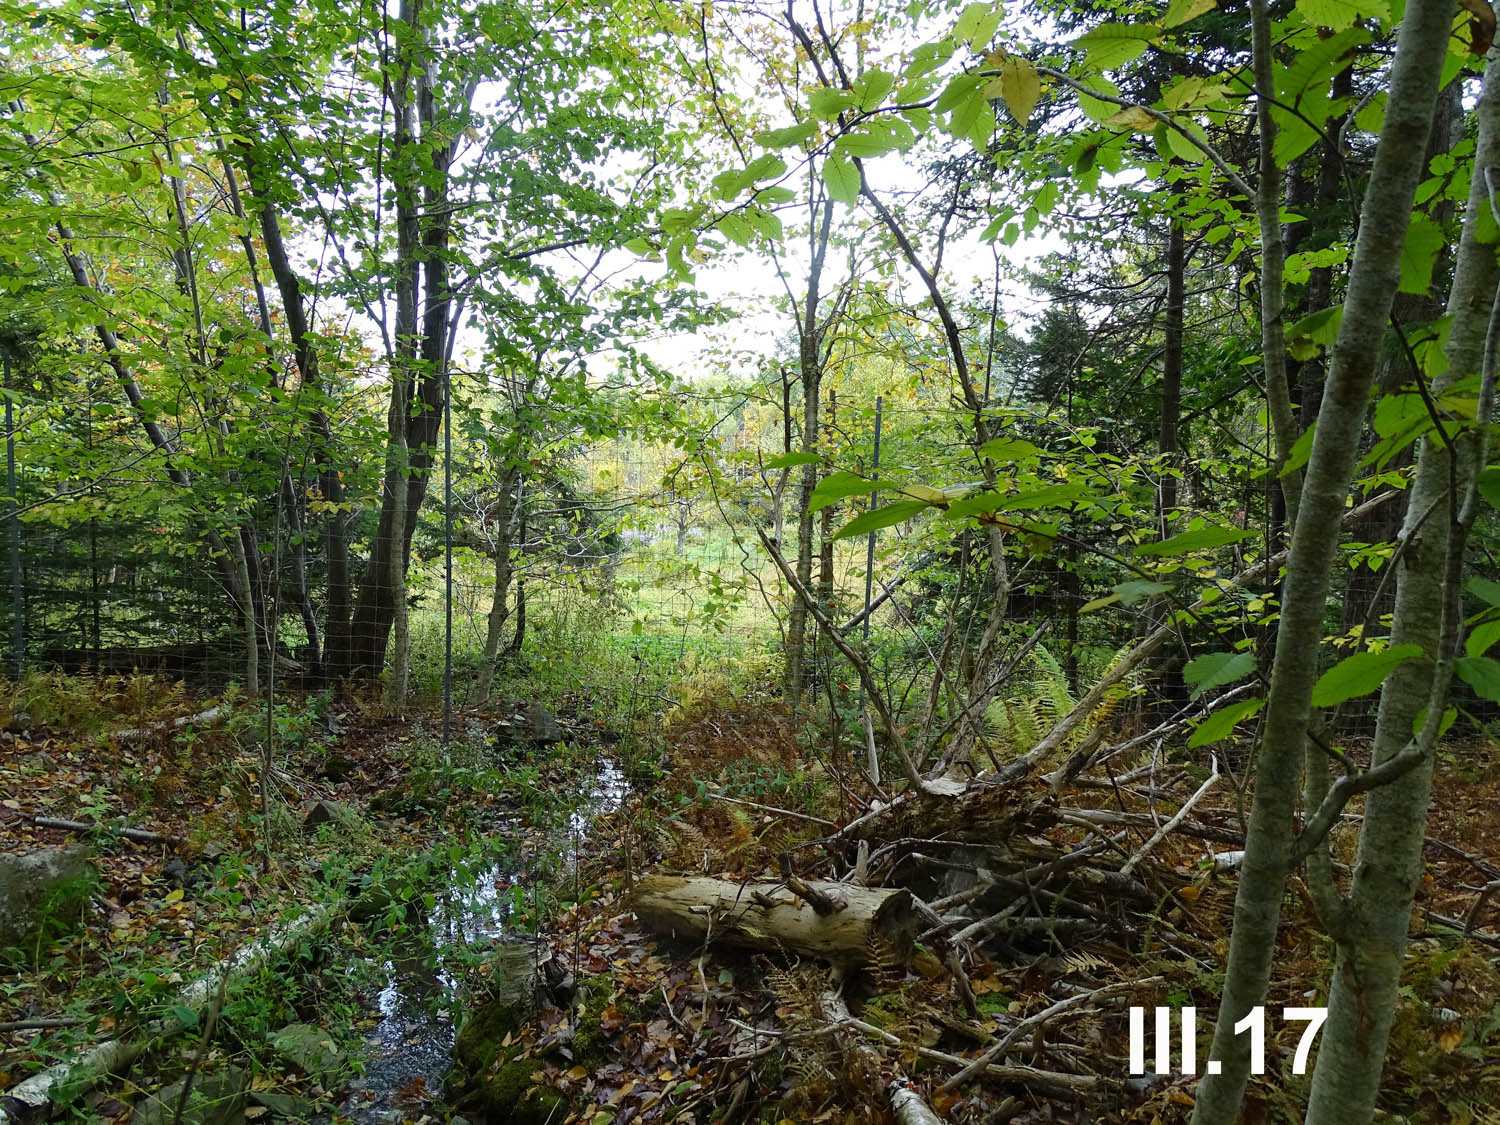
Uplands Park Wastewater Treatment Facility – here the effluent enters an open, fenced wetland. View more pics in a Google Photo Album
(iii) Another reason to seriously question the validity of the model is the significance attached to removing the Uplands Park Waste Water Treatment Facility (UPWWTF). AECOM based its estimate of the phosphorus contribution to Sandy Lake from the UPWWTF on samples collected by Halifax Water “from a sampling port within the plant (at the end of the treatment process) just prior to entering the discharge pipe.” They note that ” The treated effluent is discharged to a wetland and creek which eventually empties into Sandy Lake approximately 3.5 km from the discharge point” but assume, apparently, that the wetland is completely ineffective in removing any of the phosphorous. There is no discussion of the possibility that the tertiary treatment in this system – the wetland component (a fenced, constructed or partially constructed wetland immediately adjacent to the treatment plant) actually does what it was designed to do – remove nutrients, especially phosphorus! Effectively it is another “missing wetland” in addition to the NIA and lacustrine wetlands.
It’s possible that actual on-the-ground sampling of Total Phosphorus along watercourses would show that the wetlands do not in fact affect phosphorus levels. But it’s also equally possible that they do; and that the conclusions drawn from a refined model that is based on water quality monitoring over time (as advised by AECOM) and spatially to determine the significance of wetlands and riparian areas in removing P would be quite different from those in the AECOM 2014 Report.
(iv) Finally, the most fundamental flaw in the AECOM assumptions and hence in their recommendations in my view is this:
The 2017 observations indicated another issue. The Electrical Conductivity is higher in the deep water than at the surface, and the surface value had increased almost 5-fold since 1971. This can be attributed to increased inputs of road salt as more of the watershed became developed. The higher values in deeper water are a concern because if that difference continues to grow (it’s a pretty safe prediction that it will as more of the watershed is settled), it could make the deeper waters heavy enough that they don’t “turn over” and get re-aerated two times a year – as is normal for this type of lake. Then the lake would deteriorate very quickly. More about that issue here.
As pointed out in a critique of the AECOM Report when it came out, keeping the deep water oxygen levels up is even more critical with global warming because the solubility of oxygen in water decreases with increasing temperature.
So, given the current state of the lake, it is very clear that the Total Phosphorus Water Quality Objective for Sandy Lake should have been set below the current (2014) value of 12 ug/L, not 50% above it.
It’s hard to interpret AECON selecting the latter as anything other than a manipulation (deliberate or not) to make the results of the modelling fit the objective of developing the landscape rather than an attempt to objectively evaluate the impacts of development on lake water quality.

Fishers at Sandy Beach
If development of the area goes ahead without a more objective evaluation of its impacts on Sandy Lake – and allowing the possibility of concluding that only very restricted or no development is possible without seriously harming the lake – then we will likely lose an incredibly valuable resource for both wild and human residents and visitors of the area.
A Postscript
The AECOM Report is not the only one to make perhaps unwarranted assumptions. The Sackville Rivers Floodplains Study (2017) involved an assessment of the Sackville River and the Little Sackville River, and their watersheds, to produce updated floodplain maps. It’s a highly professional, well done and well-received study but, at least in my view, with one significant omission: The impact of possible new development on lands which drain into Sandy Lake was not modelled as part of the study (it was for other areas of anticipated future development).
I attended a public presentation of the Sackville Rivers Floodplains Study on Sep 22, 2018 and asked one of the consultants involved why the Sandy Lake Sub-Watershed wasn’t included in the modelling as it is the largest or 2nd largest sub-watershed in the Sackville River watershed, depending on how the watercourses are aggregated.
He said they they were following instructions from HRM, and those did not include modelling of the Sandy Lake watershed. I asked if he knew why. He said they must have assumed there would be no significant new development in the watershed over the next 100 years which was the timeframe of the modelling.
I guess if that assumption were made in relation to the AECOM 2014 Report, it wouldn’t have been conducted.