
Page Updated Sep 8, 2024.
NAVIGATION
www.versicolor.ca
![]() /sandylakebedford Home Page for Sandy Lake & Environs (Bedford, NS)
/sandylakebedford Home Page for Sandy Lake & Environs (Bedford, NS)
![]() /Surface Waters
/Surface Waters
![]() /Sandy Lake A Draft report On the State of Sandy Lake…Feb 21, 2021
/Sandy Lake A Draft report On the State of Sandy Lake…Feb 21, 2021
![]() /Limnological Profiles
/Limnological Profiles
Subpages:
– 2023 Limnological Profiles, effects of episodic precipitation and occurrence of a Metalimnetic Oxygen Minimum (This Page)
– 2024 Limnological Profiles – return to historic trends
– –Addendum 1: Trends in Conductivity/Salt Content
– – Addendum 2: On Wetlands
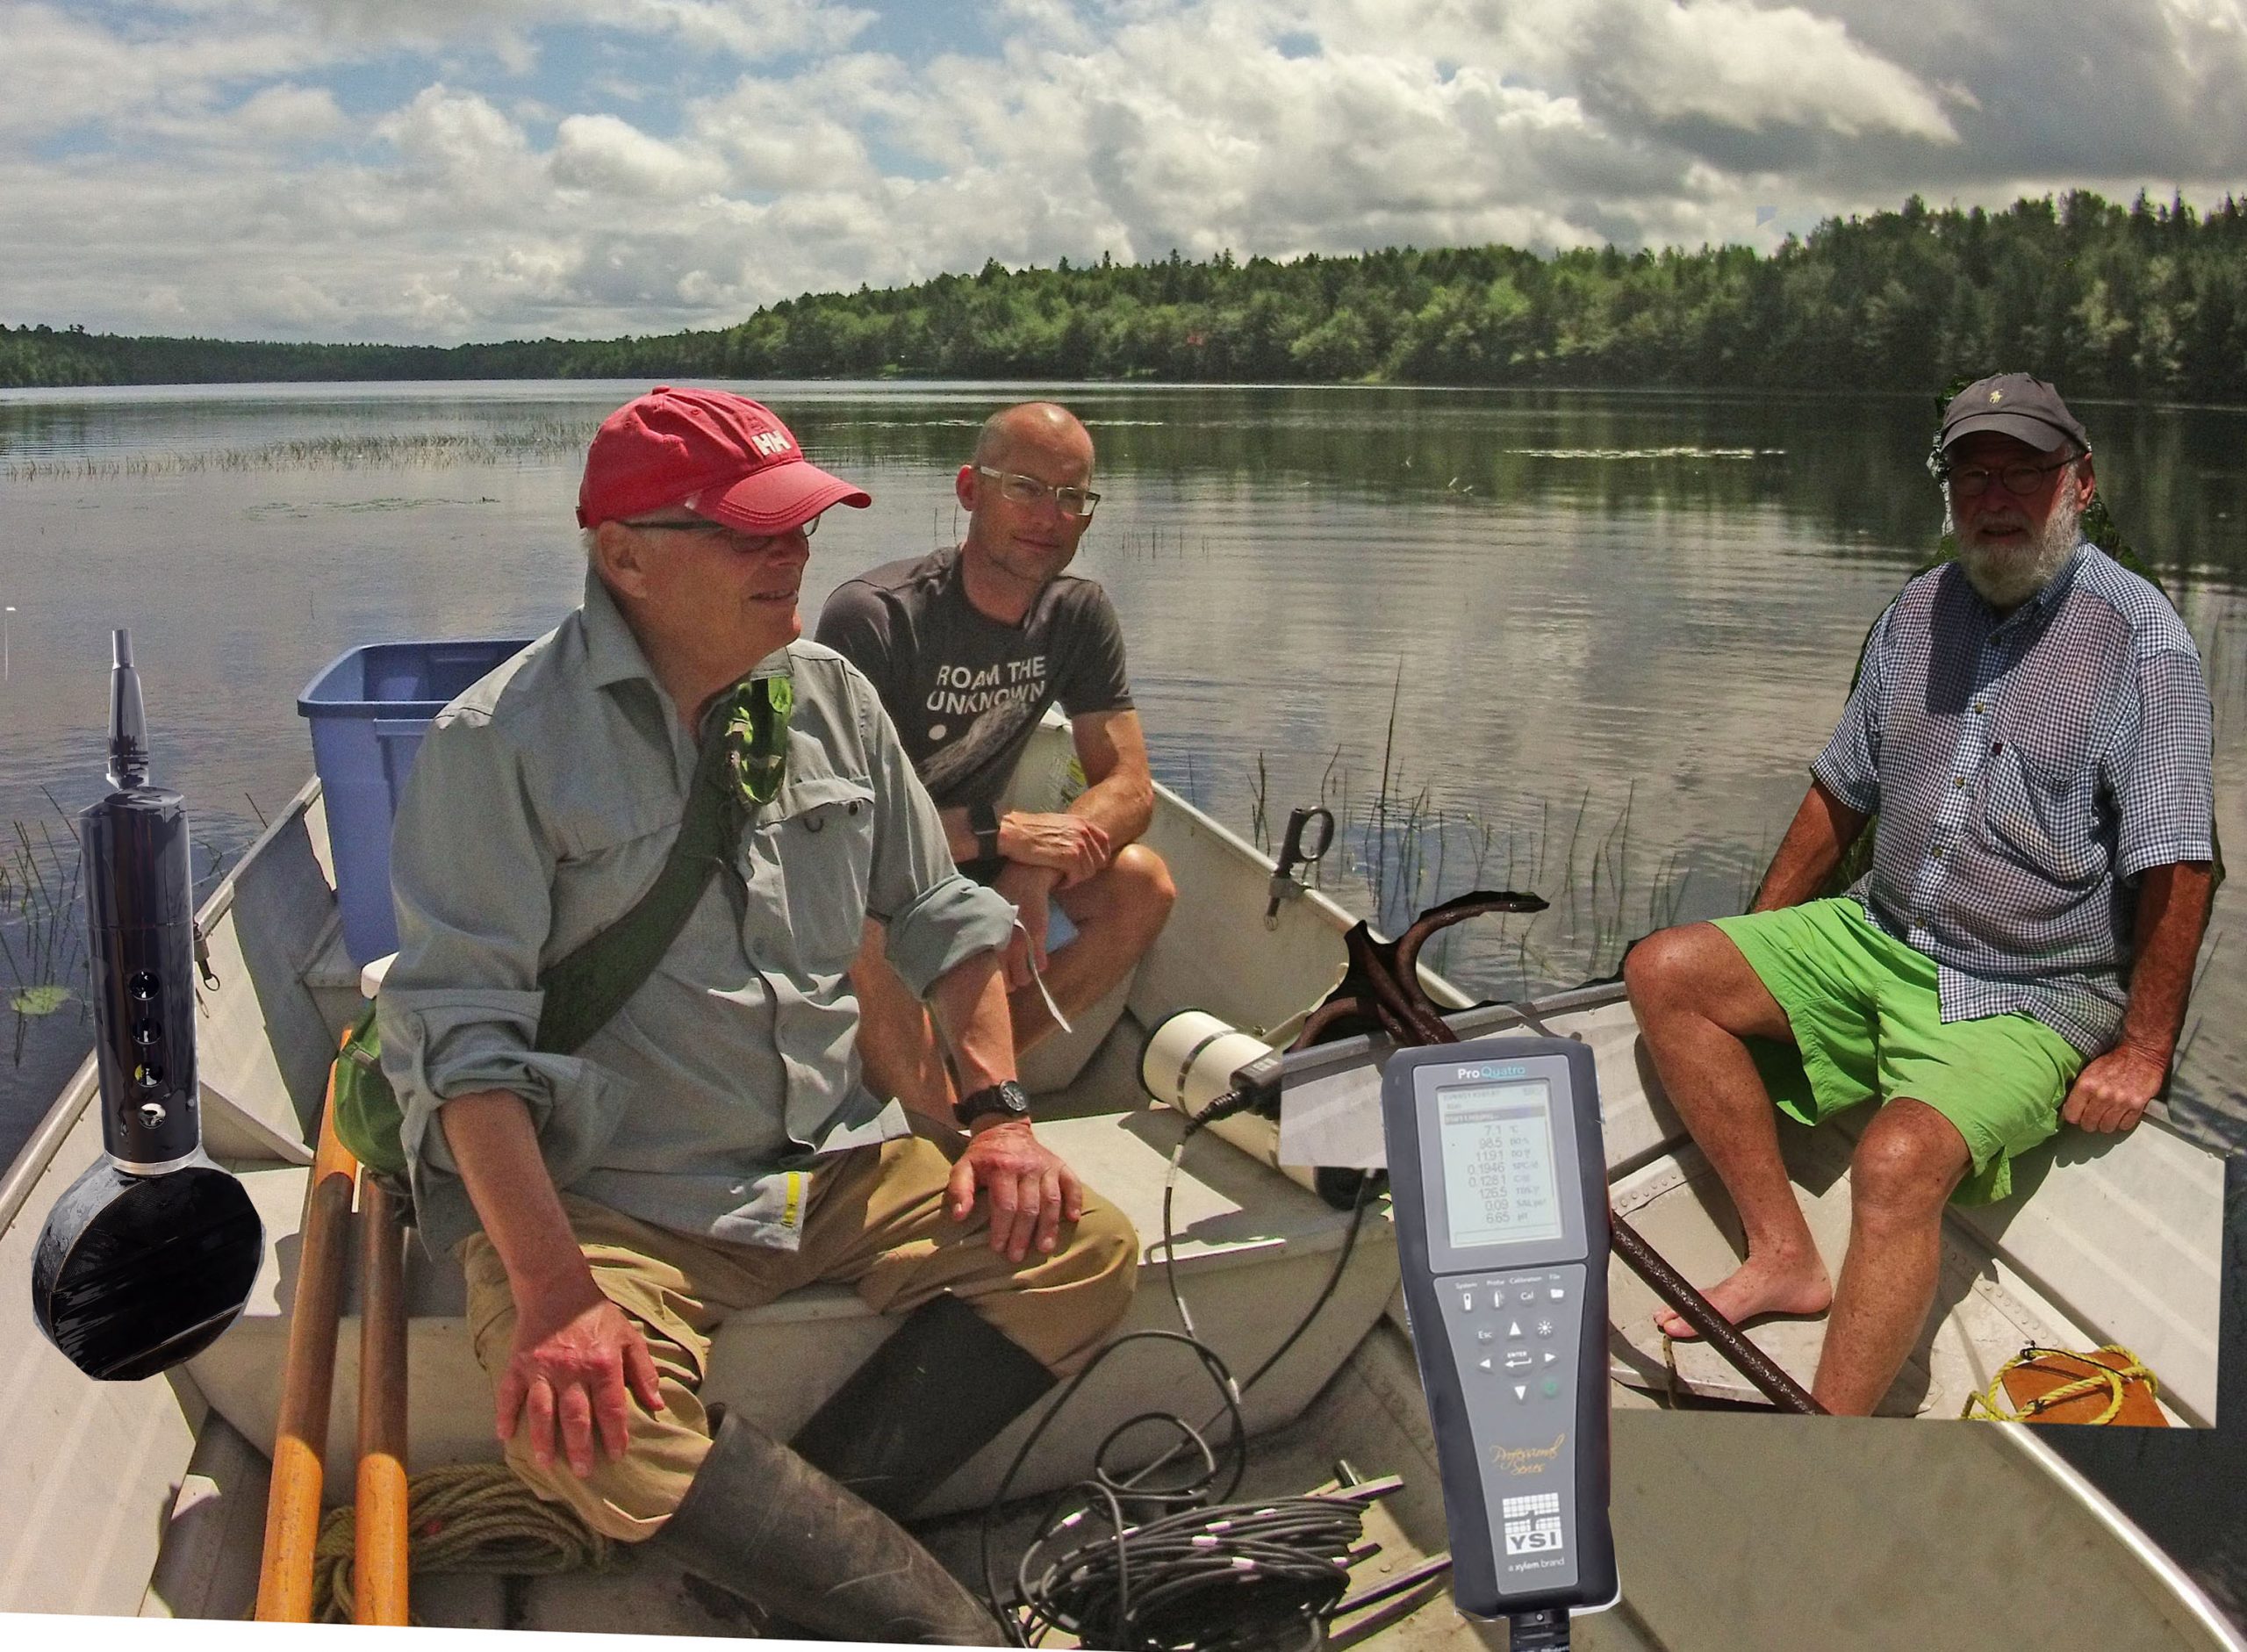
Water sampling on Sandy Lake, Aug 14, 2023, here by the outlet. Insets: At left the YSI Probe with weight attached; right: YSI Instrument panel. A portion of the Van Dorn water sampling bottle can be seen by the anchor.
Click on images for larger versions
Contents
SUMMARY
BACKGROUND
THE AUGUST 2023 OBSERVATIONS
Occurrence of a “Metalimnetic Oxygen Minimum”
SOME RELATED PAGES & POSTS
After extreme precipitation events earlier in the summer of 2023, the entire water column had lower conductivity values ( a measure of salt content) on Aug 14 compared to May 22 and bottom waters on Aug 14 were better oxygenated than on 6 other occasions in the past when deep water oxygen levels were measured in late summer/early fall. This flushing and oxygenation could be good news if there weren’t other adverse effects of the heavy precipitation. Observations in the latter half of August in 2021, 2022 and 2023 show the presence of a “Metalimnion Oxygen Minimum” at 5-6 m; it appears that it reformed quickly after the high precipitation events in 2023. The occurrence of a Metalimnion Oxygen Minimum in Sandy Lake represents significant deterioration in water quality of the upper layers of the water column and adds yet more reason to be concerned about the state of the lake currently and the possible impacts on lake water quality if the proposed major development on its headwaters was to proceed.
BACKGROUND
Sandy Lake was identified as a ‘future growth area’ for Halifax Regional Municipality in the first (2006) Regional Plan and again in the second (2014) Regional Plan. The lands west of Sandy Lake were zoned as “Urban Settlement” which in turn called for a Watershed Study as defined by Policy E17.
The Watershed Study for Sandy Lake was completed by AECOM in 2014. Except for a few surface water samples collected in 2013/2014, it was entirely a desktop study (as requested by HRM). Based on their use of the Lake Capacity Model – a phosphorus load model – AECOM (2014) predicted that up to approx. 12,000 people and new development on 56% of the area of the Sandy Lake sub-watershed would be compatible with maintaining desirable water quality in Sandy Lake, providing certain mitigative measures are followed.
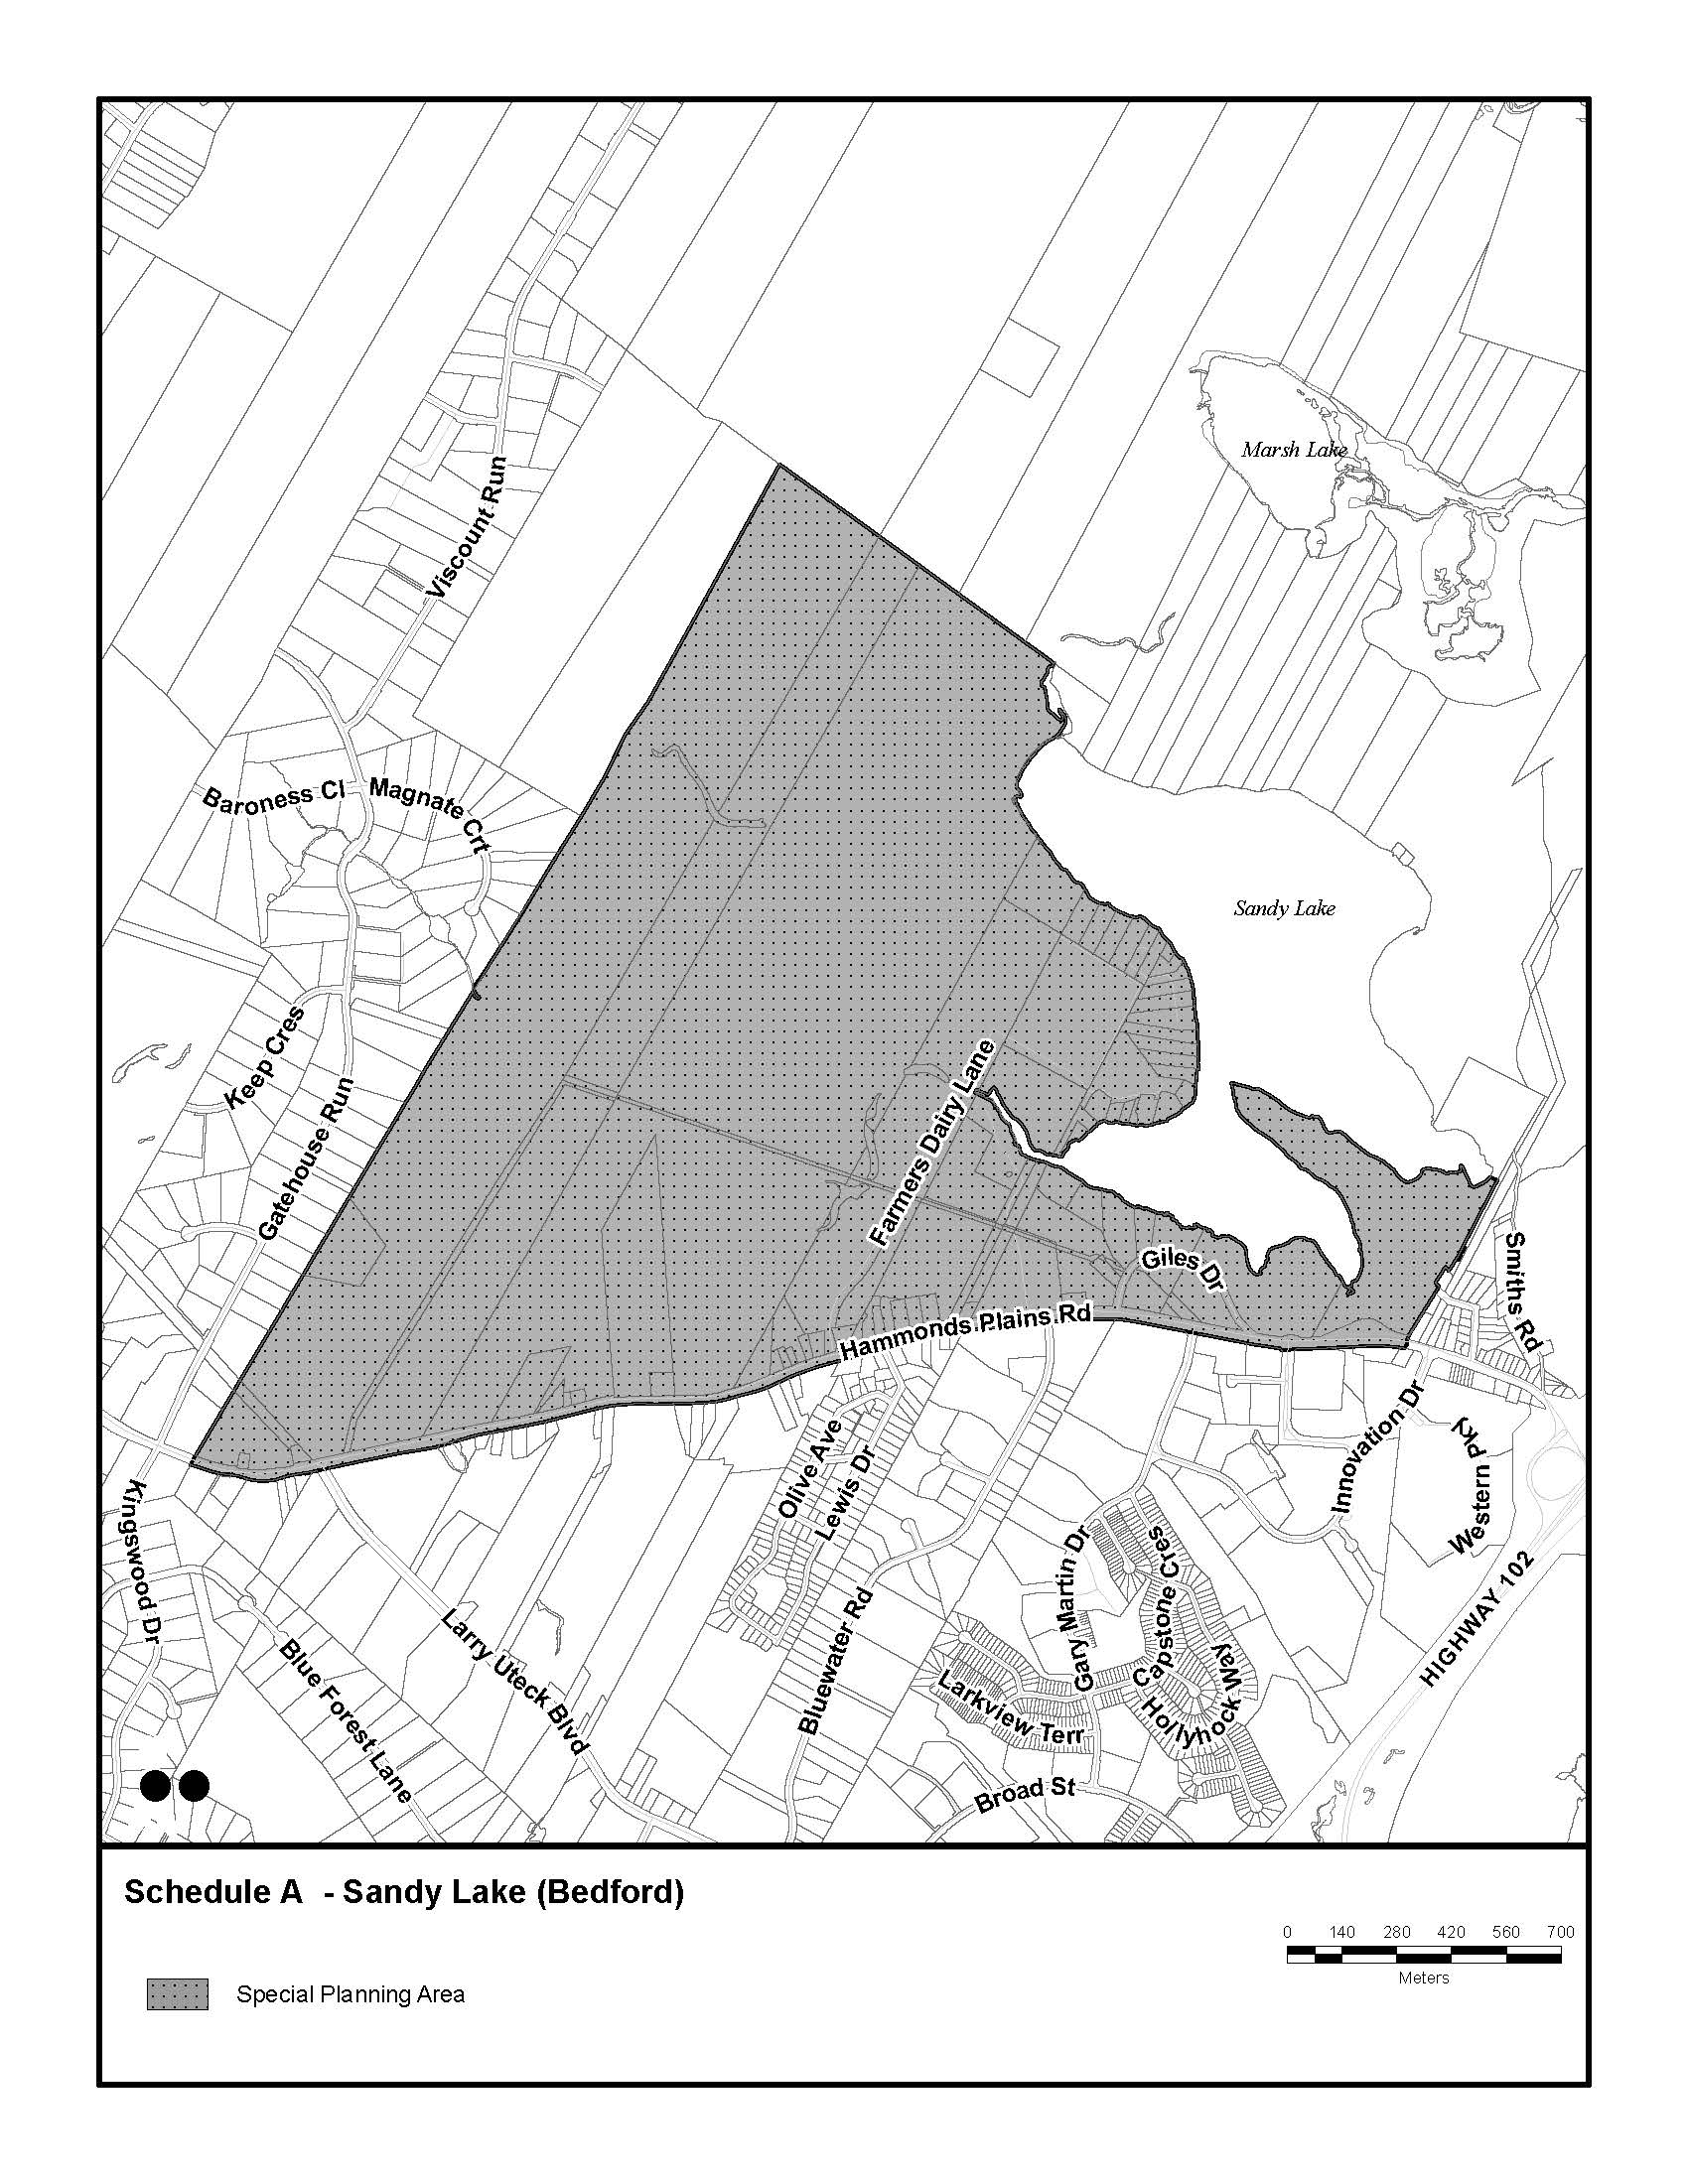
In the spring of 2022, lands to the west of Sandy Lake were identified by the Province/HRM as a Special Planning Area “for the purpose of accelerating housing development in the Municipality”. View Doc
There are significant issues I and others have raised concerning AECOM’s use of the Lake Capacity Model that should raise serious doubts about the validity of the model as applied by AECOM for Sandy Lake, and hence its predictions. Regardless, AECOM (2014) acknowledged that the modelling provides only a first approximation to reality and recommended “a robust water quality monitoring plan…for the Sandy Lake watershed to provide a further assessment of current conditions and to evaluate the impacts of development on the water quality.” (Italics inserted)
Such monitoring was not subsequently implemented by HRM, which nonetheless continued to plan for a major development; more recently the provincial Task Force on Housing in HRM has named the land West of Sandy Lake a “Special Planning Area” to be fast tracked for development. In other words, such planning is proceeding on the unproven and very uncertain assumption that new development could proceed without serious impacts of the recreational and ecological well-being of Sandy Lake.
In 2017, with the help of volunteers Ed G., Derek S., and Bruce S. of the Sandy Lake Conservation Association, we began to monitor some key limnological variables in Sandy Lake, in particular the vertical profiles of temperature , oxygen, conductivity and pH at or close to the deepest spot on the Lake.
We borrowed the required equipment from the Community Based Environmental Monitoring Network based at St. Mary’s University in Halifax for sampling vertical profiles on Oct 3, 2017, Sep 30, 2019; and Apr 19, 2021; from the Atlantic Water Network on May 7, 2022. On Aug 22, 2022; Apr 21, 2023 and Aug 14, 2023 and thereafter we conducted observations in conjunction with the newly established Halifax LakeWatchers Program.
These observations, combined with some historic data, revealed two phenomena that raise serious concerns about the state of Sandy Lake currently, and the impacts of further development:
(i) Rising salt levels and “salt stratification” of the water column. Such increases are well documented more generally for lakes in HRM and elsewhere in areas where road salt is used. It has been shown that the percentage of development and associated factors is the major driver of these increases. Development on the scale proposed for Sandy Lake would very likely drive salt levels into the chronic toxicity range; it could increase salt stratification to the point that normal spring turnover is inhibited, resulting in more prolonged anoxic conditions in deepwater and “internal phosphorus loading” which would accelerate eutrophication and deterioration of Sandy Lake. The “salt issue” was not identified in the AECOM (2014) Report. For more details see DRAFT Report On the State of Sandy LakeSandy Lake: Temporal Trends in EC (salt); & Road Salts
(ii) Falling and now very low deep water oxygen levels
Ours were the first complete limnological profiles obtained for Sandy Lake, however top and bottom values for the same variables were obtained in studies conducted in 1971 and 1998, giving us a set of 5 top-and-bottom measurements during the period of summer stratification covering a span of 51 years:
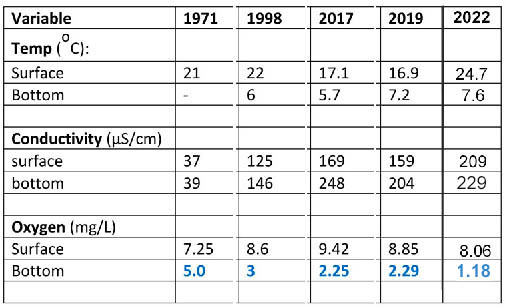
Table 1. Historic Shallow and Deep Water Temperature, EC and Oxygen values for Sandy Lake (Bedford) during the summer stratification period.
1971: from Metropolitan Area Planning Committee 1971-1972: Water Quality Survey for Selected Metropolitan Area Lakes. Lake sampled on Aug 30, 1971. Deep sample at 59 feet (18 m). Chloride was 8.0 at surface, 12.0 at 59 feet (18 m). EC and chloride were elevated in the Southern Inlet sample (57.0 µS/cm, 11.0 mg/L). 1998: Nova Scotia Lake Inventory Program Sep 2, 1998. Deep sample at 19 m. Chloride at surface was 29 mg/L at 19 m, 34 mg/L. 2017: Sampled Oct 3, deep sample at 17.5 m. 2019: Sampled Sep 30, Deep sample at 21 m. 2022 Sampled Aug 22. Two profiles, averaged the values (at 19,5 and 20m)
Although the data are limited, it’s clear that there have been big changes in deep water (bottom) dissolved oxygen and in conductivity (both top and bottom) over the 51 year period. Of particular concern is the progressive decline in bottom oxygen values over the 5 sampling dates, going from 5.o mg/L in 1979 to 1.18 mg/L in 2022. This has two major repercussions:
(i) Deterioration of the cool deep water refuge for salmonids in summer.
(ii) There is increased likelihood that intervals of hypoxia (low oxygen) in deep water could result in anoxic conditions (no oxygen) at the sediment surface and associated mobilization of phosphorous, accelerating eutrophication and marked deterioration of water quality

Fig. 1. Profiles for Temperature, Dissolved Oxygen and Total P at the deep site in Aug 2021 shown in Doucet (2022), reproduced with permission. Identifying lake water quality trends and effective monitoring strategies in a rapidly urbanizing region. Doucet, C., 2022, [Master of Applied Science, Dalhousie University] Profiles for Sandy Lake are shown in Electronic Supplement 3.
THE AUGUST 2023 OBSERVATIONS
On Aug 14, we conducted our late summer profile for 2023.
We had very high rainfall events in July and August with flash floods associated with the rainfall on July 21 & 22 and Aug 5 affecting the Sandy Lake/Bedford area, the latter much less so than the earlier dates (Weather Network Aug 5, 2023; Reuters July 24, 2023). Sandy Lake was impacted by overflow from a sewage pumping station on Farmers Dairy Lane during the July event (CTV news July 24, 2023); the overflow was contained by July 26 (HalifaxWater message July 26, 2023). The water level in Sandy Lake increased by 5-6ft and remained well above historic levels until late in Aug (personal communication from two lakeside residents).
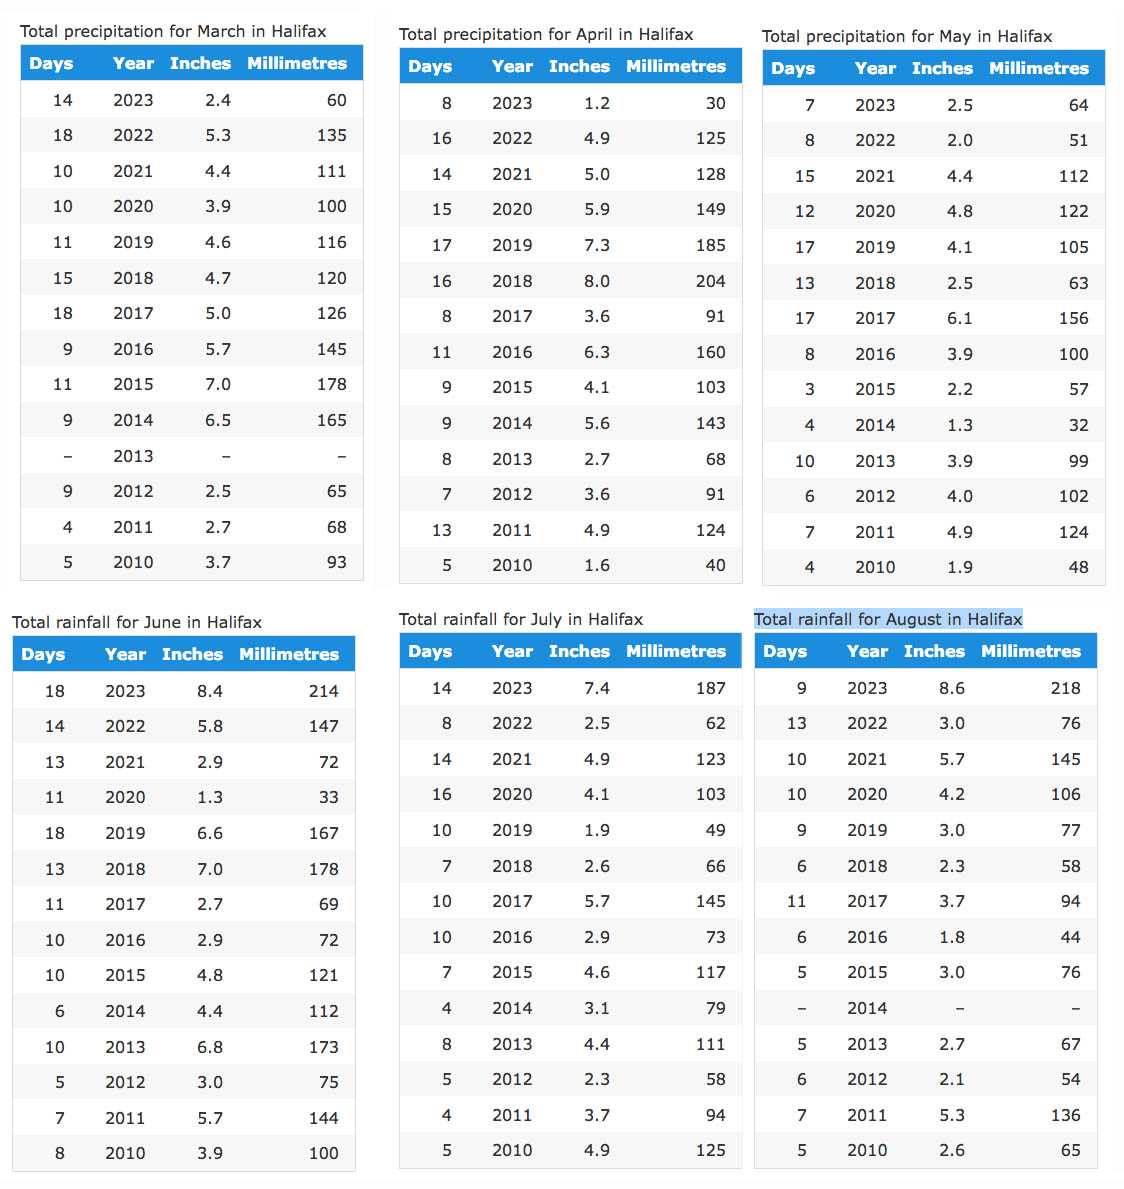
Table 1. Monthly precipitation in Halifax 2010 to 2023. After exceptionally dry spring (Mar-Apr-May), the summer months of 2023 (Jun-Jul-Aug) exhibited record high rainfall. Source: https://www.currentresults.com/Yearly-Weather/Canada/NS/Halifax/extreme-annual-halifax-precipitation.php (Table added to page on Aug 17, 2024.)
On Aug 14, 2023 there was freshening of the whole water column (indicated by lower Conductivity values) and the thermal stratification was much less pronounced compared to the Aug 2022 profile:
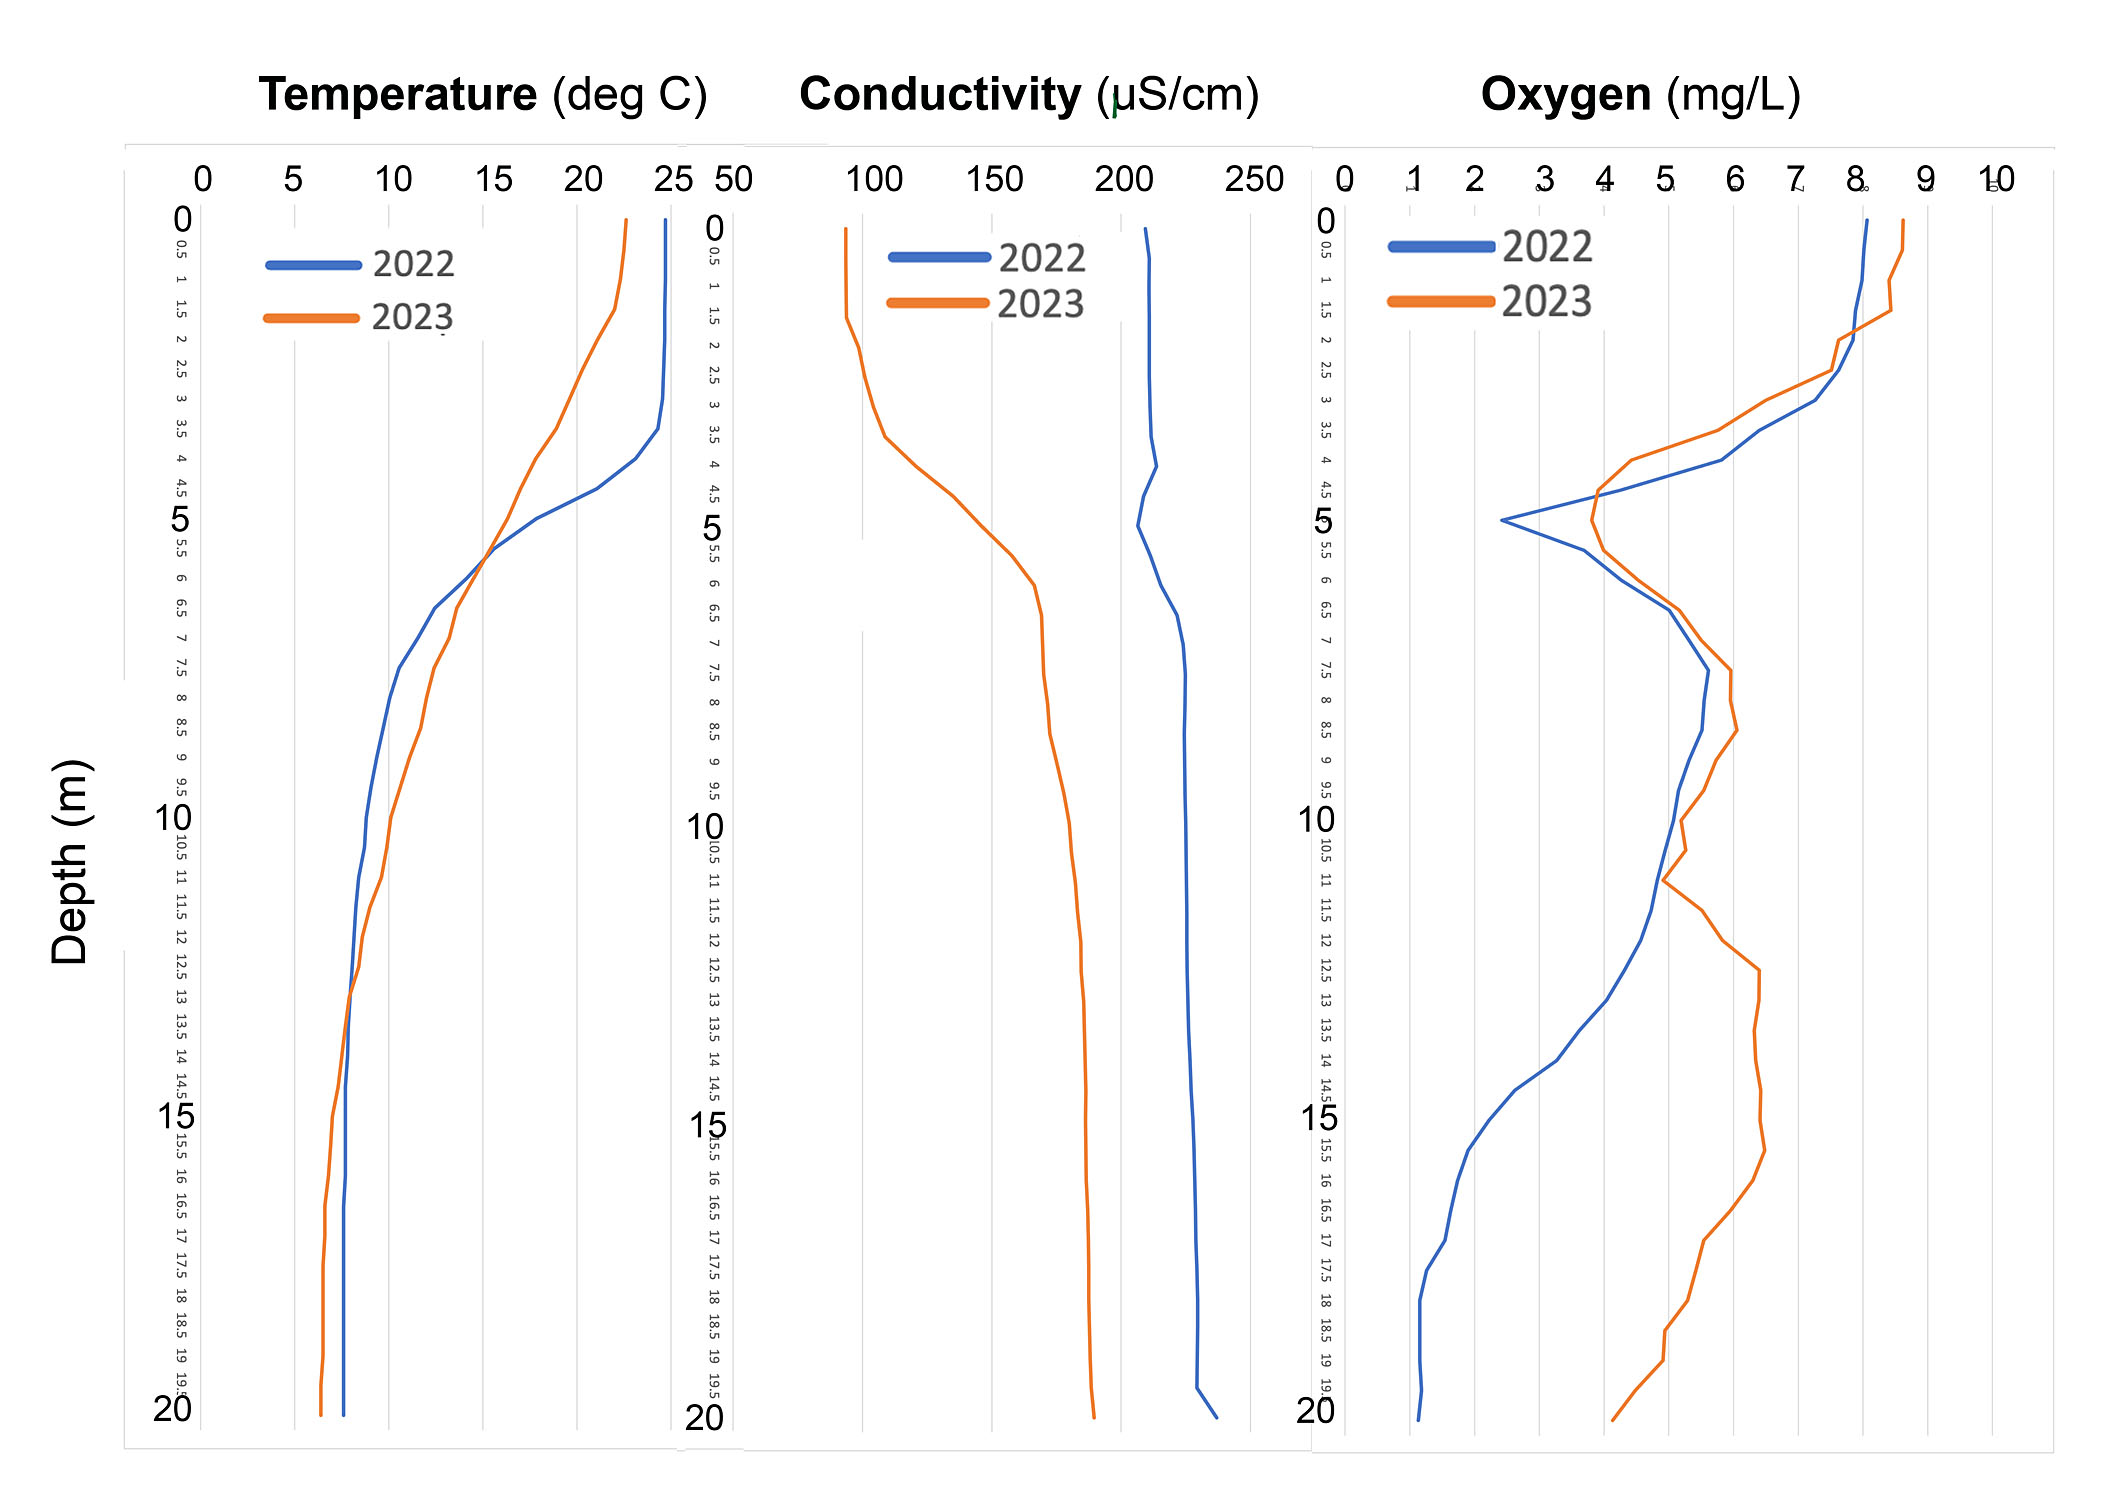
Fig. 2. Temperature, conductivity and oxygen profiles on Aug 22, 2022 (blue) and Aug 14, 2023 (orange). Note the gradual decline in temperature in 2023, versus the existence of a distinct zone of large temperature change (the “thermocline” or the “metalimnion“) between 3 & 7 m in 2022; however there is a much sharper change in conductivity in that depth interval in 2023 compared to 2022, i,e. more pronounced salt stratification. Conductivity values in 2023 were much lower than in 2022 through the entire water column. View Dimictic Lakes on Wikipedia for a brief description of the type of lake stratification we have in Sandy Lake, and the zones (epilimnion, metalimnion, hypolimnion).

Fig. 3. Conductivity values in spring and late summer in 2022 (left) and 2023 (right)
Note differences in horizontal scales. “Diff” is the late summer value minus the spring value. At 18 m the late summer value exceeded the spring value in 2022 by 4.5 uS/cm but was less than the spring value in 2023 by 14.1 uS/cm – further evidence that some freshening occurred even in the deeper water in 2023. It was much more pronounced at 2 m. In our seasonal sampling, the conductivity of the surface water on July 7 2023 was 187 uS/cm; on Aug 2, 2023 it was 101 uS/cm.
Deep water oxygen levels in Aug of 2023 were approx. 3-4 mg/L higher than in 2022 (see Fig 2, above)* reaching a value close to 5 mg/L at 18 meters depth, a clear break from very low values observed since 1997:
*In the earlier, spring sampling in both years, the water column was well oxygenated, see Limnological Profiles

Fig 4. Near-bottom oxygen levels in deepest area of Sandy Lake 1971 to 2023. Observations on Aug 30, 1971; Sep 2, 1998; Oct 3, 2017; Sep 30, 2019; Aug 22, 2022; Aug 14, 2023; & (Doucet) Aug 16-23 interval in 2021. View Post Mar 21, 2023 for details.These are dramatic changes, and are attributable to the episodic rainfall events in mid-summer of 2023.
This increase could be viewed as good news, and we might even speculate that if heavy precipitation in mid-summer continues in future years because of warmer ocean waters near NS, that would be good for Sandy Lake. BUT, there’s a lot about the episodic event we don’t know. For example, did the the massive flushes of water carry with them a lot of organic debris and sediment that sunk to the bottom and that will increase oxygen consumption in the deeper layers in future? The Secchi disk reading on Aug 14, 2023 was 1.5 m compared to 2 m on April 21, 2023, and 2.5 m on Aug 22, 2022 and the water was noticeably browner than usual. One of the commonly documented effects* of episodic precipitation is an in increase in the DOC (Dissolved Organic Carbon, made up largely of humic substances) which can push a lake to a higher level of heterotrophy/oxygen consumption.
*See e.g., Effects of weather-related episodic events in lakes: an analysis based on high-frequency data, E. Jennings et al. 2012 in Freshwater Biology; Extreme weather years drive episodic changes in lake chemistry: implications for recovery from sulfate deposition and long-term trends in dissolved organic carbon, KE Strock et al., 2016 in Biogeochemistry.
Occurrence of a “Metalimnetic Oxygen Minimum”
One characteristic of these August profiles that changed very little between 2022 was a dip in the oxygen level with a local minimum of at 5-6 meters in the metalimnion in both 2022 and 2023; the minimum value in 2023 (3.8 mg/L) was higher than in 2022 (2.4 mg/L):

Fig 5. Oxygen Profile in Aug 22, 2022 and Aug 14, 2023. Arrows point to oxygen minima in the upper part of the water column. The top two occur at approx. 5 m, in the metalimnion, the bottom arrow points to an additional less pronounced oxygen minimum at approx 12 m in 2023. (See Fig 2 above for the temperature profiles.)
When I first observed this dip (Aug 22, 2022), I was skeptical about its reality as the oxygen readings were taking too much time, I felt, to equilibrate; I wrote a note to the organization from which we had borrowed the equipment to suggest that perhaps the sensor membrane needed to be replaced.
In the late fall of 2022, Casey Doucet reported on limnological observations she had conducted on a suite of lakes in HRM, including Sandy Lake, in 2021, for her Masters of Applied Science research at Dalhousie University. Her plot of oxygen versus depth for Sandy Lake in mid August 2021 (Fig 1 above) showed almost exactly the same thing: a dip in oxygen to approx. 3.2 mg/L at 6 meters, in the metalimnion.
So I knew this dip was real. Then we observed the dip again in Aug 2023 and again in 2024 – 4 years in a row altogether (2021, 2022, 2023, 2024).
I checked my “bible” on lakes – Wetzels Limnology, 3rd ed. (2001). It turns out that increases in oxygen in the metalimnion or “Metalimnetic Oxygen Maxima” are relatively common, dips in oxygen or “Metalimnetic Oxygen Minima” much less so.

Fig. 6. Bathymetric Map of Sandy Lake (Ed Glover, 2006) with an overlay of the WAM Predicted Flows from the NS Provincial Landscape Viewer; streams are highlighted. The orange arrow point to the location of the deep water profiles. Click on image for larger version
The precise cause of Metalimnetic Oxygen Minima may vary; it is more commonly observed in eutrophic (nutrient rich) lakes than in oligotrophic (nutrient-poor) lakes*. Interestingly, of the 4 lake profiles presented by Doucet 2022 that were 15 m and greater, distinct dips in the metalimnion were present in the two (one of them Sandy Lake) that also exhibited very low oxygen and highly elevated total P levels near the bottom.
Lake morphometry and benthic oxygen consumption in shallower waters can be contributing or pre-disposing factors to the formation of Metalimnetic Oxygen Minima*.
*View Surface Waters.Lit & Links/Metalimnetic Oxygen Minima for some of the scientific literature consulted.
It is probably relevant that at Sandy Lake, a lot of surface water flows into the lake over extensive shallower areas (Fig 5, above) and thus is exposed to the sediment surface in the southern basin well before it reaches the area of our profile. also that some of these waters come from the more developed areas and areas where new development is planned or proposed. Another possibility: enhanced consumption of oxygen in shallow waters associated with massive flow of woody debris into the northern basin of the lake following clearcutting in 2013. Climate warming could be expected to enhance the effect by increasing rates of respiration in shallower waters and sediments.
Curiously, there was a second minimum at about 12 m in 2023, not observed in 2022 or in Casey Doucet’s Profile, but observed again in 2024. Did the massive flushes of water essentially push the shallower water minimum deeper, and then the shallower minimum reform? We can’t say of course, but the fact that a shallower (5 m) Metalimnetic Oxygen Minimum was still evident in fresher water than had prevailed earlier in the summer, suggest that the processes leading to its formation were very active throughout and/or after the freshening.
Metalimnetic Oxygen Minima in 2021 (Casey Doucet), 2022, 2023 and 2024 (our observations) were below 5 mg/L, and thus represent significant deterioration in the Water Quality of Sandy Lake for both both warm water and cold water aquatic life (CCME, 1999) beyond that associated with low oxygen in the hypolimnion. Because Metalimnetic Oxygen Minima are usually associated in some way or another with enhanced respiration in shallower waters, they may also accelerate nutrient cycling and production in the upper waters (i.e. speed eutrophication).
The intensive metalimnetic respiration in lakes forming a MOM can be expected to accelerate nutrient cycling close to the photic zone and thus, may further stimulate primary production. – from Krelling et al., The importance of physical transport and oxygen consumption for thedevelopment of a metalimnetic oxygen minimum in a lake. Limnol. Oceanogr. 62, 2017, 348–363.
It’s not clear whether the occurrence of a Metalimnetic Oxygen Minimum at Sandy Lake is a recent phenomenon. There is some suggestion of it in the profiles of Oct 3, 2017 (the earliest available for Sandy Lake) and Sep 30, 2019, but these were later in the season (in the early fall) versus the late summer observations of 2021 (Casey Doucet ), 2022, 2023 & 2024 (our observations); on those later dates, the waters had not turned over but they had cooled significantly and higher temperatures (which would increase respiration rates) are likely necessary for its formation.
Water temperature in the metalimnion is decisive for MOM formation
– Mi et al., The formation of a metalimnetic oxygen minimum exemplifies how ecosystem dynamics shape biogeochemical processes: A modelling study Water Researchm Volume 175, 15 May 2020
Unfortunately, climate warming is likely to enhance the Metalimnetic Oxygen Minimum in Sandy Lake, resulting in even lower metalimnion oxygen values in future.
I have not been able to locate any studies specifically referencing Metalimnetic Oxygen Minima in Nova Scotia which may indicate that to date it has not been a common phenomenon. Regardless, climate warming and increasing urbanization could lead to its more common occurrence. In Brylinski’s 2002 report on the Nova Scotia Lake Hypolimnion Project, Metalimnion Oxygen Minima appear to present in 4 of the 20 lakes surveyed (profiles are given in Appendix III). As mentioned above, of the 4 lake profiles for HRM area lakes presented by Doucet 2022 that were 15 m and greater, distinct dips in the metalimnion oxygen were present in the two (one of them Sandy Lake) that also exhibited very low oxygen and highly elevated total P levels near the bottom.
In regard to Sandy Lake, the occurrence of a Metalimnion Oxygen Minimum and its apparently quick re-formation after the episodic flooding unfortunately adds yet more reason to be concerned about the state of the lake currently and the possible impacts on lake water quality if the proposed major development on its headwaters was to proceed.
SOME RELATED PAGES & POSTS
Surface Waters/Sandy Lake: A DRAFT Report On the State of Sandy Lake, the Historical Trends and its Future Trajectory
Feb 23, 2021. A syntheses. Updates are made
Surface Waters/Sandy Lake/Limnological Profiles
All of our profile observations, including data files
Surface Waters/Lit & Links/Metalimnetic Oxygen Minima
Scientific Literature related to the discussion of the Metalimnetic Oxygen Minima above
Surface Waters/Sandy Lake/SL Report More Details/Critique of Predictions/No Followup Monitoring
More details on Sandy Lake re: section 4.2 Critique of the AECOM (2014) Predictions/No Followup Monitoring
Surface Waters/Sandy Lake/SL Report More Details/Policy E-17
Text from Pages 30 and 31 of HRM Regional Municipal Planning Strategy (2006) This policy specifies the requirements of lake studies required as part of secondary planning for lands zoned as Urban Settlement. “These studies shall determine the carrying capacity of the watersheds to meet the water quality objectives which shall be adopted following the completion of the studies.”
Surface Waters/Sandy Lake/SL Report More Details/Mirror Lake – Sandy Lake comparison
Cases of impairment of spring turnover when salt levels/conductivity get very high are well documented, locally Oat Hill Lake is a prime example; in 2017 deep water EC was circa 1200 uS/cm March through October, compared to values in the range 250 to 550 uS/cm on the surface. However, there is very little documentation of the minimum differences in salt/conductivity that can impair regular turnover in dimictic lakes; obviously local factors such as area of lake, exposure to wind are important as well. Mirror Lake in New York state is similar to Sandy Lake in many respects and impairment of spring turnover for this lake has recently been documented.
Deep water oxygen levels in Sandy Lake (Bedford, NS) fall to precariously low levels 21Mar2023
Post, Mar 21, 2023.
Regarding Case 23307 – Bedford West subareas 12 & 1 Special Planning Area 25Jul2023
Post, Mar 21, 2023. The impacts of already approved development for this area on Sandy Lake have not been taken into account. It is currently a mostly undeveloped treed landscape with significant wetlands.
Page created Sep 2, 2023
Modifications additions on Aug 20, 2024