
Footnotes for In Conclusion…
| Info. for Print Versions of this Page: This page is posted on the website Sandy Lake & Environs (Bedford, Nova Scotia) at http://versicolor.ca/sandylakebedford. The Full URL: https://versicolor.ca/sandylakebedford/waters/lakes/limnol-profiles/2024-limnological-profiles-return-to-historic-trends/in-conclusion-the-precarious-state-of-sandy-lake/notes/ This page provides the footnotes for a page “In Conclusion…” at this URL: https://versicolor.ca/sandylakebedford/waters/lakes/limnol-profiles/2024-limnological-profiles-return-to-historic-trends/in-conclusion-the-precarious-state-of-sandy-lake/. The one line Summary for In conclusion…: “In conclusion, our latest limnological profiles further confirm a long term trend of decline in the health of Sandy Lake (Bedford, NS), and underscore why a major new development on its headwaters could “do it in”. This Footnotes page contains hyperlinks which in most cases are not spelled out, but should be active in PDF versions of this page when viewed on a computer or smartphone, however they may not be functional depending on the the particular device/its configuration. If not, the reader should go directly to the Sandy Lake website at this URL: https://vesicolor.ca/sandylakebedford (paste it in the navigation box at the top of the web browser); then on the navigation menu on that page go to “Quicklinks”, where you can click on links to the pertinent pages.  |
THE FOOTNOTES
1. Some background to my (David Patriquin’s) involvement. I am writing as a retiree in my eighties, a long time resident of HRM living in peninsular Halifax, an active member of several natural history and trail groups, and a Prof. of Biology at Dalhousie University (retired 2008). Politically, I like to think I am open minded, having voted for candidates in all of the three major parties, plus the Greens. Related to development in HRM, as a representative of WRWEO (Woodens River Watershed Environmental Organization, past co-chair) and the Halifax Field NaturaIists (past president) I participated in the earlier days of Our HRM Alliance when I learned about and became an advocate of “densification”, and remain so even though it is now impacting “my backyard” on peninsular Halifax. So I am not “anti-development”, just pro smart development. More trivia about me here. In the late spring of 2017, I was asked by the Sandy Lake Conservation Association if I would do a “floral survey” of Sandy Lake and Environs in relation to their efforts to see more of the land around Sandy Lake protected in some way or another. They asked me specifically because I had conducted the study that convinced even the Clayton folks that the land they were proposing to develop in the “Williams Lake Backlands” was better protected, which it now is as the “Shaw Wilderness Park”. I agreed and conducted field trips on 22 days over the period June 14 to Nov 1, 2017; a few were mostly on water (paddling), most were on land. It was a volunteer activity, there was no payment and no contract. As a component of that study and because I was familiar with limnological techniques and out of curiosity, on Oct 3, 2017 I conducted limnological observations at 3 points in Sandy Lake with the help of a local volunteer. The results raised some concerns. In the late fall of 2017, I realized that far more observations – and time – were needed to adequately describe “Sandy Lake & Environs” at large. So rather than submit a single final report, I would post observations and related info on a website – Sandy Lake & Environs (Bedford, Nova Scotia) – on an ongoing basis. (Toward my final years at Dalhousie University, I collaborated with computer science folks to develop online tools for teaching and whole classes on the web, so I am fairly conversant with the related technology.) The website was launched on Dec 20, 2017. I posted a “A DRAFT Report On the State of Sandy Lake, the Historical Trends and its Future Trajectory” on Feb 23, 2021 which integrated all limnological observations to that point, but observations have been continuing and are reported in the section Surface Waters and it subpages.
2. “13 Species At Risk”, for documentation, See
Avian & Species at Risk Surveys of the proposed Sandy Lake – Sackville River Regional Park
Report by Natural Wonders Consulting Firm to Sandy Lake Conservation Association, March 2020. 20 pages. “Species at Risk living within the proposed park boundaries include: Barn Swallow, Canada Warbler, Common Nighthawk, Common Snapping Turtle, Eastern Painted Turtle, Eastern Wood-Pewee, Evening Grosbeak, Little Brown Myotis, Monarch, Moose (Mainland Population), Olive-sided Flycatcher, Rusty Blackbird and Wood Turtle. The information on these species is found in this report under Species of Concern and in Table 2. Several important wildlife corridors were identified during the surveys, including two major wildlife corridors. The locations of these two major corridors along with a dozen smaller but important wildlife corridors are marked on Map 2: Wildlife Corridors”
Not in that list, but present in Sandy Lake and downstream waters are American Eel and Atlantic Salmon. The American Eel was assessed as of Special Concern by COSEWIC in April 2006. The status was re-examined by COSEWIC in May 2012 and designated Threatened. It currently has no status under the federal Species at Risk Act. It is listed by ACCDC as S3N (Non-breeding population: Threatened) in Nova Scotia. Some populations of Atlantic Salmon have SAR status federally; Atlantic Salmon is listed by ACCDC for Nova Scotia as SIB and SIN (Both Breeding and Non-breeding populations Critically Imperiled).
3. re: “the proposed major development to the west/southwest of Sandy Lake ”
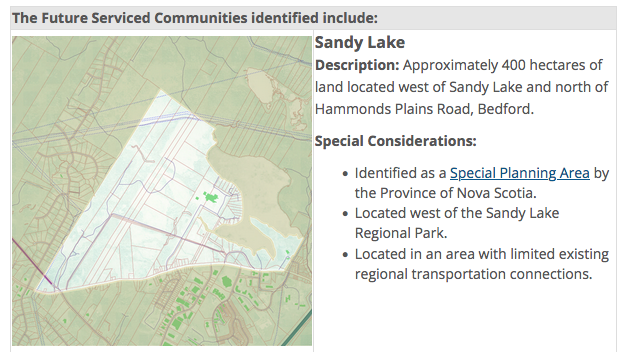
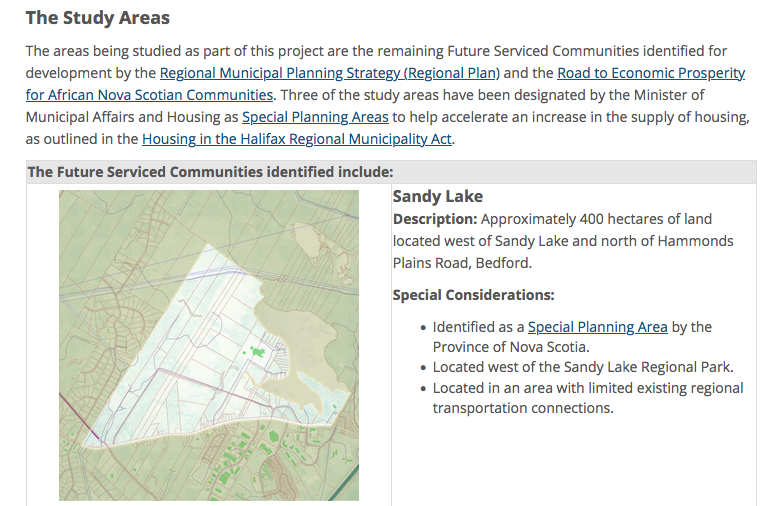
The Sandy Lake area is one of 15 “Provincial Special Planning Areas“. (It was included in the initial set of nine such areas announced on Mar 25, 2022.)
| From the Provincial Special Planning Areas:
The Province of Nova Scotia has created an Executive Panel on Housing to address housing challenges in the capital region. As part of this initiative, the Minister of Municipal Affairs and Housing has designated fifteen (15) Provincial Special Planning Areas (SPAs) in the Halifax Regional Municipality to support the development of as many as 46,245 new residential units and approximately 380 long term care beds. To help accelerate an increase in the supply of housing, as outlined in the Housing in the Halifax Regional Municipality Act, the designation allows the Minister to make decisions on planning matters in those areas. The eleven Provincial Special Planning Areas (SPAs) are: Former Penhorn Mall lands Indigo Shores Clicking on the Sandy Lake link brings up this info:
The page goes on to give details of a Public Feedback and Approval Process and then this: The Province is also investing $2.3 million to enable the municipality to conduct critical environmental, land-use suitability, transportation and infrastructure studies to inform future planning and development decisions. These areas have been identified as Future Serviced Communities that require further study. View additional information on these sites. |
Further details on Project Status etc are given on the Future Service Communities Page. From that page, items dealing specifically with the Sandy Lake SPA:
 and links:
– Draft Sandy Lake LSA April 18 2024.pdf (38.5 MB) (pdf)
– Sandy Lake Study Area (2.49 MB) (pdf)
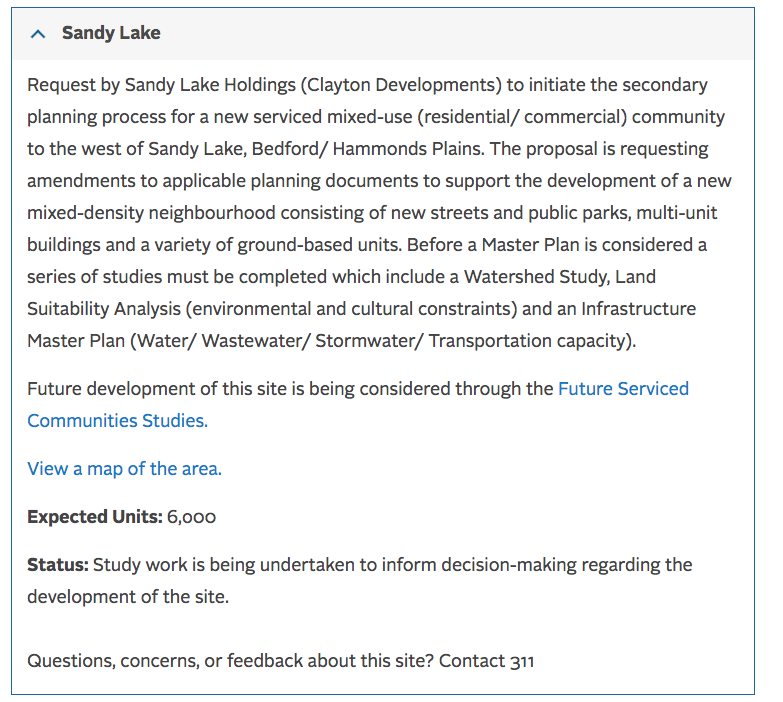
As of Sep 27, 2024, the only publicly available document (that I know of) providing some details on the location of the development, number of units etc is C030 – Sandy Lake
(Request by Sandy Lake Holdings (Clayton Developments) for a new serviced mixed-use (residential/ commercial) community). It includes this map (screen capture):
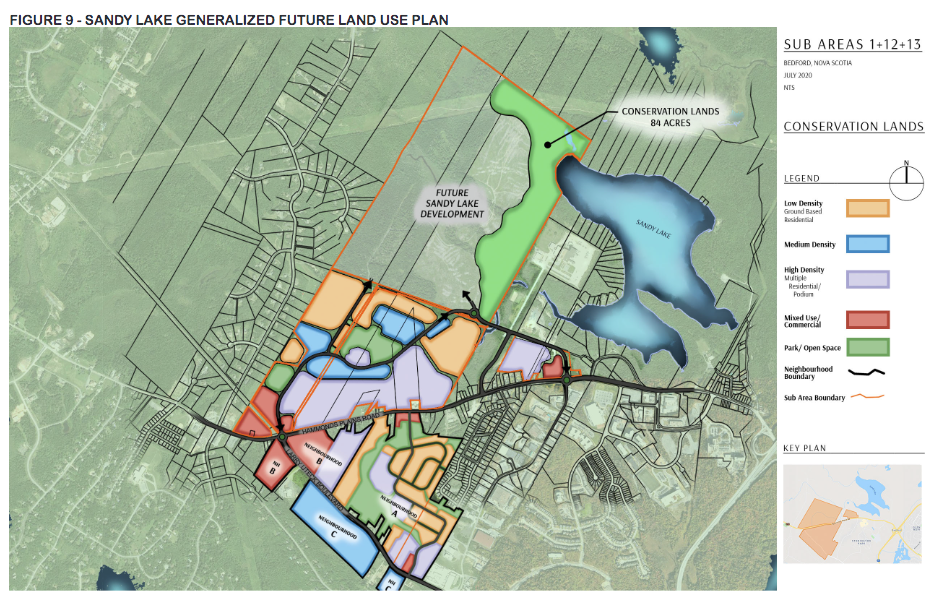 The coloured areas below Hammonds Plains Road are in Sub Area 12, not part of the Sandy Lake development, but most of the area lies within the Sandy Lake watershed. It is not, however, included in the Sandy Lake Study Area, so is not considered in the related Watershed study and LSA.
From the C30 document, italics inserted:
Regional Plan Review Considerations
• The Preliminary Population and Housing Analysis has shown that there is a need for additional land to accommodate HRM’s growing population. Population growth since 2016 and expected continued growth has put pressure on the HRM’s housing market availability.
• Future development must consider the objectives of the Integrated Mobility Plan to support transit-oriented development, support the Halifax Green Network Plan’s objectives to adequately protect wilderness area and connections, and follow policy guidance found in HalifACT2050, Sharing Our Stories and Halifax Water’s Infrastructure Master Plan.
• There is public support for greater protection of the lands for their ecological value and the water quality of Sandy Lake.
• Proposed housing units (estimated): 6006 units (estimated at 9 units per acre, as proposed by Clayton Developments)
4. Details of the 2024 Limnological Observations are presented in these four pages on this website:
(i) versicolor.ca/sandylakebedford/Surface Waters/Sandy Lake/
Limnological Profiles
and
(ii)…Limnological Profiles/
2024 Limnological Profiles – return to historic trend of declining oxygen
and its subpages:
(iii) Addendum 1: Trends in Conductivity/Salt Content
(iv) Addendum 2: On Wetlands
5. The limnological profiles consist of measurements made with a Water Quality Multimeter of temperature, conductivity (a measure of salt content), oxygen and (sometimes) pH at 1 meter or shorter depth intervals at the deepest spot in the lake.
Beginning in April of 2022, we conducted our observations under the umbrella of the newly formed HRM LakeWatchers program, which allowed us to make the observations within more consistent time intervals – prior to that, the equipment was borrowed from community equipment banks and we could not always get it at the desired sampling times.
Sandy Lake is one of 72 Lakes that had been “assessed as either highly vulnerable or moderately vulnerable through a previous study” and were selected initially to be included in the LakeWatchers Program. The Vulnerability Class for Sandy Lake was “Class A – High Vulnerability” and the Priority Concerns concerns were identified as “Eutrophication” and “Bacteria Contamination (Beaches)” – Table 9, p 53 in HRM Water Quality Monitoring Policy and Program Development (AECOM 2020)*. As Sandy lake is a “Class A — High Vulnerability Lake”. 2 sampling events per year are prescribed (Table 12, p 66)
– once in spring during mixed-water column conditions [our samplings have been in April which is at or following spring turnover of the water column]
– once at the end of summer [our sampling have been in the latter part of August which is close to the time of peak summer stratification]
In addition to the limnological profiles at the deepest spot in the lake, the observations at the deepest spot under the LakeWatchers program include a secchi disk measure of water transparency, top and near-bottom water samples analyzed for TP (Total Phosphorous, and chloride (near bottom sample only). Also, surface water near the outlet is sampled: measurements are made with the Multimeter as described above but there is only one surface water measurement ; and a water sample is taken and analyzed for TP ( the spring sample only) and chloride. Measurements of chlorophyll-a in water samples are sometimes made for some or all samples or none; likewise E.coli counts are sometimes made on some surface water samples.
* Halifax Regional Municipality Water Quality Monitoring Policy and Program Development, Prepared by: AECOM Canada Ltd., September 2020, 99 pages + Appendices, 505 pages total. Also view Environment & Sustainability Standing Committee June 3, 2021 SUBJECT: Water Quality Monitoring Policy & Program Development (14 pages)
6. Identifying lake water quality trends and effective monitoring strategies in a rapidly urbanizing region
Doucet, C., 2022, [Master of Applied Science, Dalhousie University]. http://hdl.handle.net/10222/82119. The thesis has two Results Chapters. CHAPTER 2 – SYNOPTIC SNAPSHOTS: MONITORING LAKE WATER QUALITY OVER FOUR DECADES IN AN URBANIZING REGION. This chapter is the basis of a significant paper for which Doucet is first author: Synoptic snapshots: monitoring lake water quality over 4 decades in an urbanizing region C. Doucet et al., 2023. In Lake Reservoir Management. “Synoptic water quality surveys—measuring major ions, nutrients, pH, organic matter, and trace elements—have been conducted in ∼50 lakes in the Halifax Regional Municipality (Nova Scotia, Canada) once per decade since 1980. In this study, lake water quality over 40 yr was examined and urban development was evaluated as a possible driver of observed changes.” Sandy Lake (Bedford) was one of those 50 lakes.
CHAPTER 3 – TRACKING TROPHIC STATE IN URBAN LAKES IN A CHANGING CLIMATE: ARE EXISTING MONITORING PROTOCOLS STILL EFFECTIVE? This chapter has not yet been published. From the Abstract: Trophic state parameters were tracked over the 2021 open-water season in fifteen lake basins in the Halifax Regional Municipality (HRM), Atlantic Canada, to examine relationships among productivity, nutrient dynamics, thermal stratification, and hypolimnetic anoxia.” Two of those lake basins were in Sandy Lake (Bedford).
7. See A DRAFT Report On the State of Sandy Lake, the Historical Trends and its Future Trajectory (Page on this website). There is also an extended summary.
8. See Quantified Hypoxia and Anoxia in Lakes and Reservoirs
by Gertrud K. Nürnberg in The Scientific World Journal (2004) 4, 42–54. “2mg L–1 measured by a DO probe about 1 m above the sediment usually coincides with anoxic conditions at the sediment surfaces located at that depth.”
9. See 2024 Limnological Profiles – return to historic trend of declining oxygen (Page on this website)
10. See discussion under 2024 Limnological Profiles – return to historic trend of declining oxygen “(ii) There is increased likelihood that intervals of hypoxia (low oxygen) in deep water could result in anoxic conditions (no oxygen) at the sediment surface and associated mobilization of phosphorous, accelerating eutrophication and marked deterioration of water quality…”
11. See, e.g., Anoxia begets anoxia: A positive feedback to the deoxygenation of temperate lakes by A. Lewis et al., 2023 in Global Change Biology,

Fig. 1. Profiles for Temperature, Dissolved Oxygen and Total P at the deep site in Aug 2021 shown in Doucet (2022), reproduced with permission. Identifying lake water quality trends and effective monitoring strategies in a rapidly urbanizing region. Doucet, C., 2022, [Master of Applied Science, Dalhousie University] Profiles for Sandy Lake are shown in Electronic Supplement 3.
12. Casey Doucet’s profiles for Sandy Lake in late August 2021 are shown at right. Note in the middle figure the dip in oxygen at about 6 m depth.
13. See 2024 Limnological Profiles – return to historic trend of declining oxygenfourteen
14. See Metalimnetic Oxygen Minima (page on this website) for an extract from Wetzel’s Limnology, 3rd ed. (2001), pp159-160.B. Metalimnetic Oxygen Minima; “The converse condition [to a metalimnetic oxygen maximum] a metalimnetic oxygen minimum exhibiting a negative heterograde curve (Fig. 9-5b)*, is much less frequently observed…” Other literature on the MOM (Metalimnetic Oxygen Minima) is also cited on this page. In regard to Nova Scotia: “I have not been able to locate any studies specifically referencing Metalimnetic Oxygen Minima in Nova Scotia which may indicate that to date it has not been a common phenomenon. Regardless, climate warming and increasing urbanization could lead to its more common occurrence. In Brylinski’s 2002 report on the Nova Scotia Lake Hypolimnion Project, Metalimnion Oxygen Minima appear to present in 4 of the 20 lakes surveyed (profiles are given in Appendix III). As mentioned above, of the 4 lake profiles for HRM area lakes presented by Doucet 2022 that were 15 m and greater, distinct dips in the metalimnion oxygen were present in the two (one of them Sandy Lake) that also exhibited very low oxygen and highly elevated total P levels near the bottom.” – from 2023 Limnological Profiles, effects of episodic precipitation, and occurrence of a Metalimnetic Oxygen Minimum in Sandy Lake (Bedford, NS) (page on this website). As well, I discussed the phenomenon with the late Don Gordon and with Shalom Mandeville, both did not know of any formal documentation of MOMs in Nova Scotia.
15. See: Canadian Water Quality Guidelines for the Protection of Aquatic Life DISSOLVEDOXYGEN (Freshwater). Canadian Environmental Quality Guidelines Canadian Council of Ministers of the Environment, 1999. From that document:
“The Canadian water quality guidelines for the lowest acceptable DO concentrations are 6 and 5.5 mg·L-1 for the early and other life stages, respectively, in warm-water ecosystems, and 9.5 and 6.5 mg·L-1 for the early and other life stages, respectively, in cold-water ecosystems. The guidelines were derived from the U.S. Environmental Protection Agency’s “slight production impairment” estimates (USEPA 1986), with an additional safety margin of 0.5 mg·L-1 to estimate threshold DO concentrations.”
16. “The intensive metalimnetic respiration in lakes forming a MOM can be expected to accelerate nutrient cycling close to the photic zone and thus, may further stimulate primary production.” – from Krelling et al., The importance of physical transport and oxygen consumption for thedevelopment of a metalimnetic oxygen minimum in a lake. Limnol. Oceanogr. 62, 2017, 348–363.
17. Spring Total P values in Oligotrophic to low Mesotrophic range: View (i) values of Spring Total P for Sandy Lake 1980 to 2021 in Synoptic snapshots: monitoring lake water quality over 4 decades in an urbanizing region, Supplemental Material by Doucet et al. 2023 in Lake and Reservoir Management; (ii) Values for Total P 1979-2014 in AECOM 2014, Fig 8, page 22 (spring values only) & Fig 9, page 24 (all values) (iii) Total P spring values, 2022 onward: 2022 – 5.3 ug/L; 2023 – 10 ug/L; 2024 6.6 ug/L at the outlet (see Limnological Profiles).
18. See Trophic States of Lakes (page on this website) for a description of features associated with different lake Trophic Levels.
19. From AECOM 2014, page iii, bolding inserted:
The predictions from the phosphorus load model are consistent with observations of urbanization in other watersheds. However, the degree of influence of urbanization on water quality in Sandy Lake can only be approximated using the phosphorus load model because of limitations arising from assumptions and uncertainty in the application of the model. Therefore a robust water quality monitoring plan is proposed for the Sandy Lake watershed to provide a further assessment of current conditions and to evaluate the impacts of development on the water quality.
20. From AECOM 2014, p. 21:
Total phosphorus in Table 3 ranged from 2 ug/L to 43 ug/L between 2006 and 2013 (Figure 8). The median concentration of total phosphorus is 12 ug/L, which places the current water quality of Sandy Lake in the lower end of the mesotrophic range. This indicates the lake water quality is good and has moderate biological productivity.
From AECOM 2014, p. 31:
For the Sandy Lake watershed AECOM recommends the use of Environment Canada’s trophic status classification to set WQOs for total phosphorus. As noted in section 1.2.1, an objective of the 2006 HRM Regional Plan is to “maintain the existing trophic status of our lakes and waterways”. This suggests that both Sandy and Marsh Lakes should be maintained in their current mesotrophic state and so the WQO for total phosphorus should be the upper limit of the mesotrophic range, or 20 ug/L. However, since both lakes are currently at the lower end of the mesotrophic range, considerable water quality degradation could occur before the lakes were at risk of exceeding such a WQO
21. ‘Shallower and Smaller Lakes are more prone to oxygen deficiency than Deeper and Larger lakes’, see for example,
– For a set of Ontario lakes, Malot et al., 1992 observed that “lake morphometry exerts a large influence on profiles and this influence is particularly evident in shallow (<20 m maximum depth) oligotrophic lakes” and that “Predictions of O2 profiles are sensitive to changes in TP concentrations, with all study lakes predicted to have severely O2-depleted hypolimnions by the end of summer at an epilimnetic TP of only 15 ug.L-1.”
– Extracts from the comprehensive review of Nutrients and Algae Water Quality Guidelines by the B.C. Ministry of Environment and Climate Change Strategy:
A small lake which is stratified and has a phosphorus concentration greater than 10 or 15 ug/L generally has some degree of hypolimnetic oxygen depletion which may be a constraint to fish habitat (loss of cool water refuge) or food supply (particularly change in benthos)…
Some lakes may have marginal hypolimnetic oxygen concentrations at concentrations of phosphorus as low as 7 or 8 ug/L (Nordin and McKean 1984).
22. See: Longer duration of seasonal stratification contributes to widespread increases in lake hypoxia and anoxia, by Jane et al. 2023 in Global Change Biology
23. Document C030 – Sandy Lake, date 2021. Posted on HRM website
“Request by Sandy Lake Holdings (Clayton Developments) for a new serviced mixed-use (residential/ commercial) community”
24. See Sandy Lake Water Sources (page on this website),
25. See AECOM 2014, Appendix A Section 3: Hydrology (PDF page 81)
26. “Ecological Features Assessment and Unanimous…” See:
Sandy Lake Ecological Features Assessment
72 page document prepared for HRM by McCallum Environmental Ltd. June 27, 2022
View announcement and document
– July 12, 2022 Halifax Regional Council Agenda
15.1.10 Case 23952: Sandy Lake Ecological Features Assessment [Large 10 Mb PDF]
Motion:
That Halifax Regional Council direct the Chief Administrative Officer to:
1. Incorporate the analysis and findings of the Sandy Lake Ecological Features Assessment in the planning and development of Sandy Lake Park.
2. Review and use the findings of the Sandy Lake Ecological Features Assessment in the background studies being undertaken for the Sandy Lake Special Planning Area, including organizing the form and location of development to best protect:
a. the suggested widths for important corridors,
b. the suggested riparian and watercourse buffers, and
c. the identified areas of predicted old or mature forest.
3. Explore the use of conservation easements as part of the Sandy Lake Provincial Special Planning Area background studies to manage ecological features or corridors that extend outside of the conceptual park boundary.
4. Assess how to best organize land use and green infrastructure as part of the Sandy Lake Provincial Special Planning Area Background Watershed Study to mitigate any downstream impacts to the Sackville River and Sackville River Floodplain.
Council passed the boundary study motion unanimously (moved by Counc. Blackburn, Seconded by Counc. Outhit)
It was MOVED by Councillor Blackburn, seconded by Deputy Mayor Lovelace
THAT the motion be amended to include the words “at least” to the beginning of sections 2(a) and
2(b).
MOTION TO AMEND PUT AND PASSED. (12 in favour, 3 against)
Link to Minutes
Link to Council discussions vote: https://www.youtube.com/watch?v=Lc_IcYMRJ44
In regard to item 2a above (the suggested widths for important corridors), from page 3 of Item No. 15.1.10 Halifax Regional Council July 12, 2022:
Landscape Connectivity
Corridors that allow wildlife to move through the study area were also analyzed. The relationship to wildlife movement at a regional scale is considered through the Halifax Green Network Plan, the Sandy Lake Ecological Features Assessment also considered the Wildlife Corridor Landscape Charette, which can be found on the Regional Planning website, and is catalogued as submission C1142. The Sackville River was identified as an important and essential corridor for its role in providing aquatic connectivity downstream. An important corridor was also identified along the west side of Sandy Lake that provides a connection for wildlife from the south of the study area to the Sandy Lake Regional Park. The Green Network Plan identifies that wherever possible, a width of 100 m should be maintained for Important Corridors and 1,000m for Essential Corridors.
In regard to item 2 b above, (the suggested riparian and watercourse buffers) were respectively 100 m and 50 m (re: page 3 in Item No. 15.1.10 Halifax Regional Council July 12, 2022; and page 33 in the Sandy Lake Ecological Features Assessment attached to Item No. 15.1.100
In regard to item 2c above, (the identified areas of predicted old or mature forest), Fig 7 on page 28 in the Sandy Lake Ecological Features Assessment identifies areas of predicted old and mature forest.
27. Draft LSA:
Click on image for the Report
A link to the Report is posted on Halfax Future Service Commununities (https://www.shapeyourcityhalifax.ca/futureservicecommunities)
From the Introduction to that page:
“The Regional Plan Review has identified the need for additional serviced lands to accommodate population growth. With provincial funding support, the municipality is conducting a series of technical studies to inform decisions about potential serviced development in four study areas. Stantec has been awarded the contract to conduct the Future Serviced Communities Studies through a request for proposals process. The four locations being studied are:<//small>
– Lands to the west of Sandy Lake in Bedford;
– Highway 102 West Corridor lands in Halifax;
– Lands southeast of Morris Lake in Dartmouth and Cole Harbour; and
– Lands including and immediately surrounding the former Nova Scotia Home for Colored Children (now owned by Akoma Holdings) in Westphal.”
Under Project Status:
“Stantec has made significant progress on the study’s environmental, servicing, and transportation study components. Fieldwork and stakeholder consultations are now complete and drafts of study components are being provided to the Municipality for technical review. The draft land suitability analyses (LSAs) are being published as they are completed to share the study’s progress and provide an opportunity for review of the technical information. While the LSAs are of high quality, they are early drafts for review, subject to change, and do not yet provide the full picture of the suitability of the lands for development pending the completion of the remaining watershed, servicing, and transportation components of the study.“
Screen Capture from Halfax Future Service Commununities webpage
28. I have visited most of the larger wetlands and watercourses associated with Sandy Lake, on Sandy Lake itself, some of those associated with with Peverill’s Brook and Marsh Lake downstream. I routinely measured Electrical Conductivity of the watercourses/waterbodies to get a sense of where urban pollutants are coming from. View descriptions, photos etc. on these pages:
– Sandy Lake Wetlands Photo Albums: Sandy Lake (Bedford, NS): Wetland Fringe, SL: Marsh Lake/Peverill’s Brook
– Uplands Park WWTF
Photo Albums: Sandy Lake: Wetlands and Riparian areas to W & SW Oct 2, 2020 PART III
– Murphy’s Pit Convergence “an area of significant marshes/swamp and floodplain forest, also identified in the Natural Wonders Consulting Avian & Species at Risk Surveys as an area of Snapping Turtle movement and attempted, if not successful, breeding.”
| – W and SW of S. Lake Videos and GPS tagged photos of Wetlands and Riparian areas to W & SW of Sandy Lake, Oct 2, 2020 posted in Google Photo Albums: 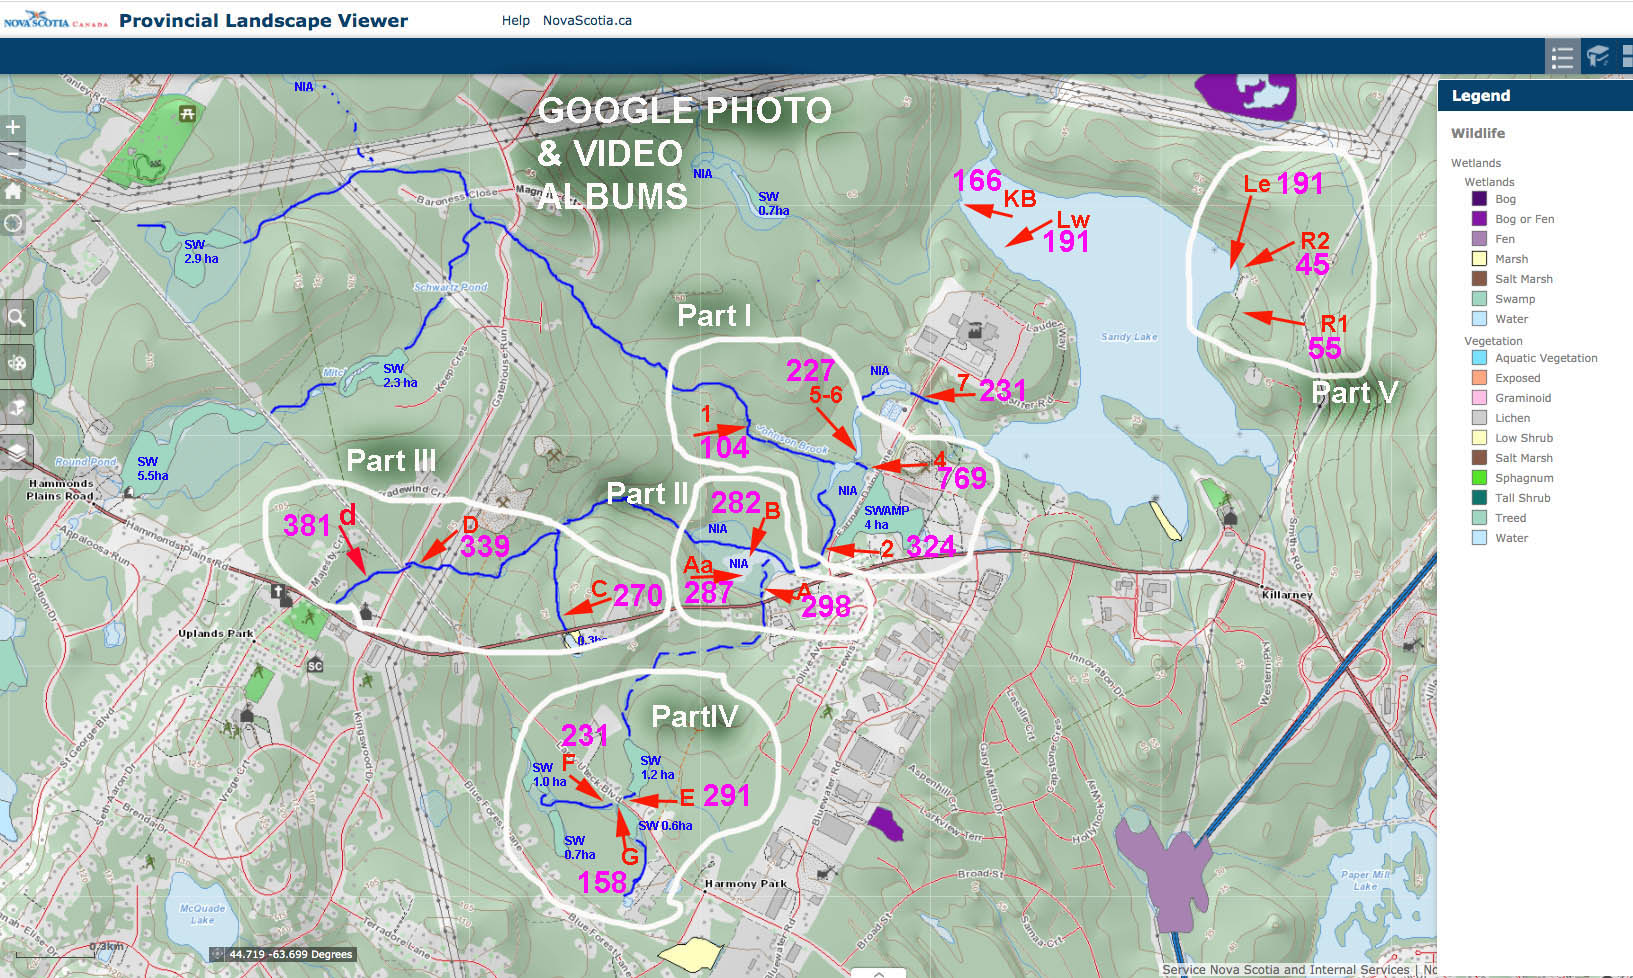 W and SW of S. Lake: Map showing locations of the respective Video Albums, watercourses, wetlands, electrical Conductivity values (uS/cm) on Oct 2, 2020. PART I – Johnson’s (Bob’s) Brook & Murphy’s Pit area; |
29. 50.8 ha: See Draft LSA, Table 3.1, page 5
30. “Removal of sediment and phosphorous is a well known benefit of watercourse wetlands:”, see, e.g.,
Economic valuation of suspended sediment and phosphorus filtration services by four different wetland types: A preliminary assessment for southern Ontario, Canada
by Tariq Aziz & Philippe Van Cappellen 2021 in Hydrological Processes
31. “…large unidentified sink for phosphorous in their budgeting for the Lake Capacity Model”:
See Critique of Predictions/No Followup Monitoring (page on this website): “(iv) Varying the phosphorus export coefficient, rather than increasing the lake retention coefficient would be a more realistic “fix” to make the model work and would likely increase the predicted impacts of development on Total P…”
32. Addendum 2 Wetlands, page on this website
33. No Benefit Scores in the Draft LSA: See Addendum 2: On Wetlands (page on this website), Section IIIf Wetland Function Scores are reported but not Wetland Benefits.
34. On siltation at Eisner’s Cove
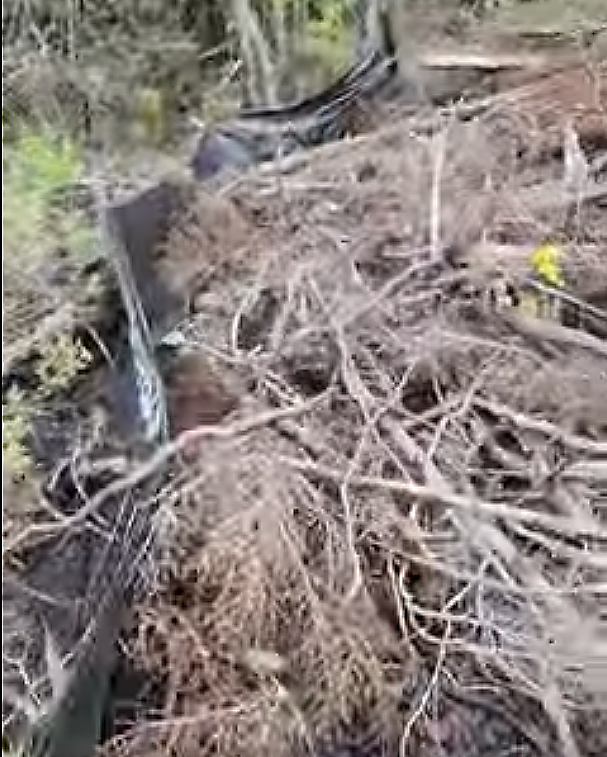 View YouTube Video Siltation Barrier fail by ProtectEisnerWetland “This is suppose to keep silt out of the wetland during deforestation… the barrier isn’t even buried” Posted Aug 28, 2022 |
 Siltation in Eisner Cove Wetland visible on July 24, 2023. View Video The uplands were clearcut by earlier on; The LSA/EAs failed to recognize any connections between the upland and the fen (View comments). Photo & Video courtesy of Bill Zebedee/Protect Eisner Cove Wetland |
35: On efficacy of CWs (Constructed Wetlands). NS has quite a lot of experience with CWs, especially via Ducks Unlimited programs which have been going on for a long time, however I am not aware of much documentation of their efficiencies and comparisons with natural wetlands. Published studies have shown both higher and lower efficiencies of CWs compared to natural wetlands.
Some relevant papers:
– Evaluation of Treatment Potential and Feasibility of Constructed Wetlands receiving Municipal Wastewater in Nova Scotia
by Leslie Gray, 2008. Earth and Environmental Sciences Undergraduate Honours Thesis, Dalhousie University
– Source or sink? Meta-analysis reveals diverging controls of phosphorus retention and release in restored and constructed wetlands
Ury et al., 2023 in Environmental Research Letters
– Efficiency of mitigation measures targeting nutrient losses from agricultural drainage systems: A review
Carstensen et al., 2020 in Ambio.
36. Salts: see Addendum 1: Trends in Conductivity/Salt Content
38. See the NS Gov. document Wetland Compensation: What’s Required and What Are My Options
39.Establishing realistic management objectives for urban lakes using paleolimnological techniques: an example from Halifax Region (Nova Scotia, Canada) Ginn et al., 2015 in Lake and Reservoir Management. Sandy Lake was one of the 19 with observations most closely linked to climate warming.
40. Re: “…the lake to be subject to repeated closures to swimming due to algal blooms such as the green algal bloom which occurred in 2019 and possibly BGA blooms as well”:
I happened to be at Sandy Lake Beach Park on the morning of Aug 6, 2019, shortly after the beach area was inundated with an unpleasant suspended, reddish, soapy material. View details in this post: Sandy Lake inundated by unpleasant, suspended, reddish, soapy material Aug 6, 2019; and lake level falling quickly. It was a green algal (diatom) bloom, not a BGA (Blue-Green Algae), and the evidence suggest it followed removal of a beaver on upper Peverills Brook, and I speculate that the sudden rush of water led to some breakdown in the thermal stratification, bring phosphrous-rich water from the epilimnion to the surface. It subsided within a few days, once the water level stabilized at a lower height.
There has been some controversy about this bloom and whether there have been any BGA Blooms in Sandy Lake to date. (BGA are Blue-Green Algae, more correctly Cyanobacteria.) At a meeting of the NW Community Council on June 12, 2023 at which I made a presentation about the State of Sandy Lake, Councillor Tim Outhit said that I was wrong in attributing the 2019 bloom to green algae (diatoms) when in fact, he said HRM tests showed it was due to pollen. However, my follow-up with HRM staff (see Post Mar 21, 2023) confirmed that the 2019 event was consistent with the presence of diatoms as I had understood from HRM via Tim Outhit and my own observations at the time (Post, Aug 7, 2022).
At that meeting I also mentioned the BGA warning for Sandy lake that was cited in the Chronicle Herald on June 27, 2022. (See post Blue-green algae warning for Sandy Lake (Bedford) underscores concerns about ongoing and proposed development around the headwaters 28Jun2022/ Councillor Outhit said that testing subsequent to the the BGA warning had shown that in fact there were not BGA present, admonishing me for citing it. My response was that I was not aware of any reports on subsequent testing. (Following the warning, I had asked the lifeguards about subsequent testing and they didn’t know of any, nor did residents on the lake that I questioned at the time as I liked to take grandchildren there to swim.) In followup correspondence with HRM staff, I received this reply: “…The bloom that NSECC reported in Sandy Lake in 2022 was observed in late June. I went out and checked it because it was within a week of our beach season opening, and was able to confirm it wasn’t toxin-producing cyanobacteria. HRM wouldn’t have made any notice regarding this bloom, because we only monitor and issue notices at our supervised beaches during the time they are supervised, July 1 – August 31.” So there were no public notices at the time, and Councillor Outhit did not share this information with me nor apparently with lakeshore residents I had questioned at the time.
Subsequently, l learned that the province “only inspect/confirm BGA reports that are in lakes that supply a public water supply…We take the report from the public and identify it on the web as a report but we do not confirm. We alert recreational facilities located on or associated with the lake (guarded beaches, boat clubs, camps etc) of the report and they follow their own procedures for verification and management.” More details, documentation at the bottom of this post:Deep water oxygen levels in Sandy Lake (Bedford, NS) fall to precariously low levels 21Mar2023
So there have been no confirmed BGA warnings to date at Sandy Lake. However, BGA blooms are becoming more widespread generally, and we are seeing the conditions in Sandy Lake – warmer summer water temperatures, alterations in lake mixing and water levels, declines in dissolved oxygen – thought to be conducive to increased occurrences of BGA:
A striking consequence of climate change on aquatic ecosystems is that many are experiencing shorter periods of ice cover, as well as earlier and longer summer stratified seasons, which often result in a cascade of ecological and environmental consequences, such as warmer summer water temperatures, alterations in lake mixing and water levels, declines in dissolved oxygen, increased likelihood of cyanobacterial algal blooms, and the loss of habitat for native cold-water fisheries. – Lakes in Hot Water: The Impacts of a Changing Climate on Aquatic Ecosystems by Woolway, Sharma and Smol 2022 in Bioscience
41. “…the loss of some local habitat for a range of species including Snapping Turtle, a Species-at-Risk and degradation of its local migration corridors”: Documentation in Sandy Lake Ecological Features Assessment (2022), or pertinent extracts here.
42. “degradation of the wildlife corridor west of Sandy Lake”:
See Wildlife Corridors on this website.