
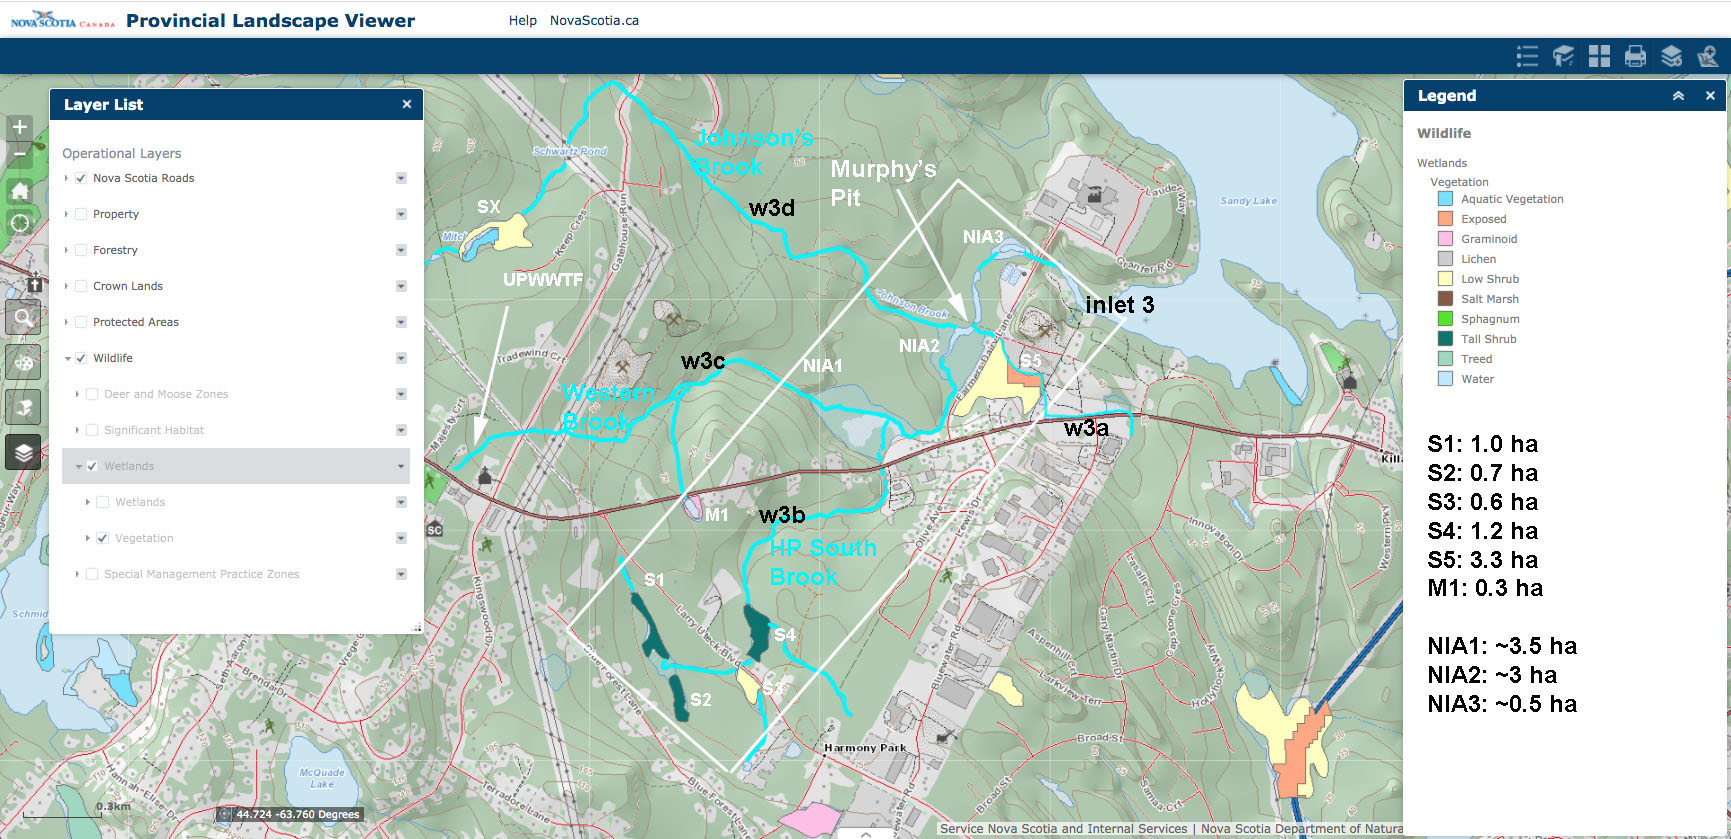
 “Swamp 5” refers to wetland S5 in this map of streams and wetlands SW of Sandy Lake. It has been highly degraded by industrial activity as shown in the Google Earth Images below.
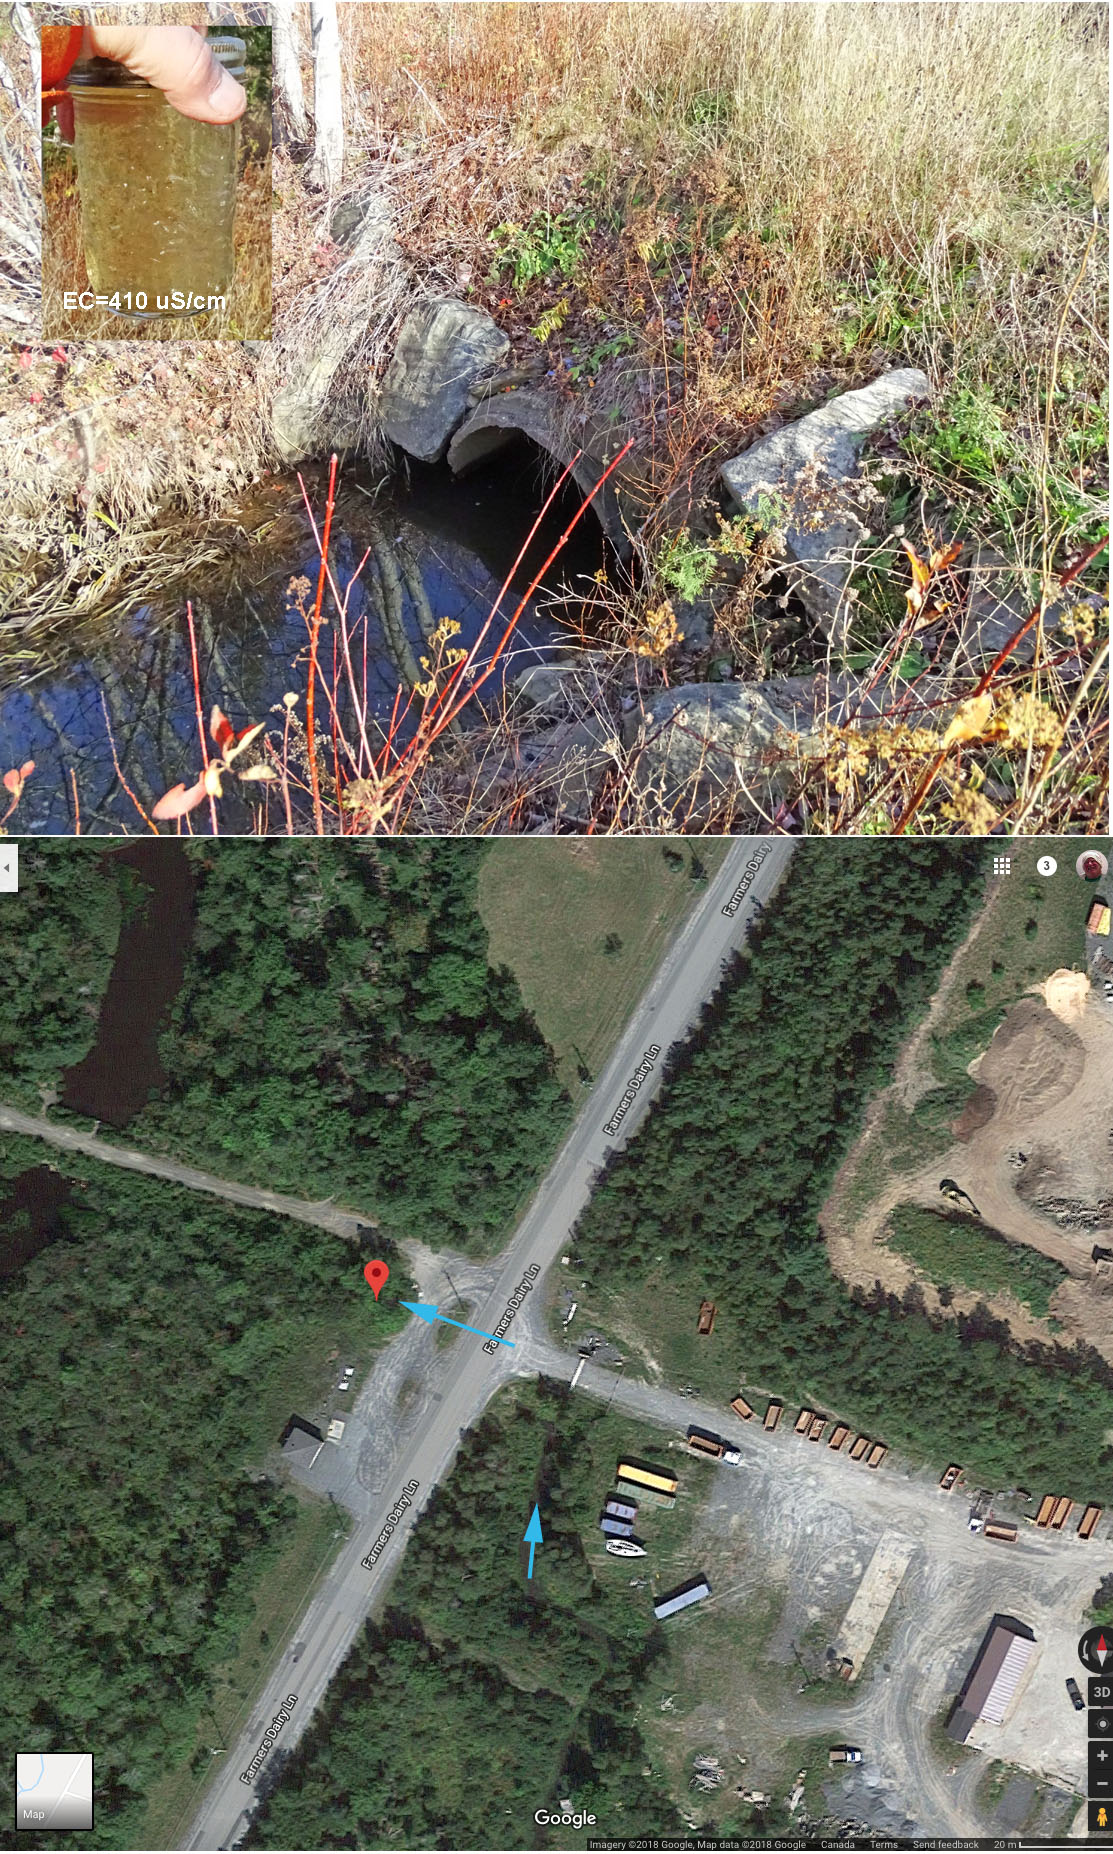
We have been monitoring water coming from the associated stream where it comes out of a culvert under the Dairy Road and then flows into Murphy’s Pit. It has consistently had the highest EC (Electrical Conductivity) values of any of the streams we have been monitoring, also the water is very turbid, sometimes quite milky with a lot of fine materials in it.
As well as from the swamp and the adjacent “working lands”, this outlfow is fed by waters from the area of the Atlantic Acres industrial park below Hammonds Plains Road – see Figures 2 and 7 in AECOM 2014.
For EC values, View:
Generally the flow out of the culvert and on into Murphy’s Pit is very low compared to other streams converging on Murphy’s pit, so while the water has a high salt content, its influence on salt content of Sandy Lake may not be very significant. However, the highly turbid and sometimes milky water is concerning and should be further investigated. There could be much larger flows carrying accumulated contamonants during significant storm events for example. It would be appropriate as well to do an ion analysis of the water to determine how much of the salt content is associated with road salt (indicated by chloride content), and if there are other constituents of concern in it.
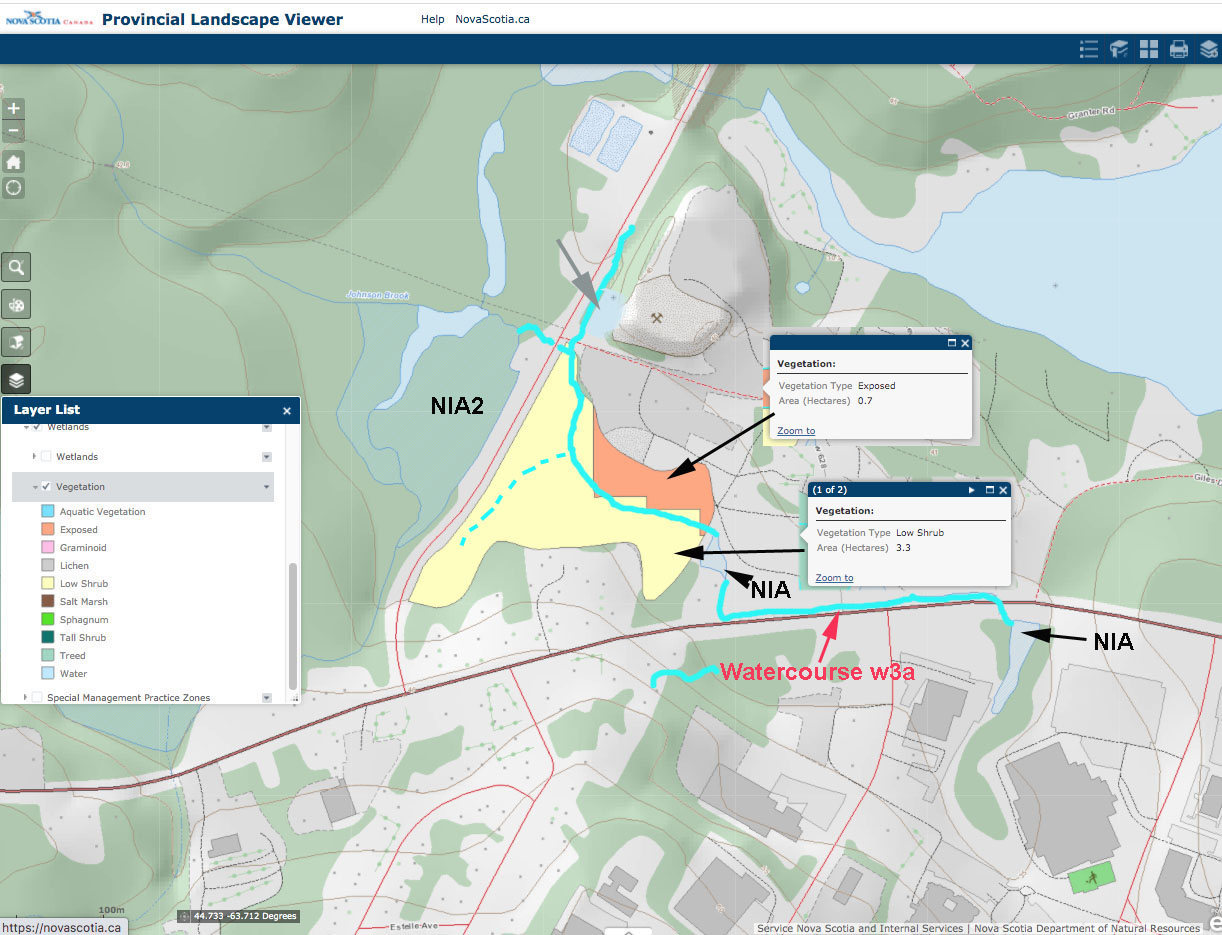
From the PLV, watercourse w3a highlighted. S5 is the whole area colored yellow and reddish brown. Broken lines: visible as distinct stream or drainage ditch in some Google Earth Photos, also the grey arrow points to a pond visible on some Google Earth Images
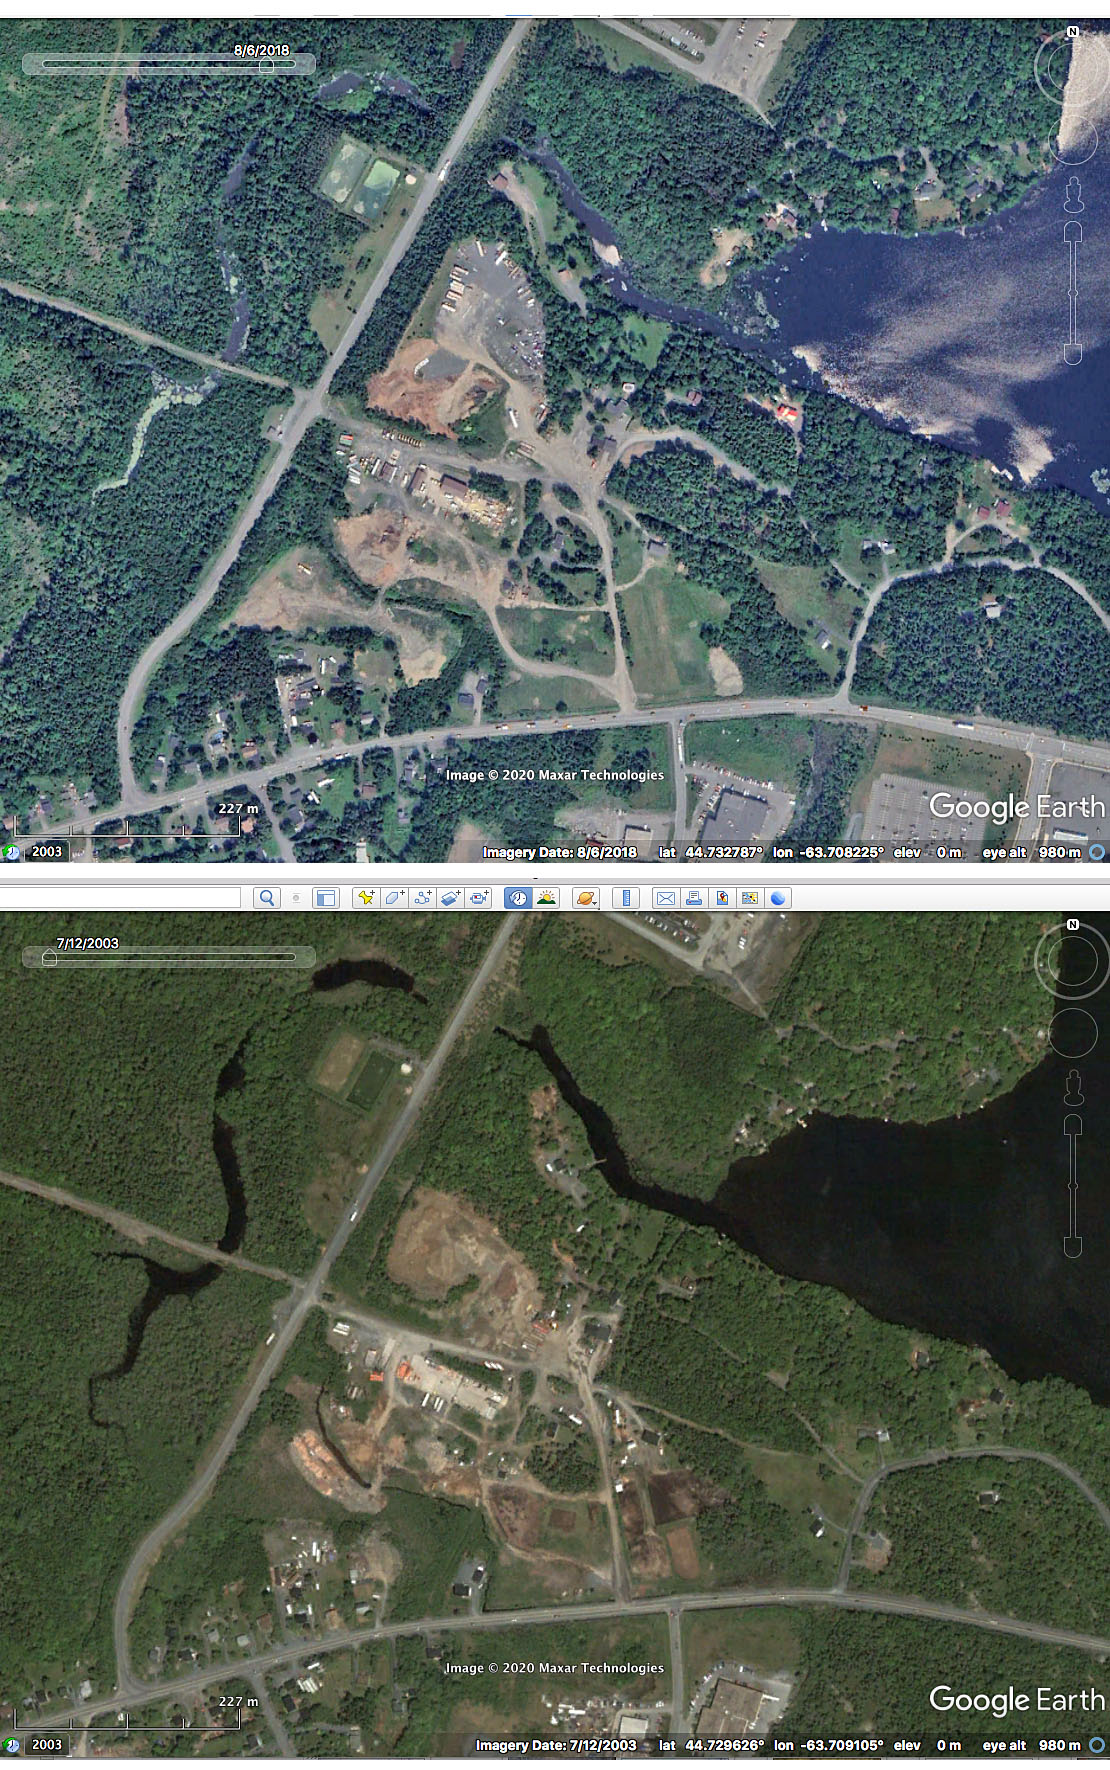
Google Earth Images 2018 above, and 2003 below
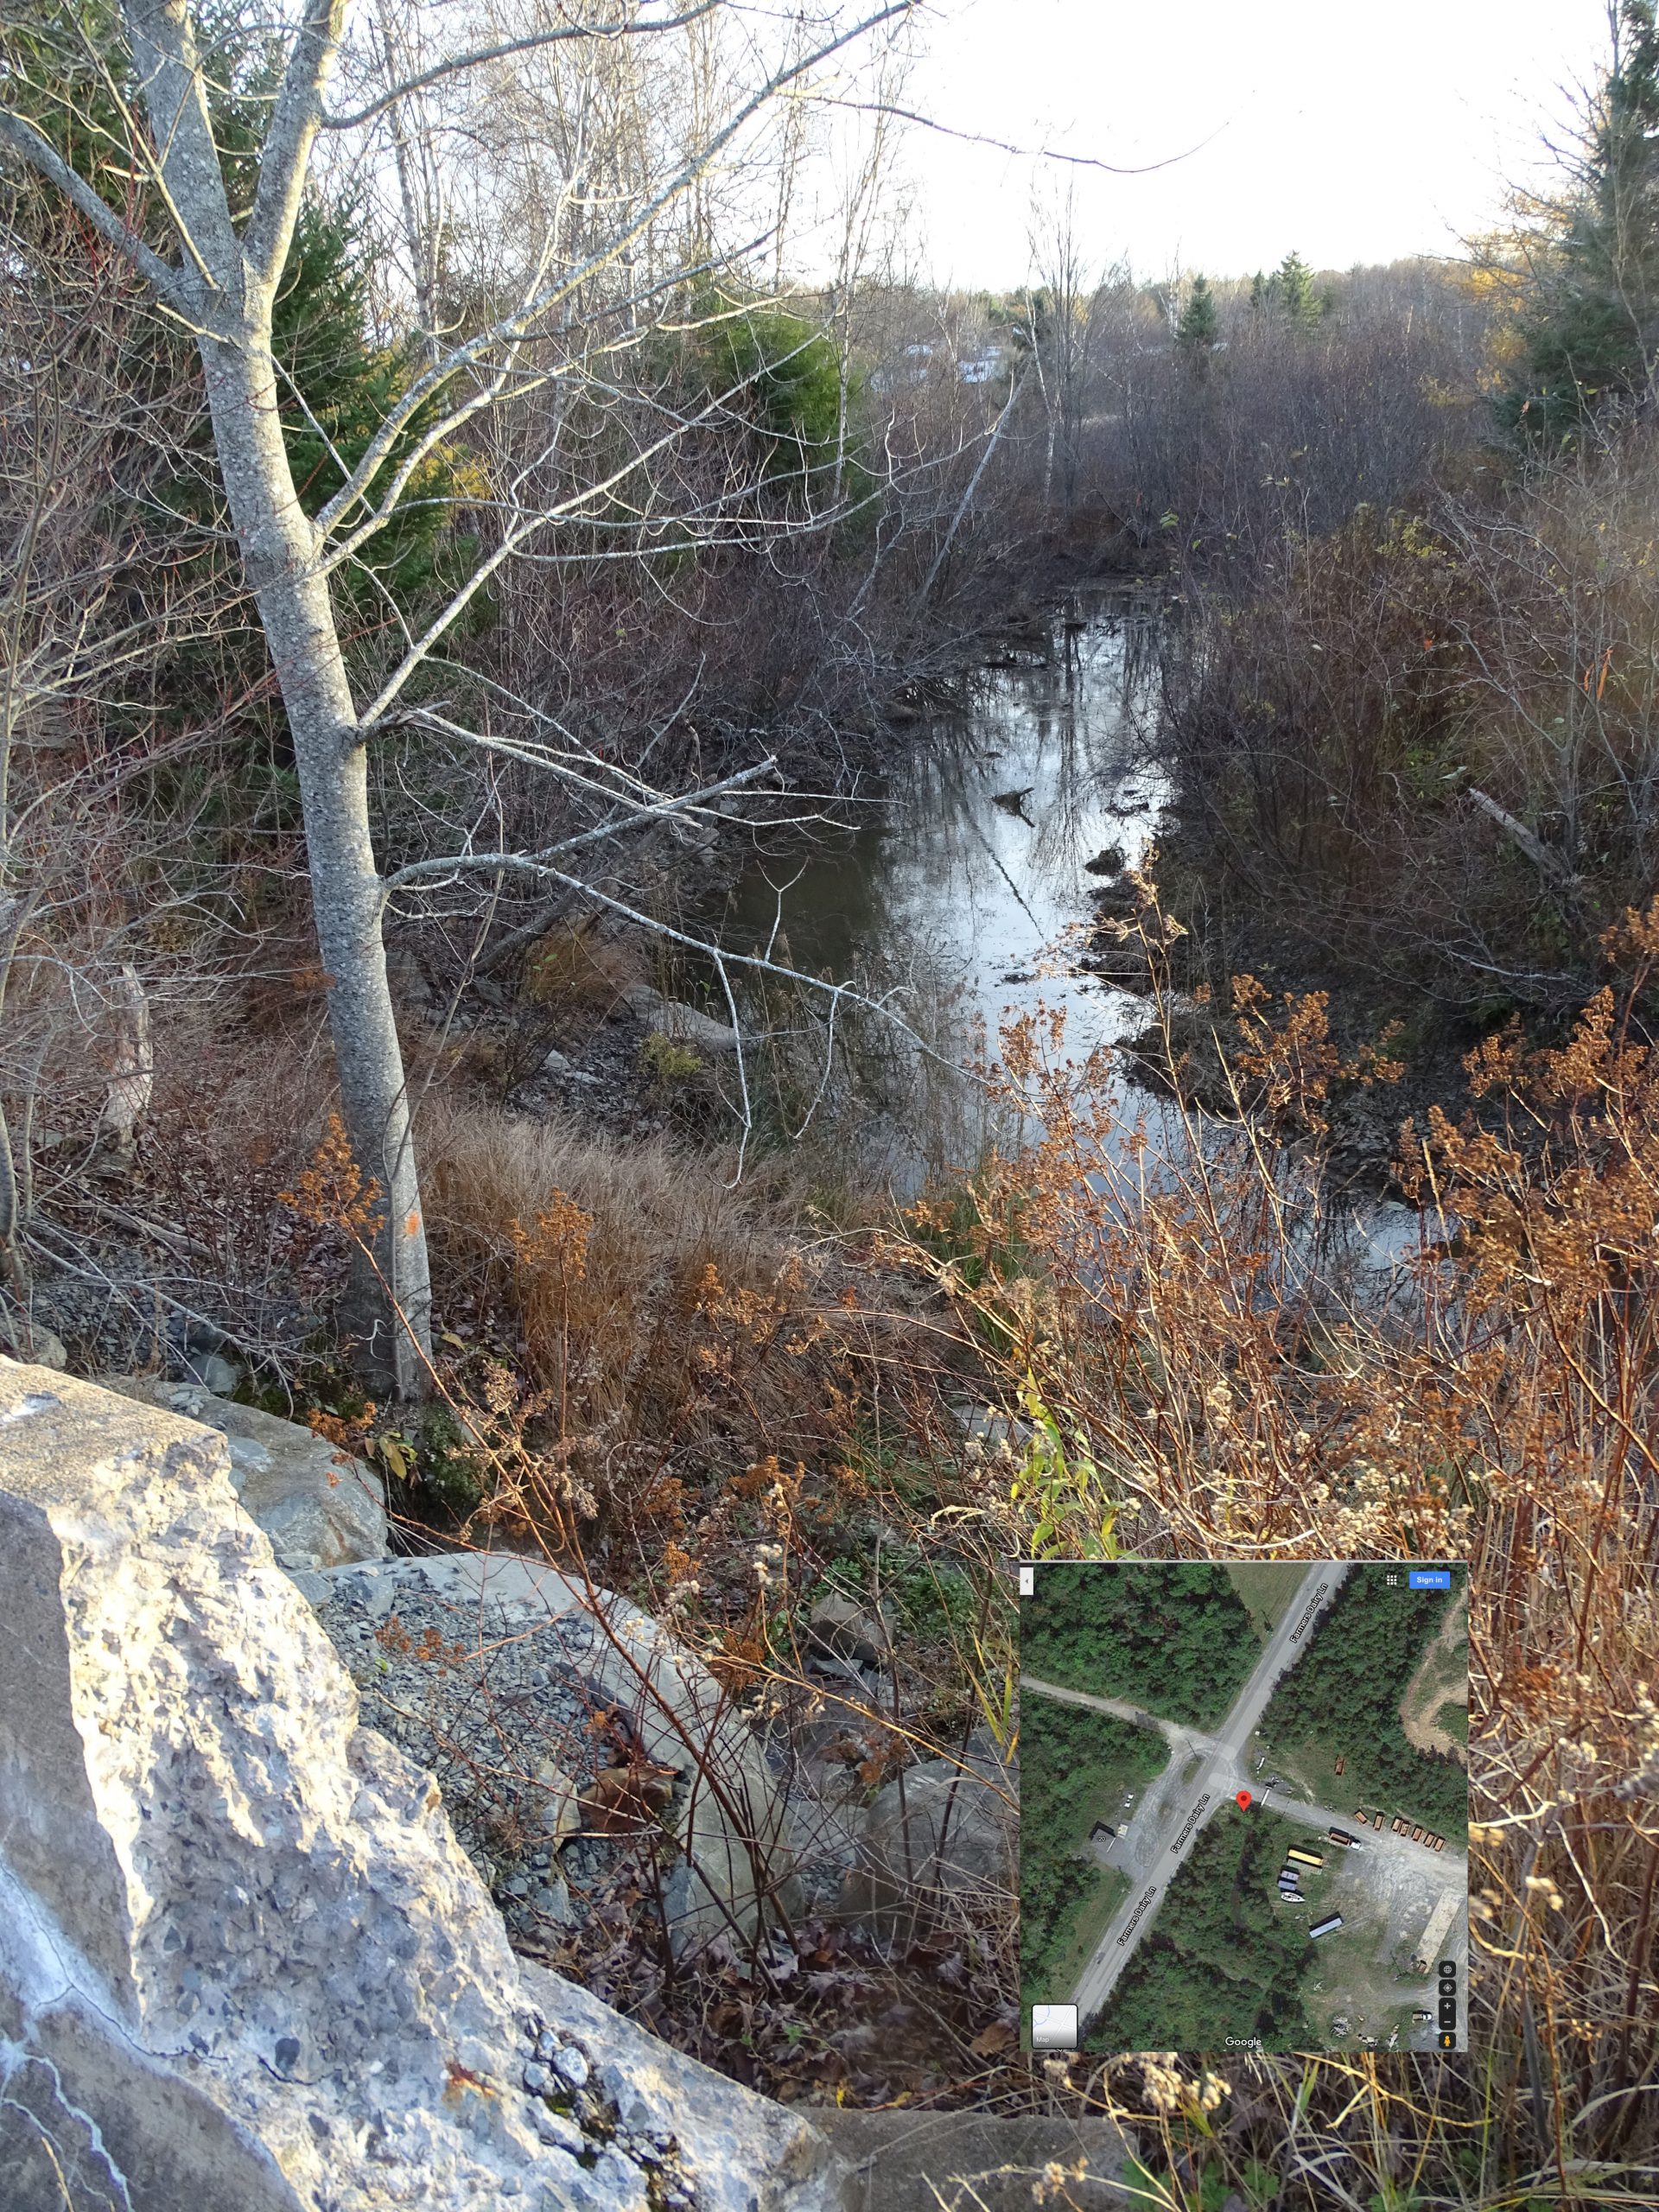
View of stream and swamp looking south from service road entering industrial area. Inset is Google Map image showing location of camera. Photo on Nov 8, 2018.
Maps accessed May 14, 2026:

From maps.google.com showing “Atlantic Acres”

From Provincial Landscape Viewer WAM predicted flows

From Provincial Landscape Viewer, Satellite View, WAM predicted flows