
NAVIGATION: Examples of “EC Monitoring” is a page on the website Sandy Lake & Environs (Bedford, Nova Scotia) (www.versicolor.ca/sandylakebedford). It is posted under the top level menu item Surface Waters, full URL: https://versicolor.ca/sandylakebedford/waters/ec-notes/examples/
RELATED PAGES
– EC (salt) Notes
– Examples of “EC Monitoring”
– Lake Stratification & EC/salt content
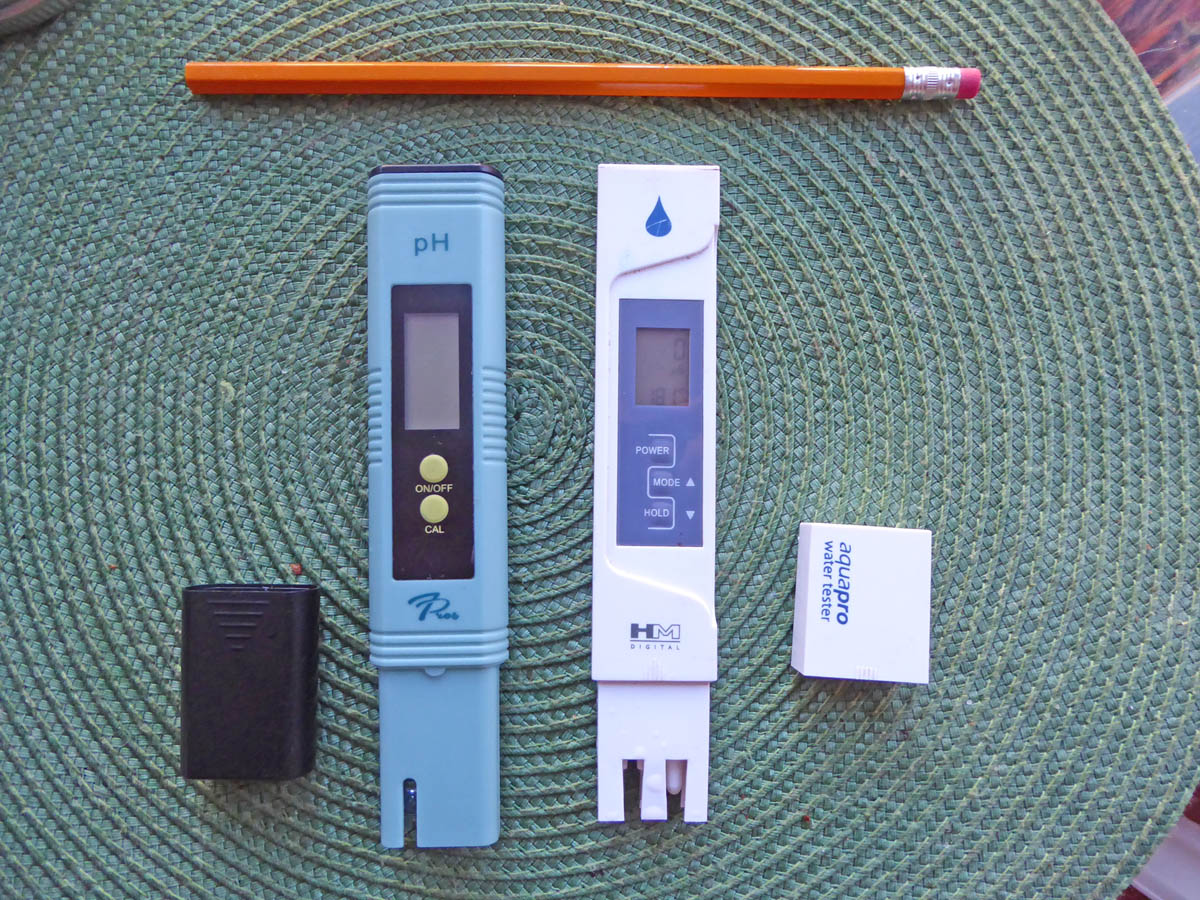
Pocket meters used for EC and pH measurements. pH meter comes with pH 4 and 7 calibration solutions. I use a 342 (533 uS/cm) ppm calibration solution to check the EC meter (it is factory calibrated). More details on the pH meter here.
I routinely measure electrical conductivity on watercourses that I encounter, and pH of some of them. The EC measurement are made with a pocket HM Digital Aquapro Water Tester AP-2 which measures electrical conductivity and temperature.*
*Available at amazon.ca (C$32.59 on Apr13, 2026)
It is inserted directly in the water or a sample is placed in a jar and the measurement made immediately.
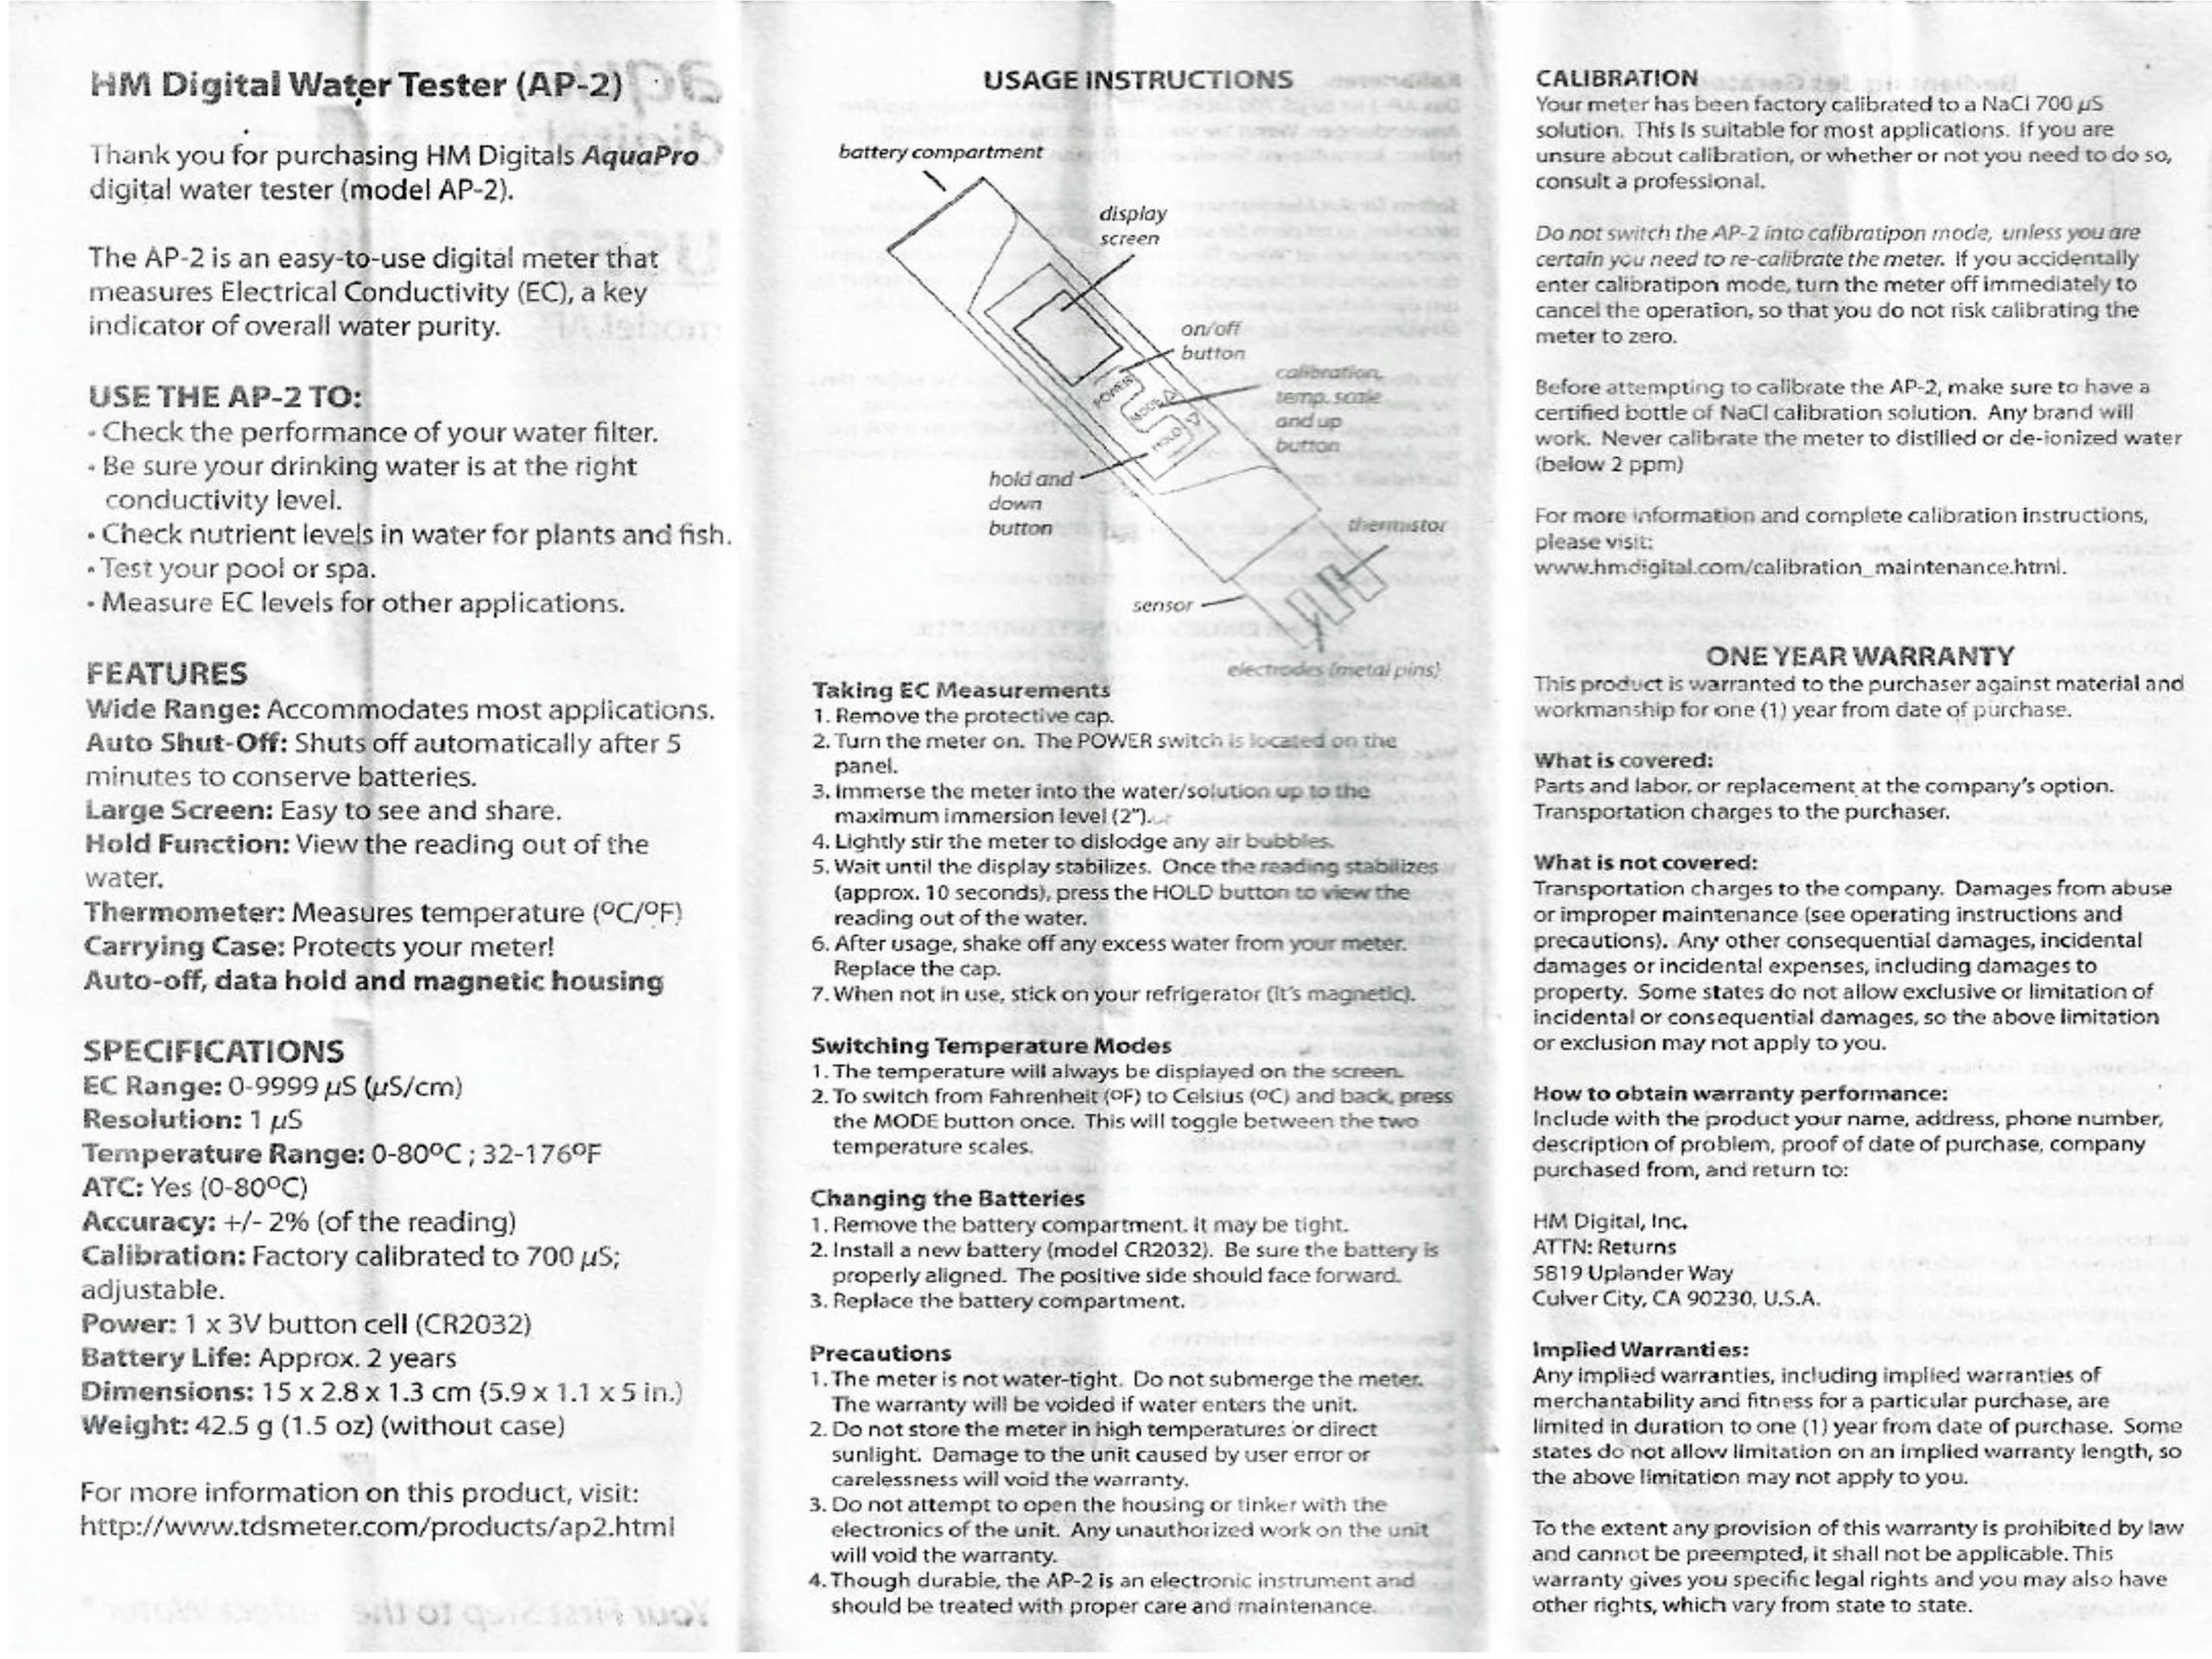
I purchased this piece of equipment in June of 2017 specifically for this purpose (cost ~$30). It was factory calibrated with a 700 µS standard. According to the manual, readings are temperature compensated, so they are Specific Conductance values (Electrical Conductivity at 25 deg C).* I had no technical issues using it and measurements on a reference sample of tap water and/or a 342 (533 uS/cm) ppm calibration solution were consistent over time.
I purchased a second Aquapro Water Tester in July of 2020 and gave it to a Sandy Lake Volunteer for use in monthly monitoring. In an in-field comparison of the two meters on Oct 2, 2020, the two meters gave identical results. A 342 ppm NaCl standard from HMDigital read 699-704 uS/cm, Temp 19.4oC (Mar 2, 2021); the ppm 500 scale value is 684 uS/cm. (I assume the standard is HM Digital’s 700 uS/cm standard they use to factory calibrate these instruments.) View Manual for this instrument.
On Apr 28, 2026, I purchased a new AP2 meter.
I checked the calibration with a 1000 uS solution I received from Chris Kennedy on Apr 23; I diluted it one part to 2 parts distilled water so the reading should be 333 uS/cm except Chris said it could be slightly lower. It read 317 uS/cm.
I had purchased earlier a cheaper pocket meter (22$C versus 32$C for the AP2) just to try it out, it read 263 uS/cm. I will stick with the AP2! The AP2 meter can be recalibrated if deemed necessary; the cheaper one could not.
May 9, 2026: Chris Kennedy was at Kidston Lake today to talk about the LakeWatchers program and sampling of Kidston Lake. The Volunteers had just completed the sampling. The surface EC (SPC) was “0.041”. I checked some lake water by the shore, the reading was 42uS/cm/17,5 degrees C (water in shallows in the sun).
– david p
*On the effectiveness of the ATC (Automatic Temperature Compensation)

Temperature Coefficient of Variation for Common Solutions (Barron & Ashton)
“The Temperature Coefficient of Variation is the rate at which a solution’s conductivity increases with an increase of temperature and is expressed as the percentage increase in conductivity for a temperature change of 1°C. The Temperature Coefficient of Variation will be different for each solvent / solute mixture.” – Source: The Effect of Temperature on Conductivity Measurement by John J. Barron & Colin Ashton, a Reagecon Technical Paper. They cite a coefficient of ~2% for “fresh water”.
As a rough test of the effectiveness of the ATC (Automatic Temperature Compensation) function for the AP-2 instrument, I placed cool tap water in small container and measured the conductivity and temperature. Then I held the small container in a much bigger container of hot tap water, shaking the small container to distribute the heat within it quickly and measured conductivity and temperature as it warmed up to circa 25 deg C. The results:
Initial values: 9.5 deg C, 104 uS/cm
Final values: 26.5 deg C, 112 uS/cm
So the total increase in EC was 8 uS/cm, corresponding to a percentage increase of (8/104)*100= 7.69% or 0.70% increase in EC per deg C increase in temperature, i.e. it is not zero, but the increase was much smaller than 2% per degree.
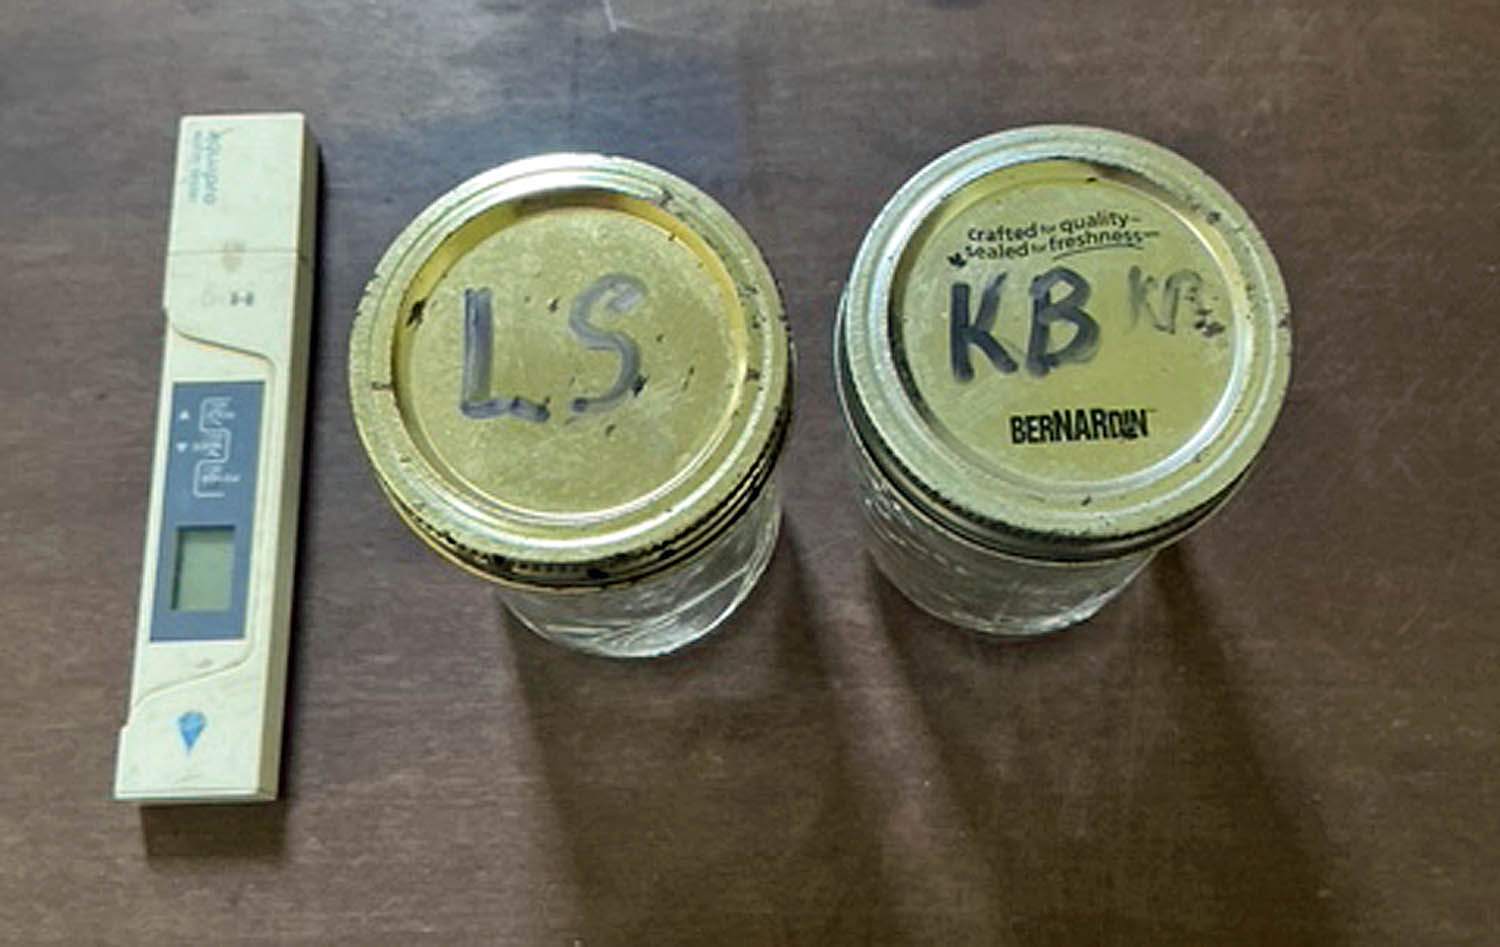
“When I take samples I dip a mason jar directly into the water of the lake or stream, then seal them. I then take the instrument and move it around in the water of the lake for about 30 seconds. I press hold and look at the results. I follow this with a second test done the same way. It is always the second test results that are recorded. The second results are different from the first but close to each other, the second test reading being higher. The lids remain sealed overnight and then are removed just before testing. Again I move the instrument around before recording results. I always rinse the jars and instrument after use.”
A Sandy Lake Volunteer, Bruce S, conducts monthly measurements of nearshore lake water and of water at the mouth of a stream entering Sandy Lake. He routinely measures the values on site (water collected in a container); he then takes the samples home, allows them to warm up overnight, reaching room temperature, and then he again measures EC and temperature. Both sets of values are reported on this website, see: Seasonal Monitoring
In close to 100% of the measurements, the values measured after 1 day are higher than the field values, even when the field temperatures were close to the room temperatures measured the next day (some of the late summer summer sampling). In general these increase were much less than 2% per degree C increase in temperature. Such changes could be due to changes in ionic composition on incubation and CO2 gas exchange – although the latter should not affect EC by more than about 2-3 uS/cm (iccontrols.com doc).
Comment Barron & Ashton (bolding inserted)
Measurement temperature has a significant influence on conductivity readings; but appropriate temperature compensation is a powerful tool to allow meaningful comparison of readings taken at different temperatures. The analyst must ensure that the type of temperature compensation utilized is appropriate for both the type of sample being analyzed and the required test accuracy. This is an essential factor for determining the suitability of a conductivity instrument for measurement applications.
A conductivity measurement taken with the sample at the reference temperature will always be more accurate than a temperature compensated reading taken away from the reference temperature – this point is essential for critical applications requiring high accuracy of measurements.
The possible error with this instrument related to temperature compensation is in general very much less than the spatial and temporal variation in EC that we are observing (see Examples), thus we consider that in relation to our use of the AP-2 instrument, “the type of temperature compensation utilized is appropriate for both the type of sample being analyzed and the required test accuracy.”