DRAFTING
EC: Electrical Conductivity
SPC: Specific Conductivity
Note: I have generally used the term EC, rather than SPC, however readings of the AP2 Pocket meter (used at Sandy Lake and by Charles Bull at Governors Brook in the Williams Lake Watershed) are “temperature compensated” so they can be regarded as SPC (Specific Conductance) values – see On the effectiveness of the ATC.
WILLIAMS LAKE WATERSHED

Fig 1. Report Fig. 4 Colpitt Lake SPC values (uS/cm) on Dec 10, 2015. The gold-highlighted values are for seeps (see text). SW: Standing Water. Inlet 1 is at the mouth of Governor’s Brook
WLW 1: Water quality measurements on Williams Lake and Colpitt Lake (Halifax, N.S.) Dec 7-13, 2015 with reference to possible impacts of road salt
Report by David Patriquin Jan 6, 2016 to Williams Lake Conservation Company. Vertical (limnological) profiles of temperature, conductivity, oxygen and pH were obtained to characterize the winter state of Williams Lake. To identify sources/sites of salt inputs, SPC and temperature were determined for inlets on each of Colpitt Lake (upstream from Williams Lake) and Williams Lake; there were large differences in SPC values for streams coming from settled areas and those coming from undeveloped lands. SPC values at inlets and in lake water were used to estimate the proportion of water coming from settled versus unsettled landscapes; Governor’s Brook is identified as a major source of salt input to Colpitt Lake and thence to Williams Lake.
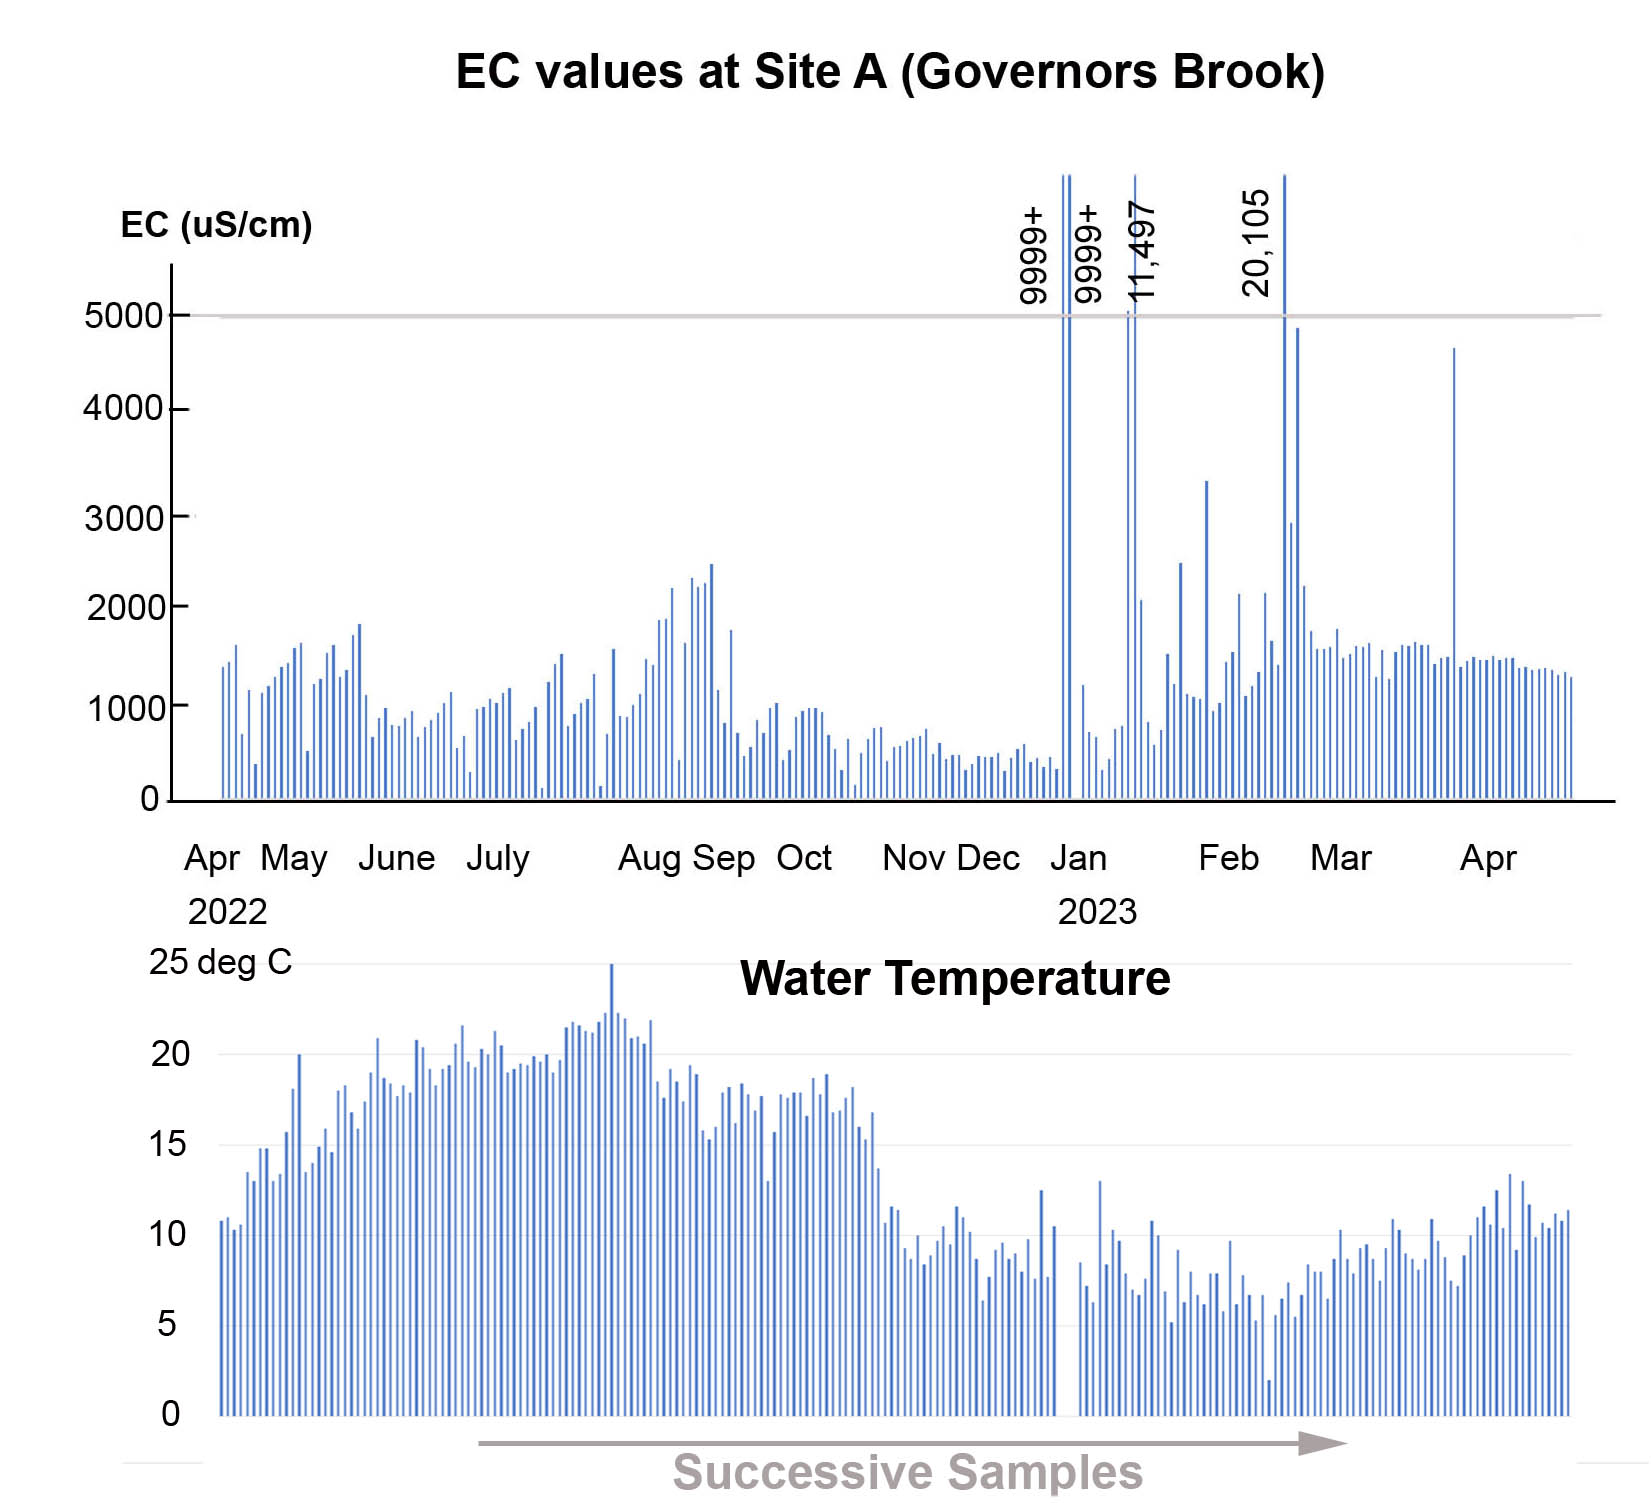
Fig 2. SPC values at Site 1 (upper Governors Brook) on individual sampling days. Each bar shows the EC value for a particular date
WLW2: CB Observations Gov. Bk/Colpitt Lake
“Charles Bull has been conducting “Citizen Science” observations on Electrical Conductivity (a measure of salt content) & Temperature of surface waters at 3 locations in the upper Williams Lake Watershed April 2022 to April 2023 & ongoing.”
The webpage describes results from the first complete year of sampling. An extract:
“Full strength seawater is about 50,000 uS/cm. So water in Governors Brook on the high EC days (Fig 1) was the equivalent of about 20-40% seawater. The Canadian Water Quality Guidelines for the Protection of Aquatic Life for chloride are 120 mg CL/L for Long term Exposure and 640 mg CL/L for short term exposure; the equivalent EC values are 474 and 2414 uS/cm respectively (source). On the days when EC exceeded 9,999 uS/cm, the chloride values were likely at least 5 x the critical value for short term exposure!”
SANDY LAKE WATERSHED
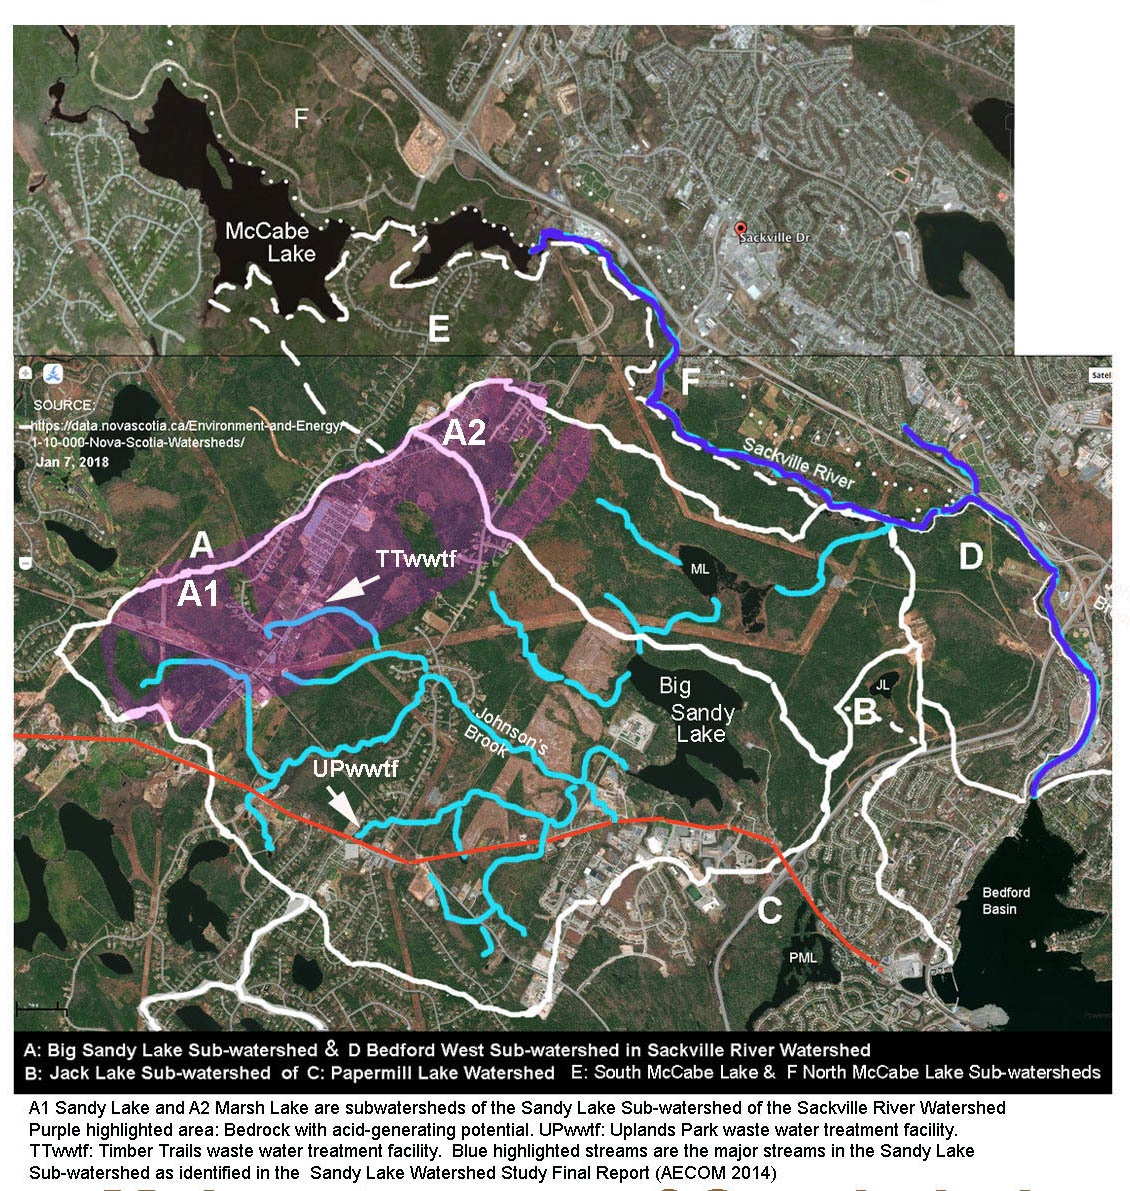
Fig 3. Sandy Lake Watershed
Measurements of EC and temperature of surface waters in “Sandy Lake and Environs (Bedford, NS)” were conducted as a supplement to a broader survey of the plant communities initiated on June 17, 2017. I had intended this survey to be of limited duration (one field season, 2017) but it led to many followup observations, these conducted over ensuing years and ongoing, especially in relation to characterization of water quality.
Circa 8 sets of observations of water temperatures and conductivity in surface waters have been obtained to date using the AP-2 pocket EC/Temperature meter. Various of these sets could be described as “casual”, “formal” and in-between (semi-formal) in nature, formal being a set of observations that one would expect to be accepted as “scientific”. All of them are likely to be considered “citizen science” and will be rejected by some agencies regardless of their scientific rigour.
I am a retired academic scientist. My goal with these observations was not to produce scientific papers but simply to learn as much as I could about factors affecting water quality with the limited resources at hand, the pocket meter being one of them. All of the data and interpretations and methods are posted on this website so that other parties who might be interested in this topic can make their own assessment of the credibility of the observations and critique the interpretations/make their own interpretations.
I am presenting the sets of observations and conclusions in the order in which they were made to illustrate how use of a simple, inexpensive conductivity meter can be very informative to volunteer organizations involved in water quality monitoring/advocacy, how they can supplement the limnological observations conducted under the LakeWatchers program or similar protocols.
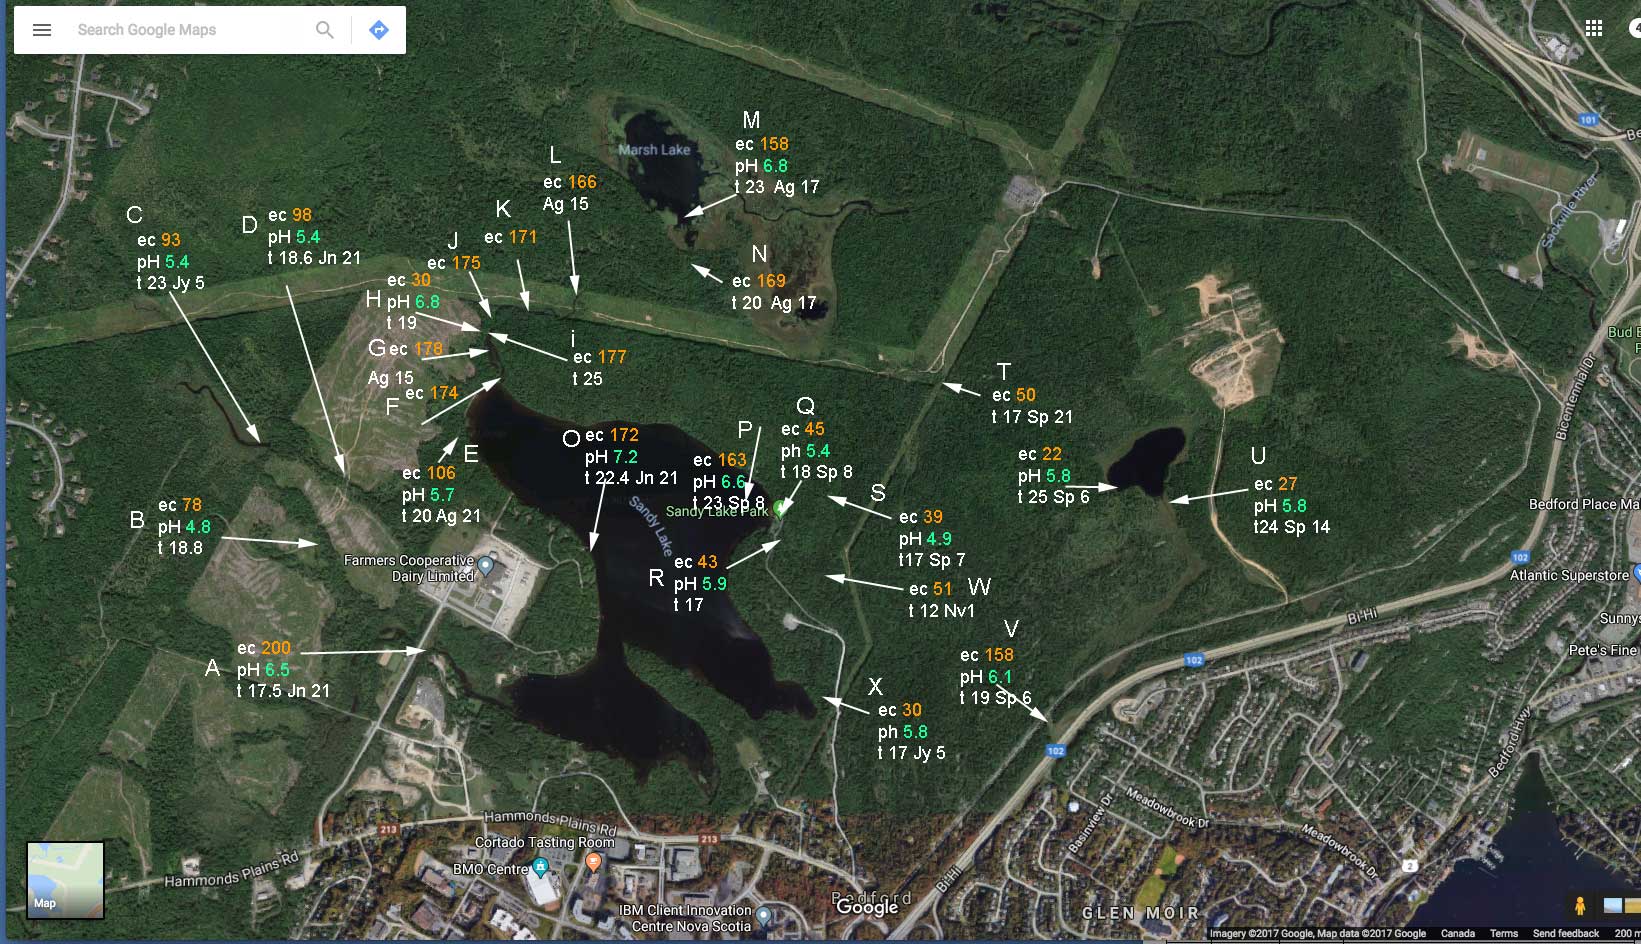
Fig 4. SPC, pH and temperature for surface waters on various dates in 2017.
SLW 1: SPC, pH and temperature of surface waters on various dates in 2017
In 2017, I compiled two larger sets of observations using a pocket conductivity meter.
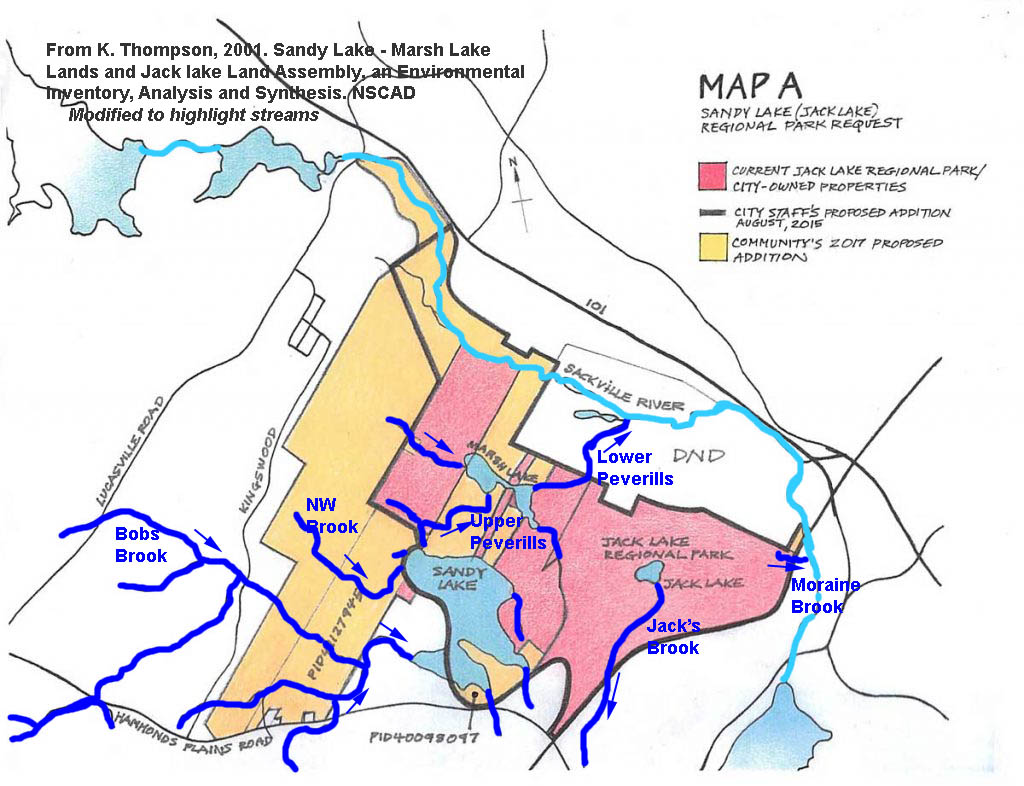
One set (Fig 3) consisted of measurements on surface waters I encountered while walking and documenting the vegetation of the larger area over a period of several months (“casual observations”). Note in Fig 4 that EC values for streams on the west side of the lake – where they drain settled areas – are in general higher than those of streams the east side of the lake which drain undeveloped lands.
I also measured pH using a pocket pH meter, In general, the pH values for streams were lower than values for Sandy Lake and downstream waters (Fig 3) except for Bob’s Brook (also known as Johnson’s Brook); it enters the lake at the southwest corner of the lake).
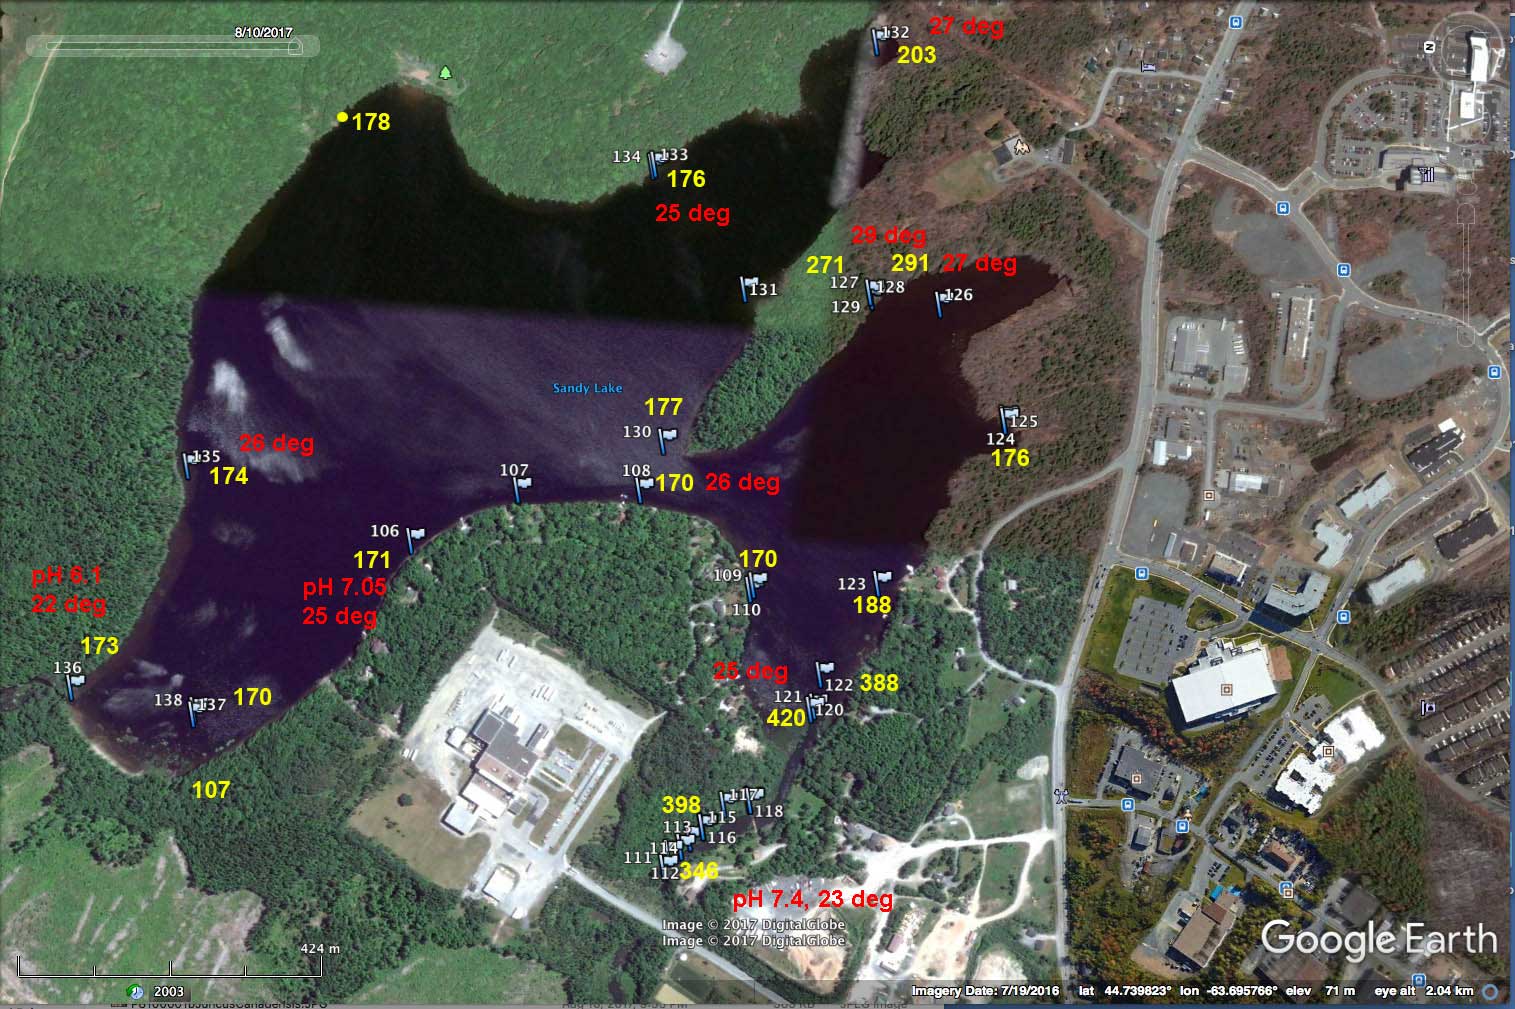
Fig 5. SPC (yellow numerals; units are uS/cm), pH (red) and temperature (red) of surface water at different locations on Sandy Lake on Aug 10, 2017.
SLW2: EC and temperature around margins of Sandy Lake on Aug 10, 2017
This set of observations (Fig. 5) consisted of measurements of EC and temperature made around the perimeter of Sandy Lake on Aug 10 2017 in conjunction with a survey of the lakeside wetlands – these could be described as “semi-formal” as the observations were made on one date on one body of water, i.e. the values are more directly comparable one with another than those in Fig 3 because they were all obtained on one day. pH was measured at three sites.
The highest EC (SPC) values in Fig. 5 occurred near the mouths of the 3 streams draining settled areas at the south of the lake (view Stream Map); from south east to south west the values were 203, 271&291, and 420&398 uS/cm), while values away from those areas and likely more representative of the lake as a whole, were within the range 171-178 uS/cm.
Conclusions from SLW1 & SLW2:
(i) There were large differences in EC spatially.
(i) In general, the higher values were in streams draining the more settled areas, lower values in unsettled or sparsely settled areas.
(iii) Within Sandy Lake, highest values occurred in areas of the lake adjacent to inlets where water from settled areas flow into the lake.
(iv) The highest EC values in both sets of observations were observed on Johnson’s Brook and/or the associated inlet at the SW corner of the lake; pH was also higher than at all or most other sites.
View the Original Report for more details related to SLW1 & SLW2
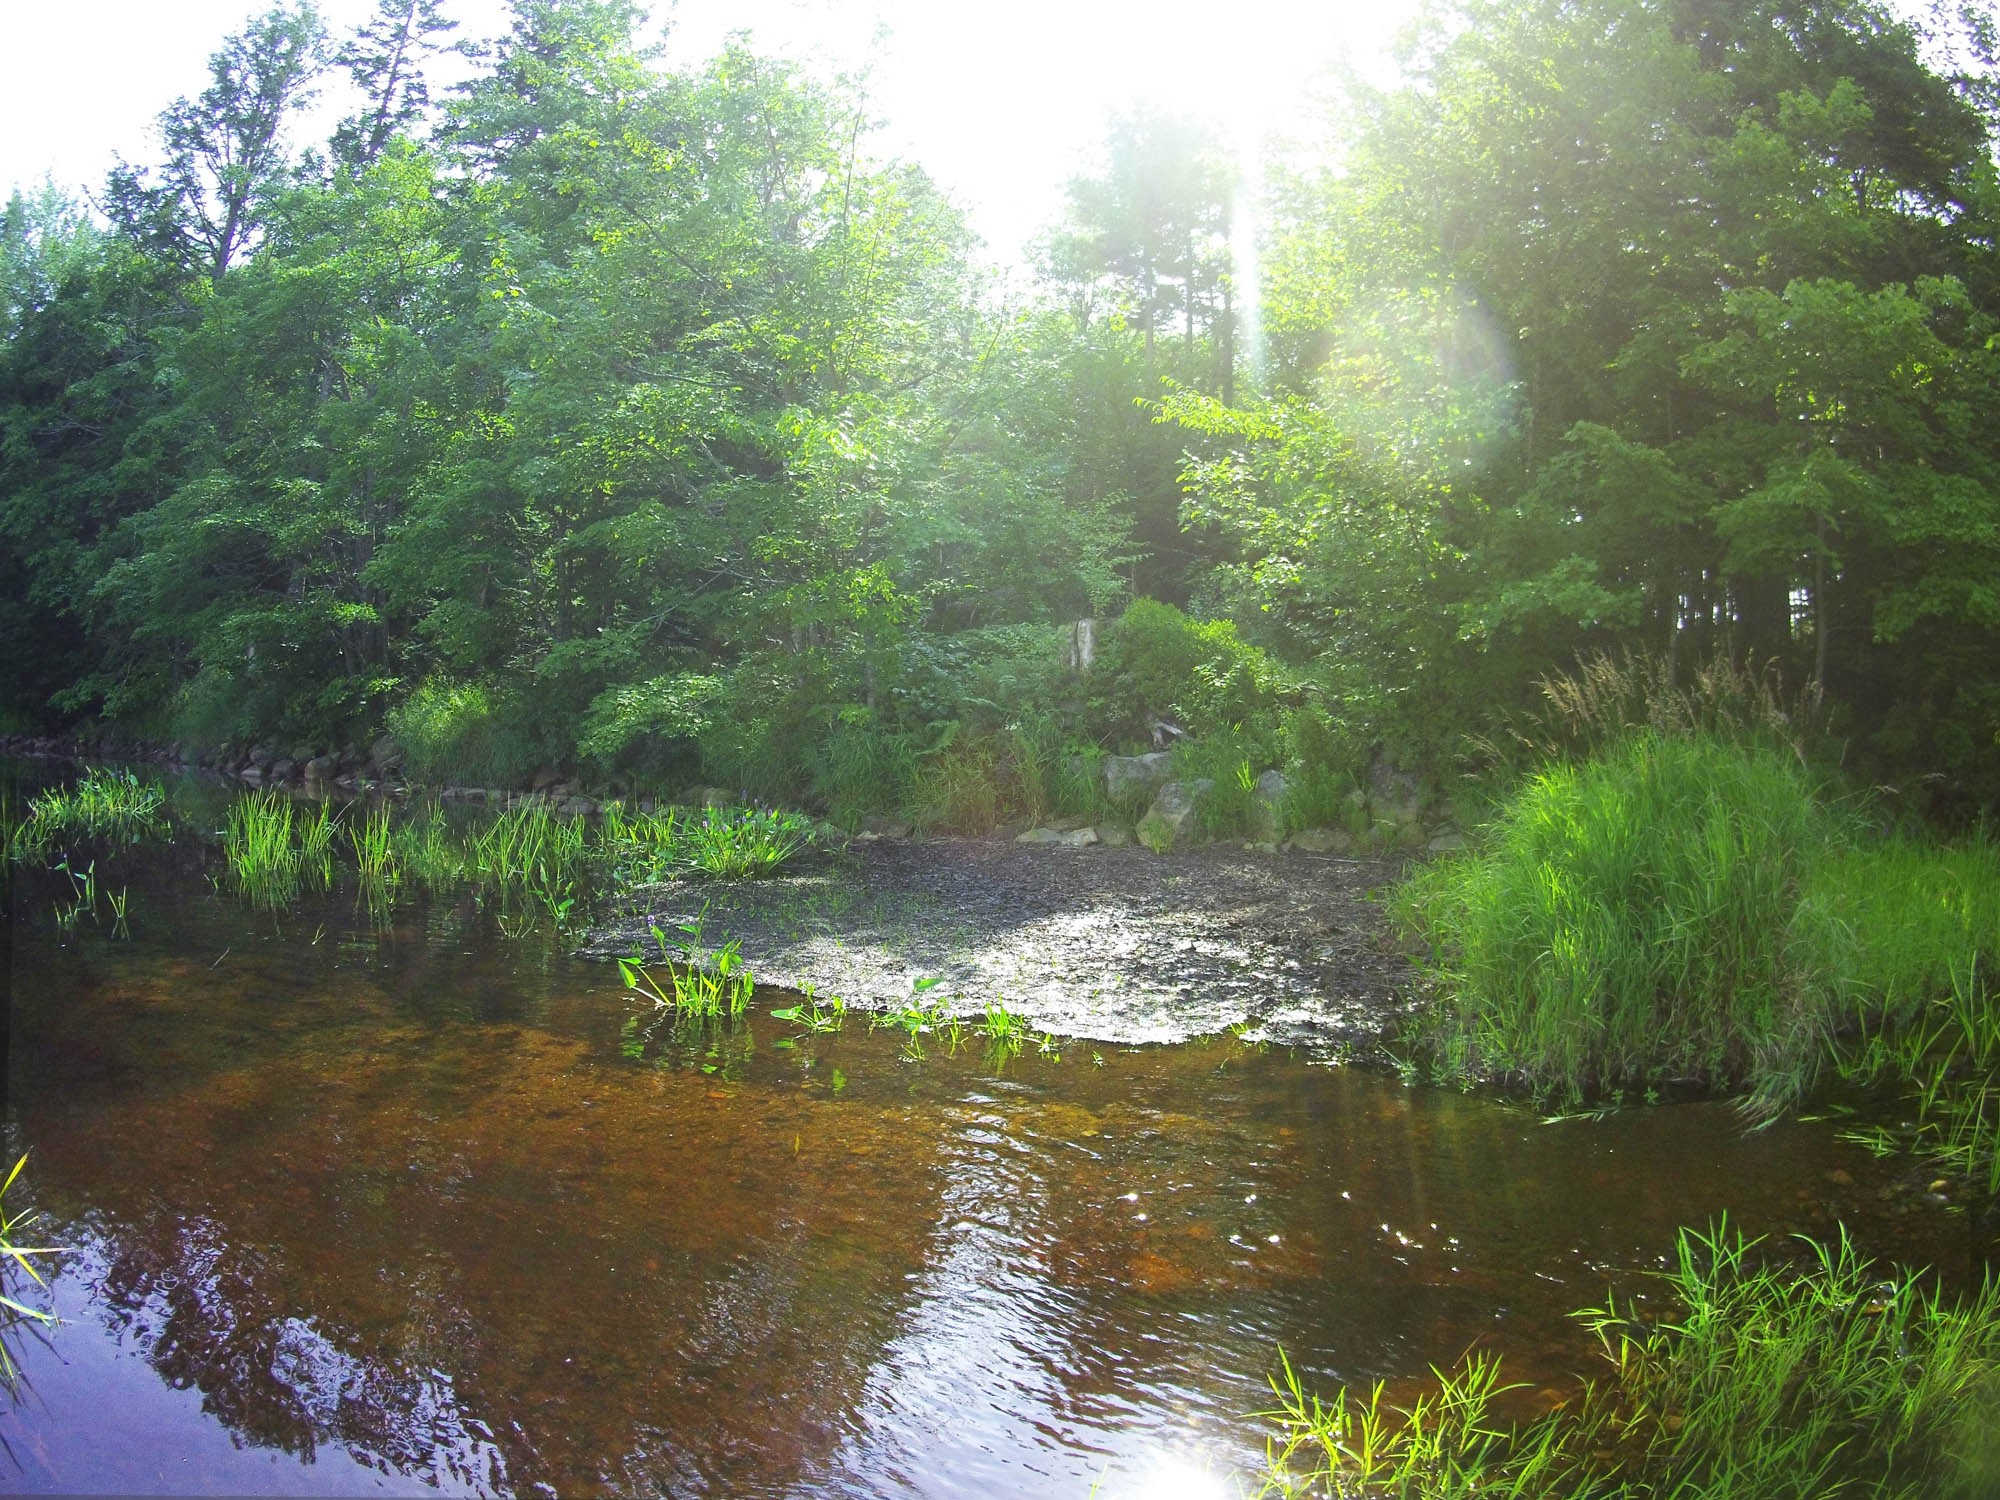
Fig. 6: Mouth of Karen Brook is just to the right (north). Aug 21, 2017. There is a light area about 2 m wide where water was rushing out of the brook; to either side are deposits of woody debris from the 2013 clearcut.Deposits closest to shore were exposed (above the lake level) on this day.
SLW 3: Karen’s Brook/NW Beach (Aug 21, 2017)
Woody debris washed down from the 2013 clearcut via Karen’s Brook forms a fan of dark woody surficial deposit on the lake bottom extending outwards from the mouth of the brook and may have led to some shallowing/increased growth of emergent aquatics in the shallows by “The Beach” at the northwest corner of the lake.
EC in the wet exposed woody debris shown in photo at right above was 235 uS/cm; 27 deg C, pH 5.7; water in the flowing water in front of it was 100 uS/cm, 23.6 deg C. Open lake water was circa 170 uS/cm on Aug 10.
Wood chips typically “immobilize” nitrate- and ammonia-nitrogen when they start decomposing, but after about 2 years begin to “mineralize” (release) nitrogen. The high EC value for the exposed debris compared to water flowing over it and to open lake water suggests it was likely mineralizing nitrogen rather than immobilizing it at this stage, which was 4 years after the clearcut. Other nutrients in the chips would also be released along with the nitrogen. Another possibility: the high concentration of organic matter is creating anaerobic conditions and release of phosphorus ; possibly both processes are occurring. Either way, it’s likely that the woody debris is adding to the nutrient load on Sandy Lake, as well as to oxygen consumption.
View the Original Report for more details, references.
The Limnological Profiles of Oct 3, 2017
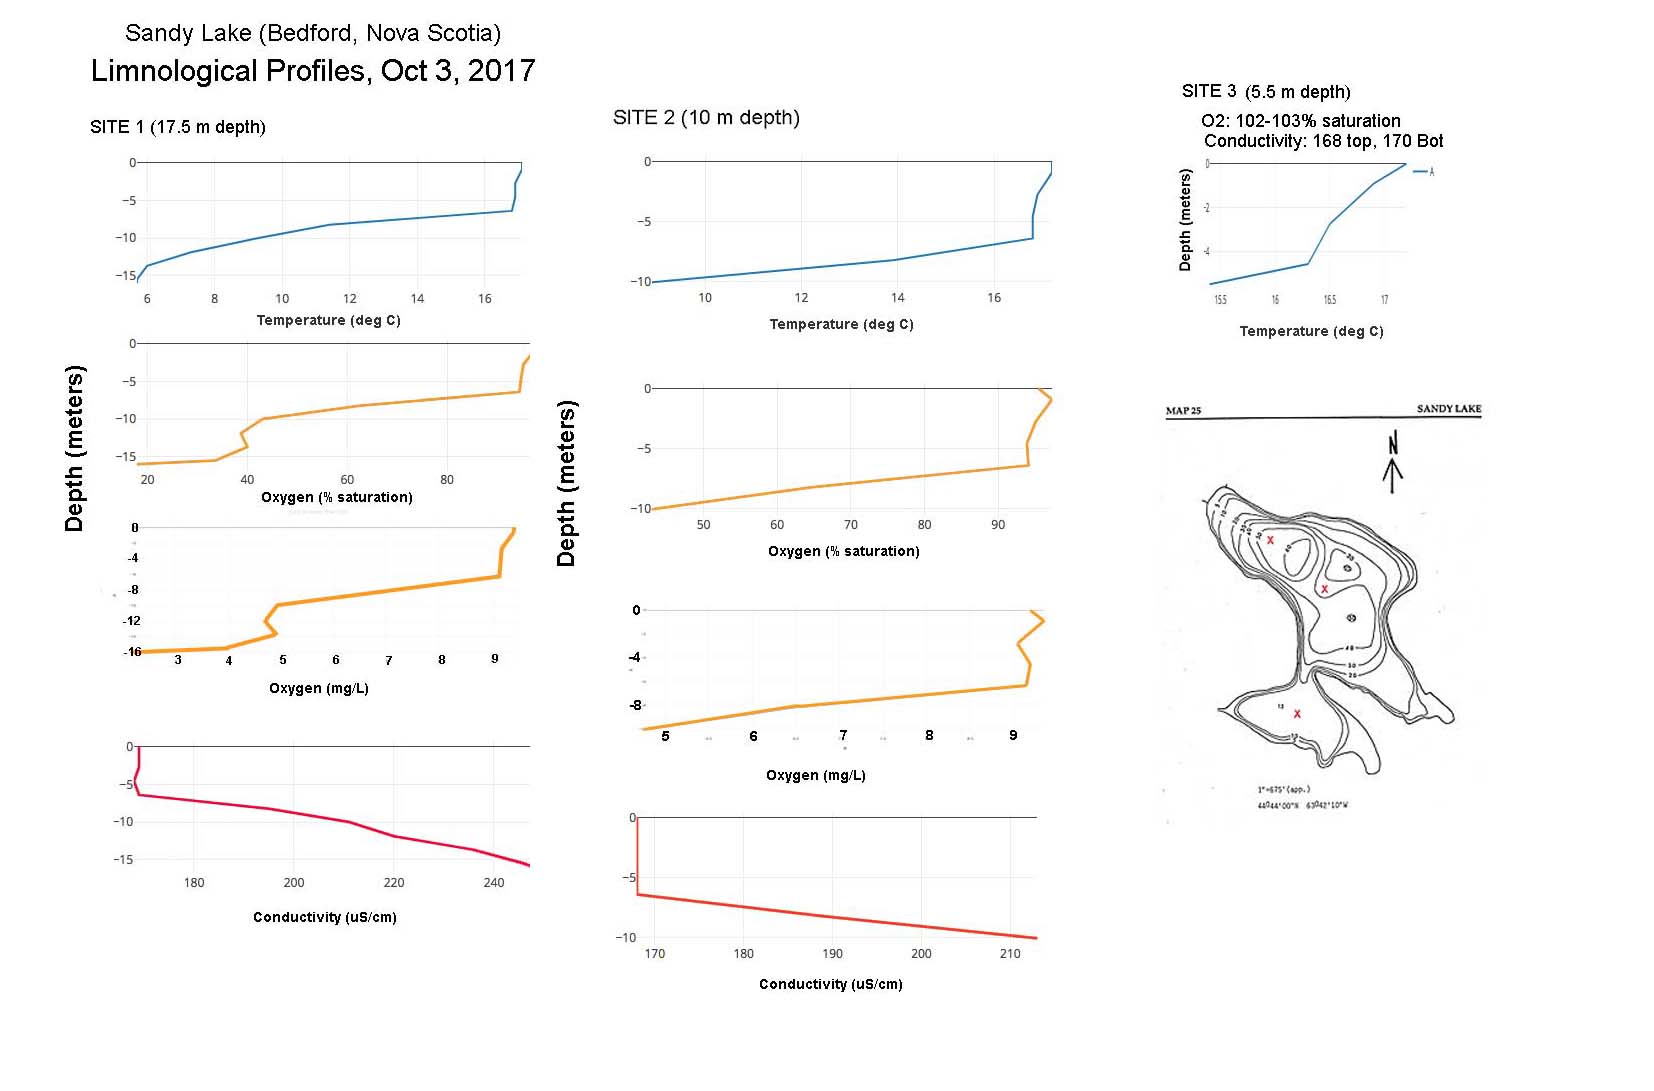
Fig 7. Limnological profiles at three locations on Sandy Lake on Oct 3, 2017
The first set of limnological profile observations for Sandy Lake were obtained on Oct 3, 2017. Measurements were made at 3 locations.
It was noted
(i) there is a distinct gradient in conductivity (a measure of dissolved ions) in deeper layers;
(ii) for the deepest profile (Site 1), the oxygen content of the deeper layers is below guidelines for both warm water and cold water aquatic life.
View details as recorded in 2017
The profile observations suggested that Sandy Lake was subject to significant anthropogenic inputs which could be affecting water quality; that was indicated as well by data on lake total P compiled in the AECOM 2014 Report. The EC Monitoring Sets SLW1 and SLW2 pointed to streams draining settled areas as significant sources of electrolytes (salts), and likely O2-consuming organic inputs and plant-stimulating nutrients that contribute to O2 consumption in the deeper areas of the lake.
From the Overview (Written Jan 11, 2018):
The SLE [Sandy Lake & Environs] 2017 Observations included measurement of vertical profiles of limnological variables in Sandy Lake and extensive measurements of pH and electrical conductivity (a measure of salt content) on lakes and streams…
These data, although preliminary in nature, provide some direct evidence of the state of the lakes and streams and provide some additional reasons to be concerned about the current state of the lake and impacts of further development close to the lake, notably
(i) the oxygen level close to the bottom of Sandy Lake at or near its deepest point in 2017 was only 1/2 of the value reported in 1971 (there seem to have been no other measurements of deep water oxygen in the interim), and is lower than the value required for support of salmonids;
(ii) there is some evidence for a “salt signal” in the lake with saltier water occurring at the bottom of the lake, which if continued, can severely affect the normal turnover and oxygenation in the lake;
(iii) it’s clear that the salt is coming from the developed parts of the watershed while those not developed continue to input “clean” (low salt content) water.
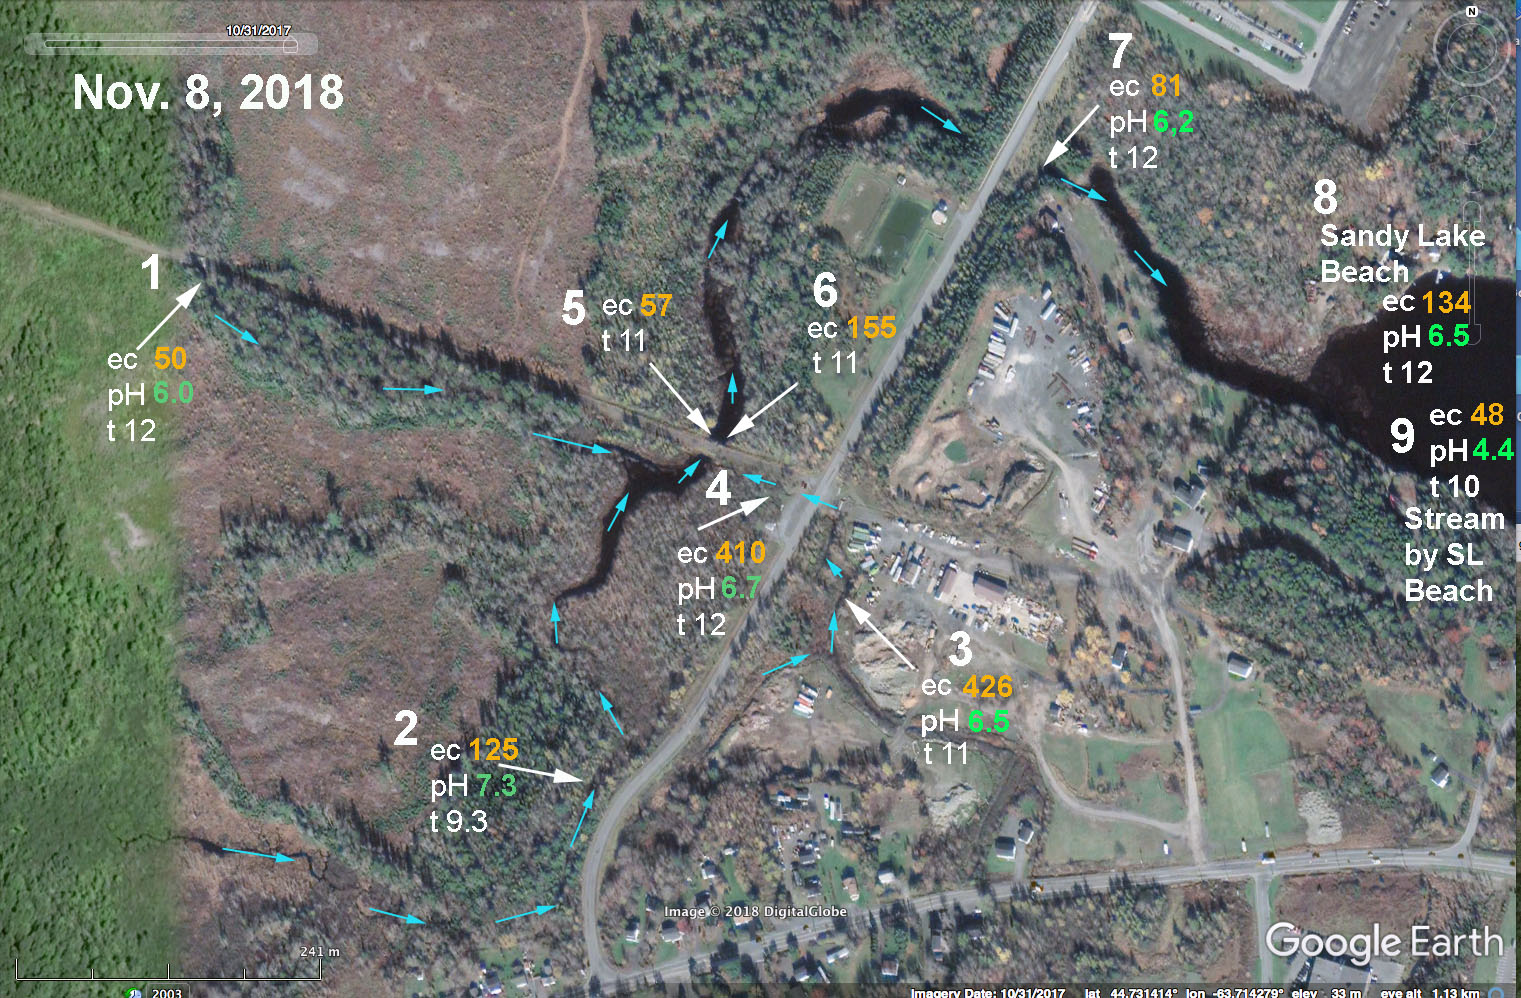
Fig 8. EC and pH values for streams associated with Johnson’s (Bob’s) Brook on Nov 8, 2018.
SLW4: EC and pH in Johnsons Brook and feeder streams Nov 8 and Dec 13, 2018
In an effort to identify the major sources of high EC (high salt) water entering Sandy Lake via the SW Inlet, on Nov 8, 2018 I took water samples from streams flowing into Murphy’s Pit (Sites 1,2, and 3-4) and from Murphy’s Pit water just north of the service road (Sites 5,6) – the streams converge upstream from the Service Road), also just below the culvert where the water enters Sandy Lake Site 7); and for reference I took a sample of lake water by Sandy Lake Beach Park (Site 8), and from a stream flowing into Sandy Lake by Sandy Lake Beach Park (Site 9). They were analyzed on-site using pocket probes… A second set samples was taken on Dec 13, after winter salting was initiated. These samples pointed to the stream draining the Uplands Park wastewater treatment area/watershed south of Hammonds Plains Road as likely the major source of electrolytes (EC) and associated pollutants entering Sandy Lake. There was a clear “salt signal” after winter salting was initiated. Water in the stream coming from the work yard and swamp area to the east of the Dairy Road had the highest EC values but there was only a weak flow of water compared to other streams converging at “Murphy’s Pit. View more details in the Original Report.
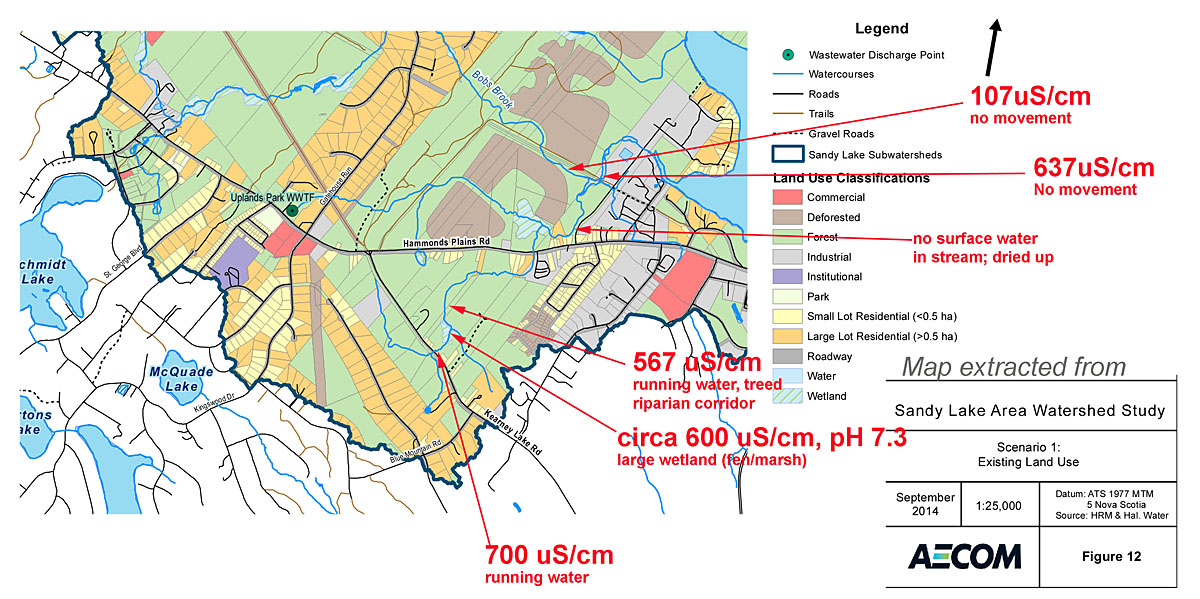
Fig 9. Electrical Conductivity Measurements Aug 20, 2020. The green-coloured part of the map is within the Sandy Lake watershed.
SLW5: EC of streams south of Hammonds Plains Road Aug 20, 2020
On Aug 20, 2020, I checked out a few sites on watercourses south of Hammonds Plains Road that feed into Sandy Lake via Johnson’s (Bob’s) Brook, notably in sub-area 12 of the Bedford West Secondary Planning Strategy. Some high EC values were observed, however because of low or no stream flows/high evaporation, not much could be concluded. View Original Report
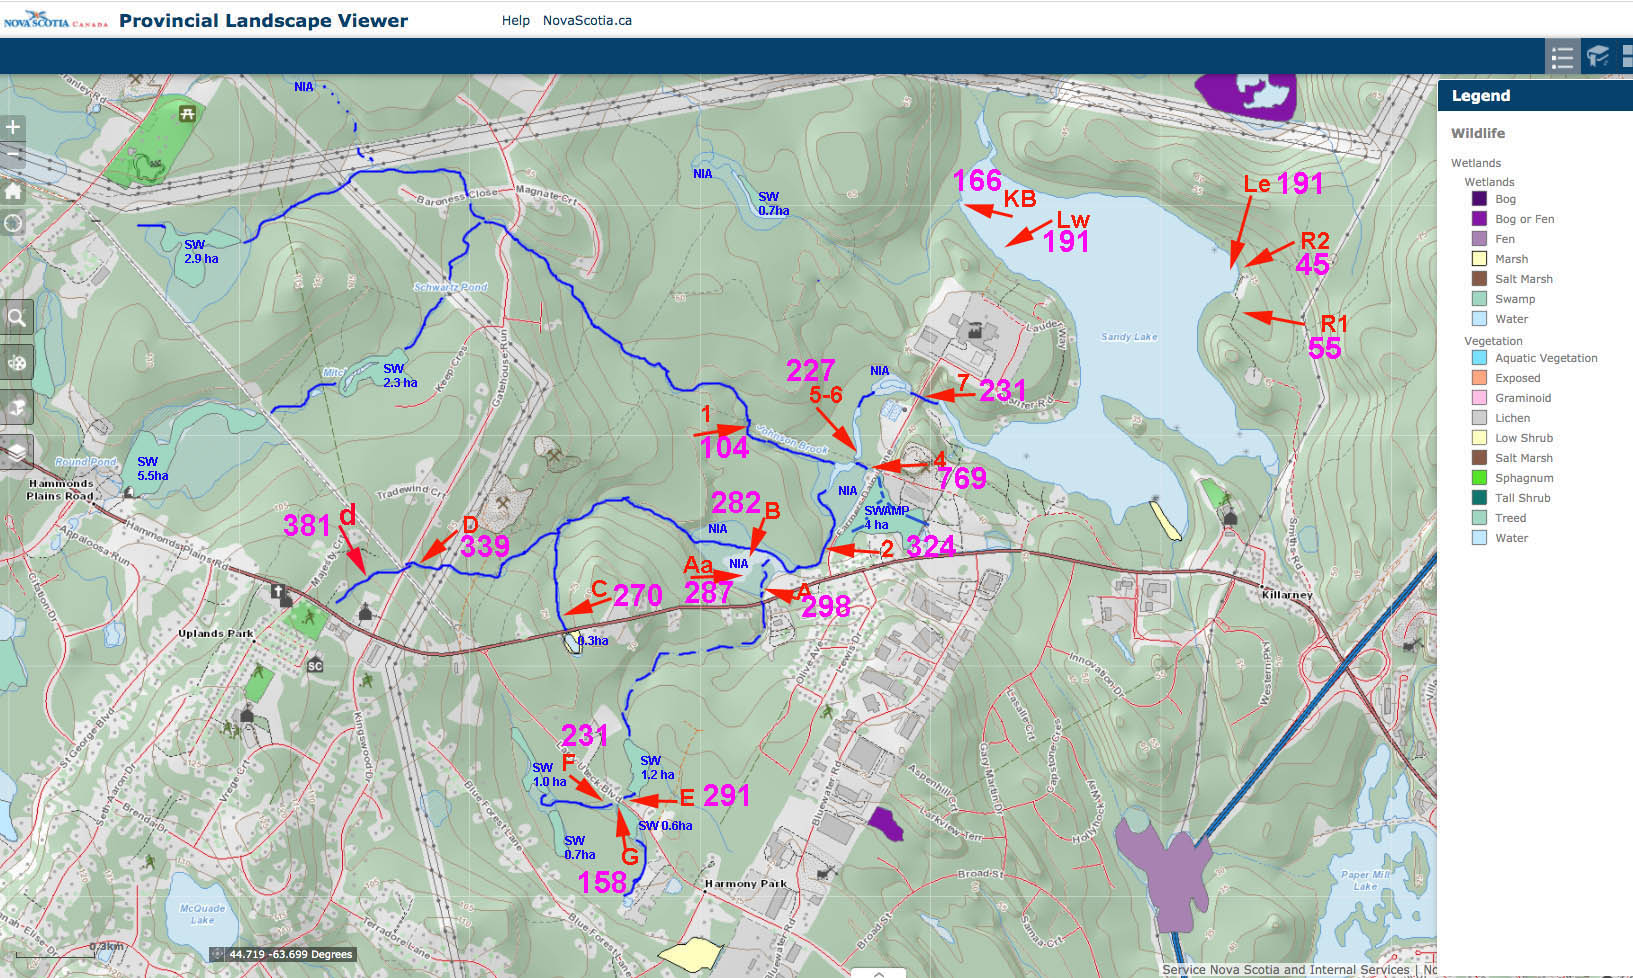
Fig 10. EC Values on Oct 2, 2020. Map is from the Provincial Landscape Viewer (PLV). Streams converging at the southeast corner of the lake are highlighted (dark blue). Numbers in purple are the Electrical Conductivity values (uS/cm) SW= swamp as identified on the PLV. NIA=”No Information Available” as cited on the PLV. Point d is a few meters from the outfall at the Uplands Park Waste Water Treatment Facility
SLW6: EC of streams W and SW of S. Lake Oct 2, 2020
In a previous set of observations on Aug 20. 2020 (SLW5 above) I identified some elevated EC (electrical conductivity) values, circa 600 uS/cm in a stream originating south of Hammonds Plains Road, raising some concern that it could be a significant source of salt and possibly other pollutants entering Sandy Lake. However it had been very droughty and streamflows overall at that time were very low, so it was difficult to get some further idea of its possible contribution compared to other streams. There were some significant rainfalls towards the end of September, recharging most streams. With the collaboration of volunteer Bruce Sarty, on Oct 2, 2020, EC measurements were obtained at the sites shown in the map at right…The EC values of the stream going from Site d to Site D to Site B (“Stream dDB”) decline progressively, suggesting a point source of salts at Site d – i.e. the water flowing from the Uplands Park Waste Water Treatment Facility – that becomes diluted as the stream moves through undeveloped landscape. Then, as noted above, as it moves from the convergence to Site 2 it goes by the edge of settled landscape and the EC content increases, illustrating a simple relationship between settled areas and salt inputs.
This is the most comprehensive single day EC sampling of surface waters feeding Sandy Lake to date. View details & discussion in the Original Report
There is a note about “THE WATER-CROSSING-UNDER-THE-ROAD ENIGMA”: “On both Aug 20, 2020 and Oct 2, 2020, water coming out of culverts of the east side of Larry Utech Blvd had a higher EC than in water entering the culverts or culvert (only one was running on Aug 20) on the west side of the road.I don’t have an explanation”. Recently I found a possible explanation: leaching from the concrete culverts – see A new type of water pollution: concrete drainage infrastructure and geochemical contamination of urban waters. By Wright et al. 2011.in Marine and Freshwater Research.
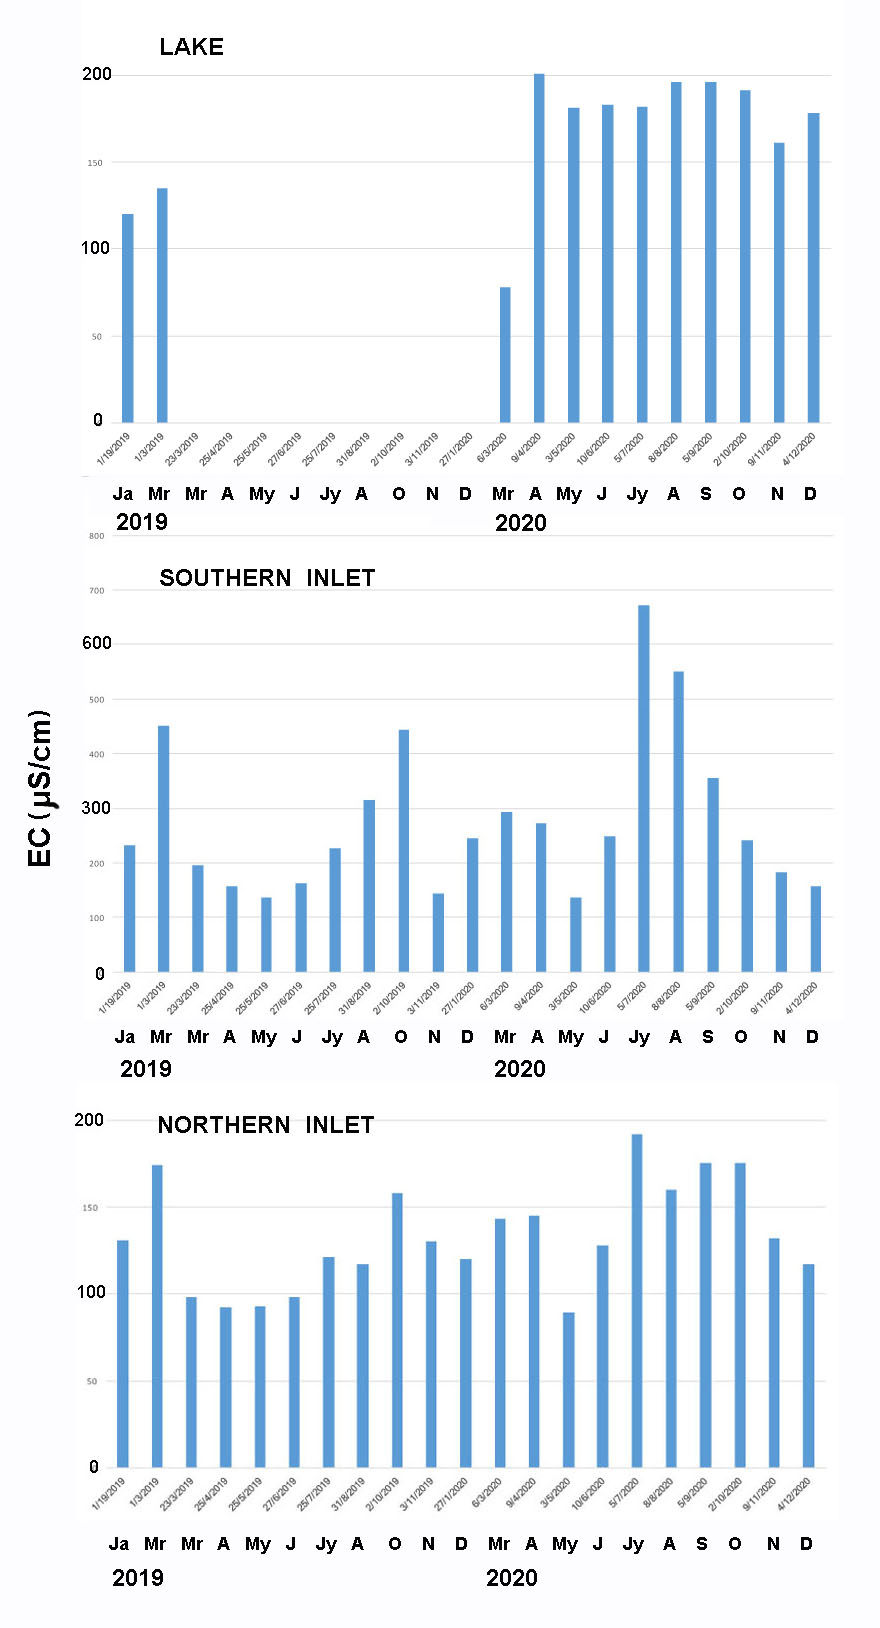
Fig 11. Seasonal EC values for 3 sampling sites in 2019 and 2020
SLW7: Seasonal (monthly) EC Monitoring 2019-2026
Citizen Science Observations by Sandy Lake Volunteer Bruce Sarty. EC (Electrical Conductivity) of four stream sites was monitored at approximately monthly intervals through 2019 and 2020, and continues. A lake site was monitored on the same schedule beginning in 2020 and continues. From Dec 2021 onwards, monthly sampling was restricted to the lakeshore and the northern inlet (also known as Karen’s Brook). The monthly sampling gives some sense of how much variability there is over a year, hence helps to interpret individual values., e.g. assessing to what extend values observed at different sites and dates (Fig 3 above) can be compared. Measurements of Sandy Lake over a whole year – which would not change as much over shorter intervals as would streams, allowed a yearly average to calculated for use in on a mass balance estimate of how much lake water comes from settled versus unsettled landscapes (see SLW10 below)
View details in the Original Report
Synthesis Docs/Pages
SLW8: Historical trends of EC and pH values for Sandy Lake surface water
A compilation of EC and pH values from historical docs and our own observations for surface water in Sandy Lake; the individual values were taken at various times and places within the lake so a lot of variability could be expected, regardless the overall trends are clear.
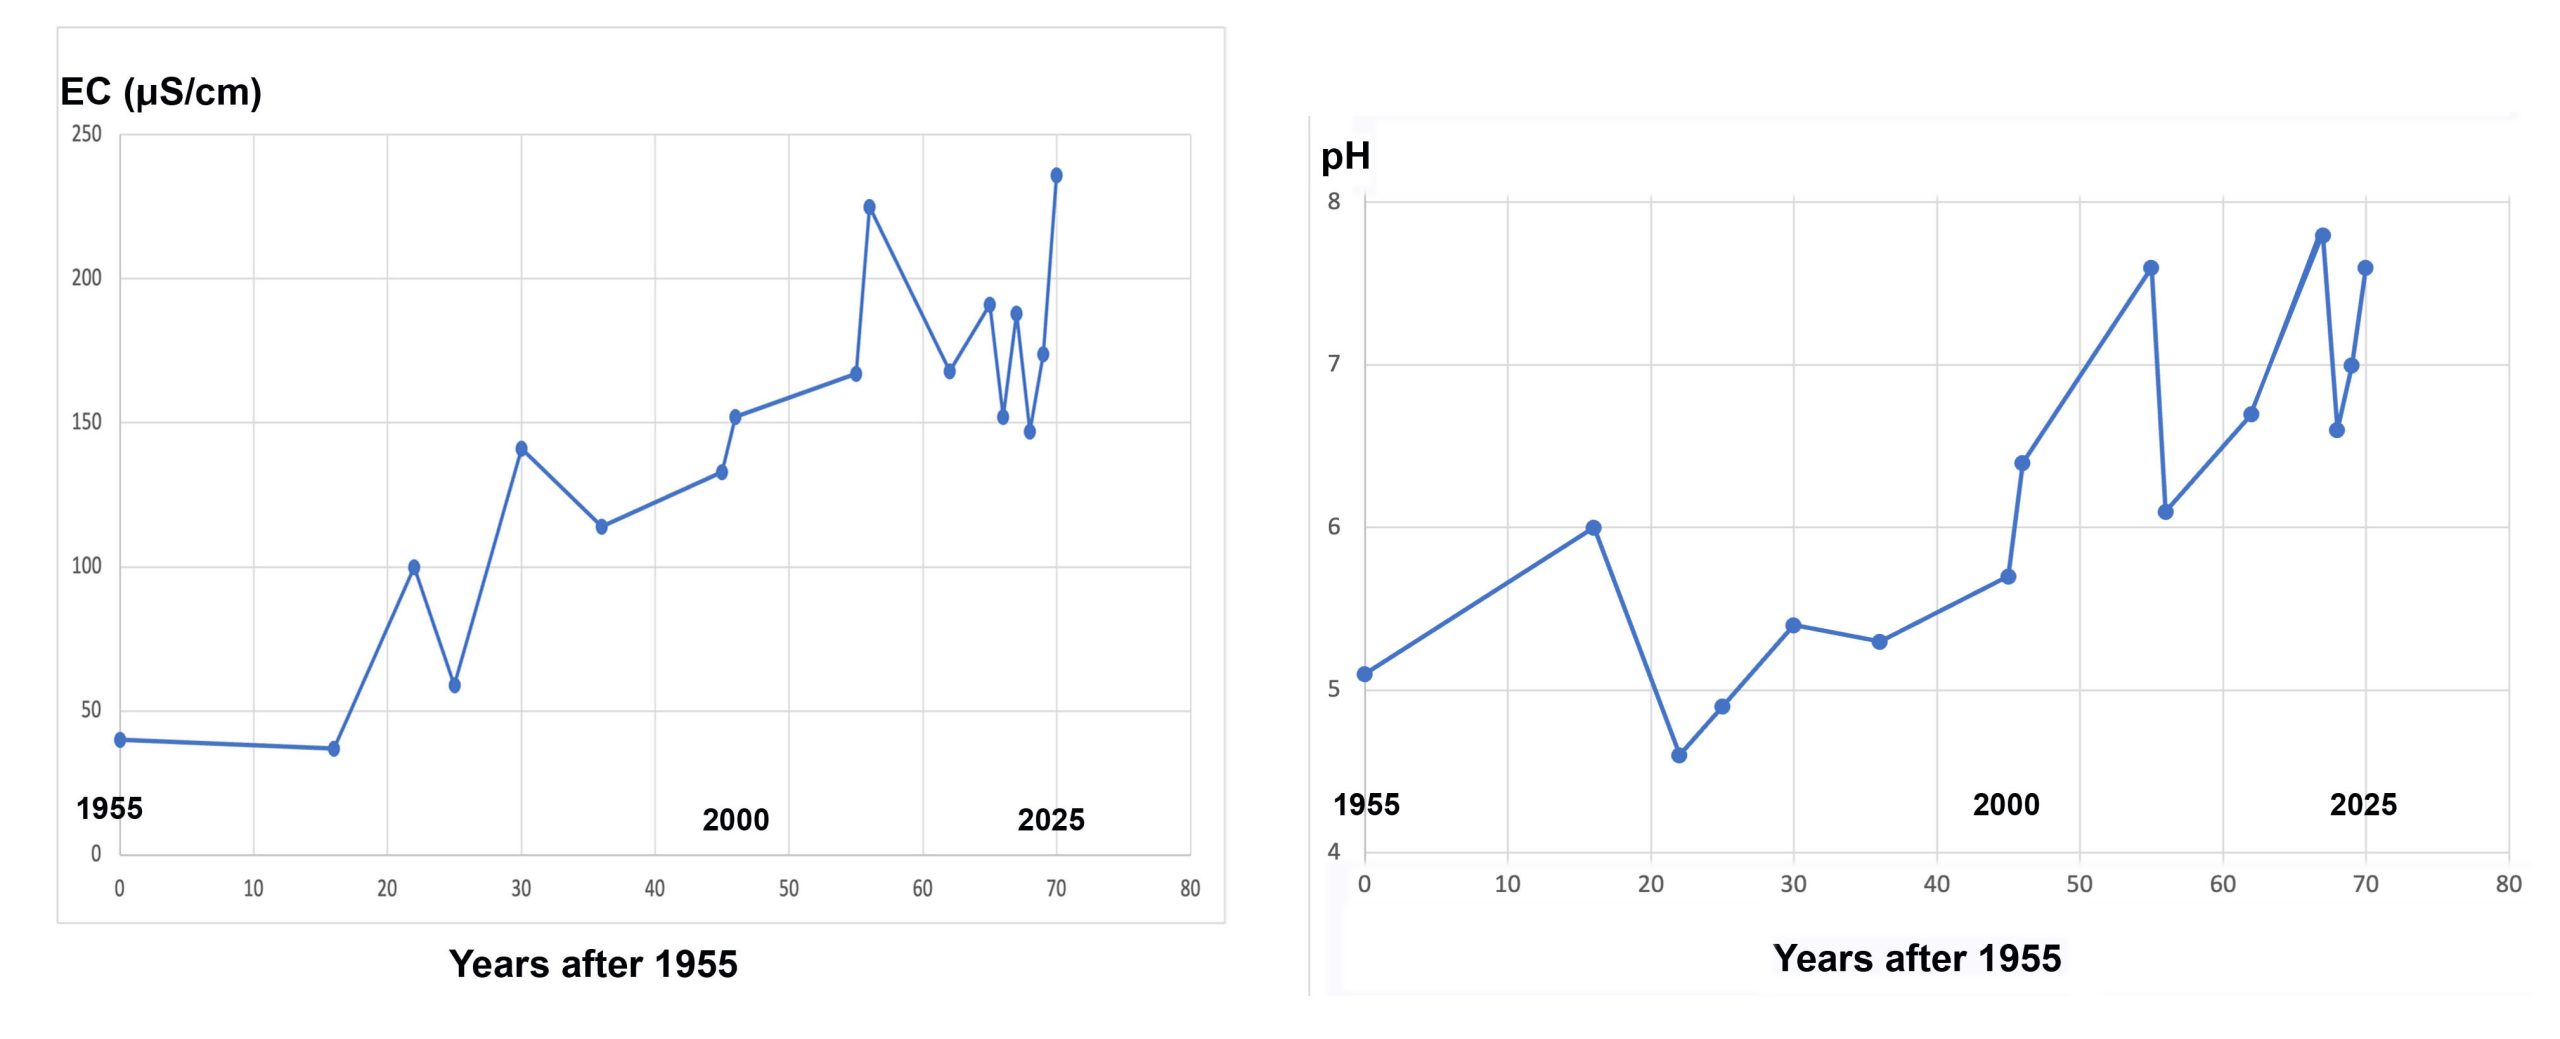
Fig 12. Left: EC (SPC), right: pH of Sandy Lake surface water 1955 to 2025
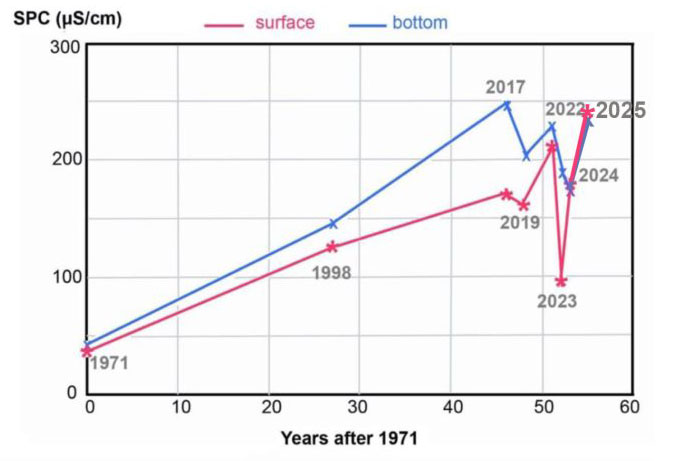
Fig 13. Surface and Deep SPC 1971 to 2025
Surface and Deep Water EC over Time (Limnological Profile data)
Data from the late summer Limnological Profiles (2017 – 2025) and historical data for 1871 and 1998 based on surface and deep water samples. Initially (2017) it appeared that differences in SPC between the surface water and water near the bottom at deepest area of the lake had been increasing over time since 1971; however the differences were erratic over the interval 2019-2025. View Details
SLW9: A Degraded Swamp
Water draining a swamp and associated work yard on the east side of the Dairy Road & some lands south of Hammonds Plains Road has consistently had the highest EC (Electrical Conductivity) values of any of the streams we have been monitoring, also the water is very turbid, sometimes quite milky with a lot of fine materials in it. Read more in the Original Report
SLW10: Sandy Lake Water Sources
To add…
View Original Report
Comment: On the Temperature Observations
Fig 14. Scientific paper about the late bloom cites EC monitoring data
I record the temperatures along with the EC values, but have not made routine use of the temperature data. Temperatures observed in some systematic way – such as the Monthly Observations might be used to look at long term changes in water temperatures; temperatures observed at many sites on a single date might reveal differences relevant to fish habitat etc. The Monthly EC and Temperature Observations on Sandy Lake turned out to be informative in relation to the timing of a late blue-green bloom in 2024 – see Curious BGA Bloom on Sandy Lake (Bedford, NS) in early November 11Nov2024