
Page completed Sep 12, 2025
Minor edits subsequently, last one on May 20, 2025
NAVIGATION
www.versicolor.ca
![]() /sandylakebedford Home Page for Sandy Lake & Environs (Bedford, NS)
/sandylakebedford Home Page for Sandy Lake & Environs (Bedford, NS)
![]() /Surface Waters
/Surface Waters
![]() /Sandy Lake A Draft report On the State of Sandy Lake…Feb 21, 2021
/Sandy Lake A Draft report On the State of Sandy Lake…Feb 21, 2021
![]() /Limnological Profiles
/Limnological Profiles
Subpages:
– 2023 Limnological Profiles, effects of episodic precipitation and occurrence of a Metalimnetic Oxygen Minimum
– 2024 Limnological Profiles – return to historic trends (This Page)
– –Addendum 1: Trends in Conductivity/Salt Content
– – Addendum 2: On Wetlands
– – In Conclusion…
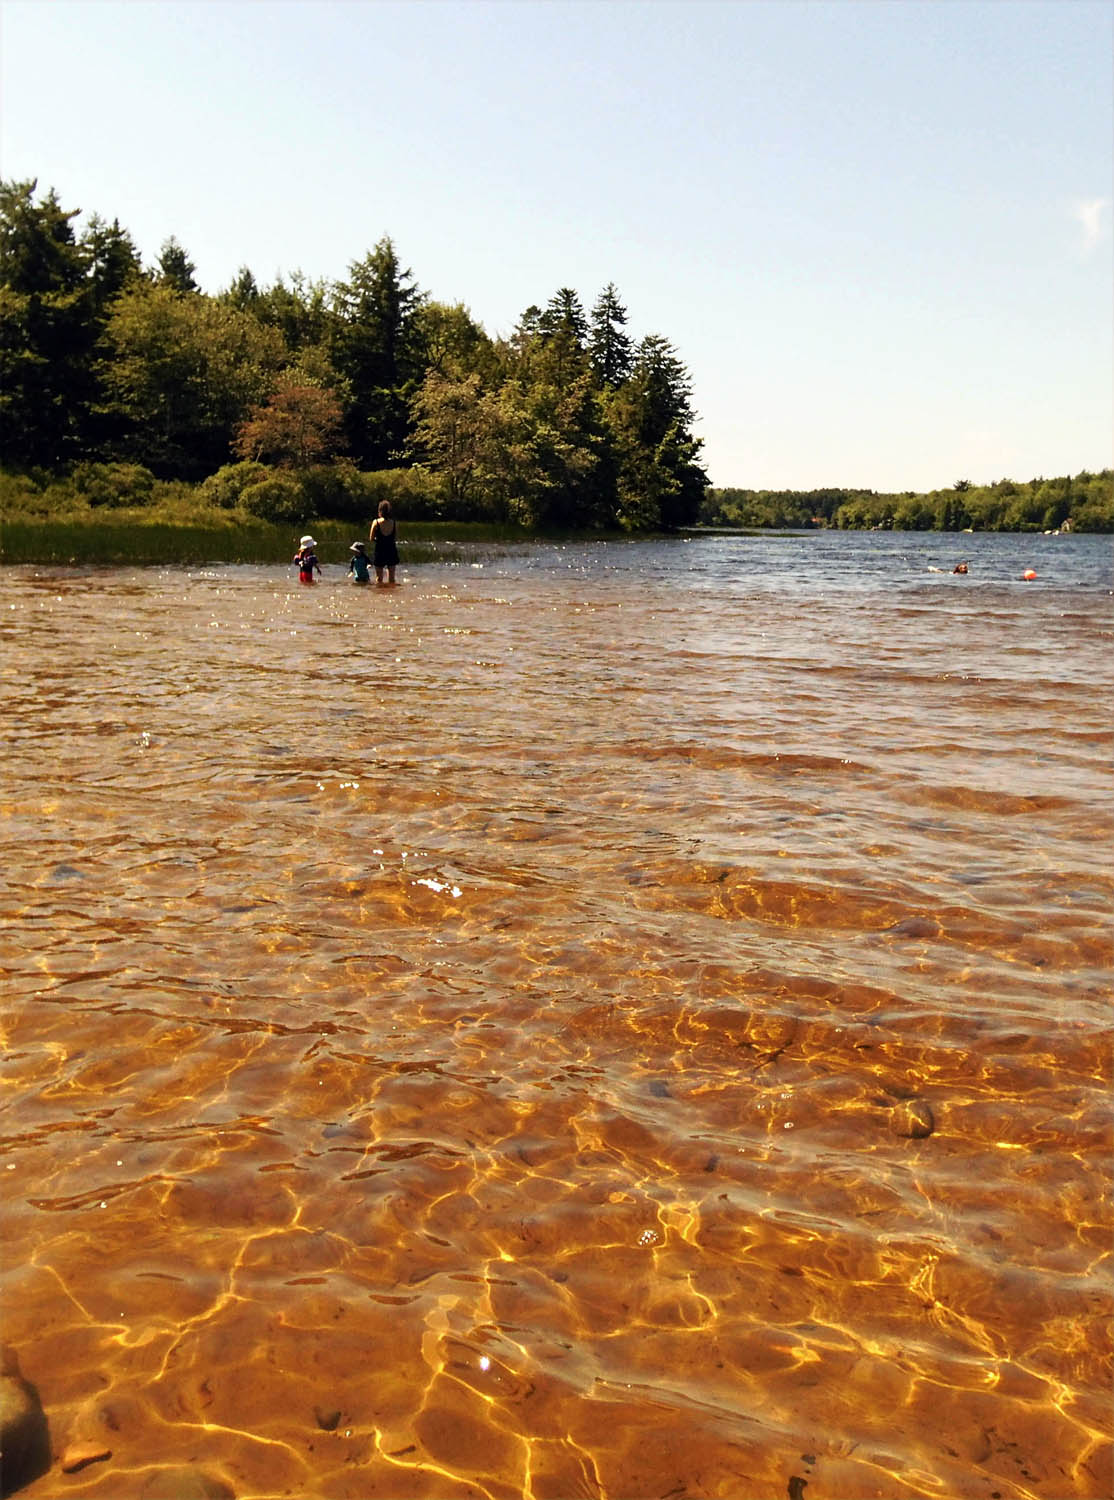
Kids enjoy Sandy Lake Beach on Aug 12, 2024. The lake “looks healthy” but… two days later the beach was closed because of bacterial contamination, and our measurements on Aug 12 indicated very low deep water oxygen levels.
1. Introduction
We recently completed our 2024 set of Water Quality observations for Sandy Lake*.
*“We” refers to Sandy Lake volunteers David P, Ed G, Derek S & Bruce S
Begun in 2017, since 2022 these observations have been conducted in conjunction with and according to protocols specified by the Halifax LakeWatchers program*.
________
*Under the LakeWatchers Program, yearly observations at Sandy Lake (Bedford) consist of (i) In situ measurements of temperature, electrical conductivity, oxygen and pH in a vertical profile in the deepest area of the lake and in surface water by the outlet; (ii) taking water samples near the surface and near the bottom at the deepest area of the lake, and near the surface at the outlet for subsequent lab analyses of chlorophyll, Total Phosphorus and chloride. The observations are conducted in spring close to or at the “spring turnover”, and in late summer, during the period of “peak stratification”.
We were very curious about the vertical profiles in the deepest area of the lake.
2. Comparison of 2022, 2023 and 2024 Profiles

Fig. 1. Spring and Late Summer profiles in the deepest area of Sandy Lake in 2022.Note (i) in the middle figure that water column from the mid thermocline upwards had lower Conductivity values in Aug than in May, while from mid-thermocline to the bottom, conductivity values were higher in Aug than in May (ii) in the left figure that theAug thermocline (zone of marked temperature change) extends from approx 4 to 10 m; (iii) in the right figure, a distinct oxygen minimum at 5 m depth – the MOM (Metalimnetic Oxygen Minimum); (iv) in the right figure, the oxygen level at the at or just above the bottom (19.5 m) was 1.15 mg/L, approx 1/7th of the surface value (8.1mg/L).
After extreme precipitation events in the summer of 2023, the entire water column had lower conductivity values (a measure of salt content) on Aug 14, 2023 compared to May 22, 2023 (Fig 1 below) and bottom waters on Aug 14 were better oxygenated (4.13 mg/L at 19.5 m depth) than on 6 other occasions in the past when deep water oxygen levels were measured in late summer/early fall (Table 1, below).
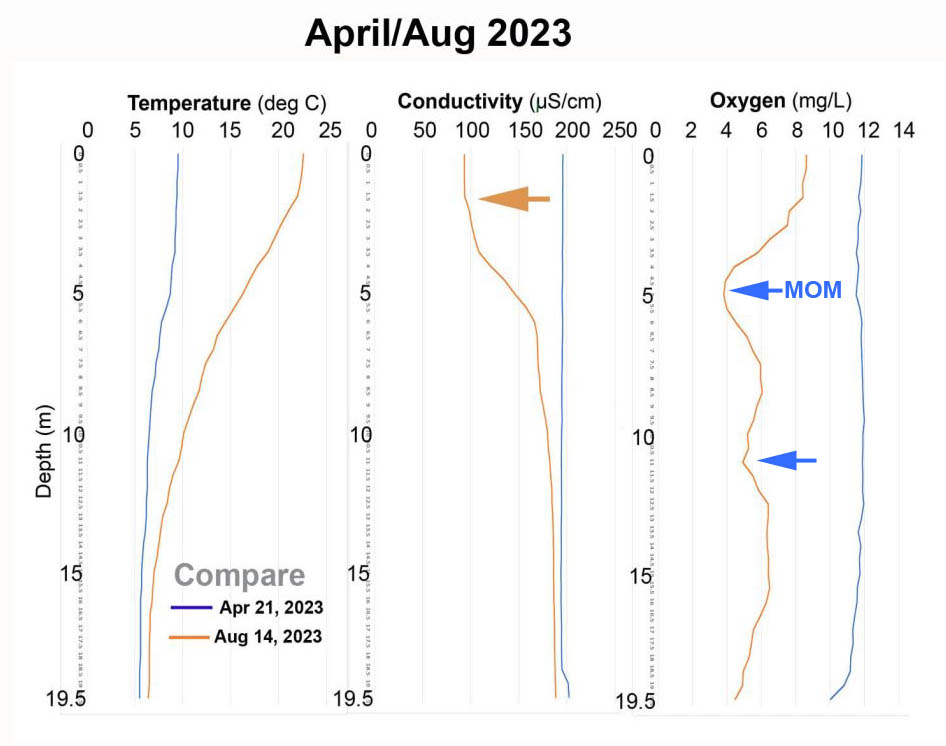
Fig. 2. Spring and Late Summer profiles in the deepest area of Sandy Lake in 2023. Note (i) in the middle figure that the entire water column had lower Conductivity values in Aug than in April; (ii) on the left figure that the thermocline (zone of marked temperature change) extends from 2 m to 15 m; (iii) in the right figure, a distinct oxygen minimum at 5 m depth – the MOM (Metalimnetic Oxygen Minimum)- and a less pronounced minimum at 11 m ; (iv) in the right figure, the oxygen level at the deepest point (19.5 m) was 4.13 mg/L, approx half of the surface value (8.62 mg/L).
Evidently, water flows associated with the extreme precipitation in the summer of 2023 disrupted the strong stratification of the water column normally seen in summer and essentially flushed the lake, re-oxygenating the deeper layers.
In contrast, this year (2024) we saw no evidence of such flushing, and oxygen at 20 m was only 1.16 mg/L:
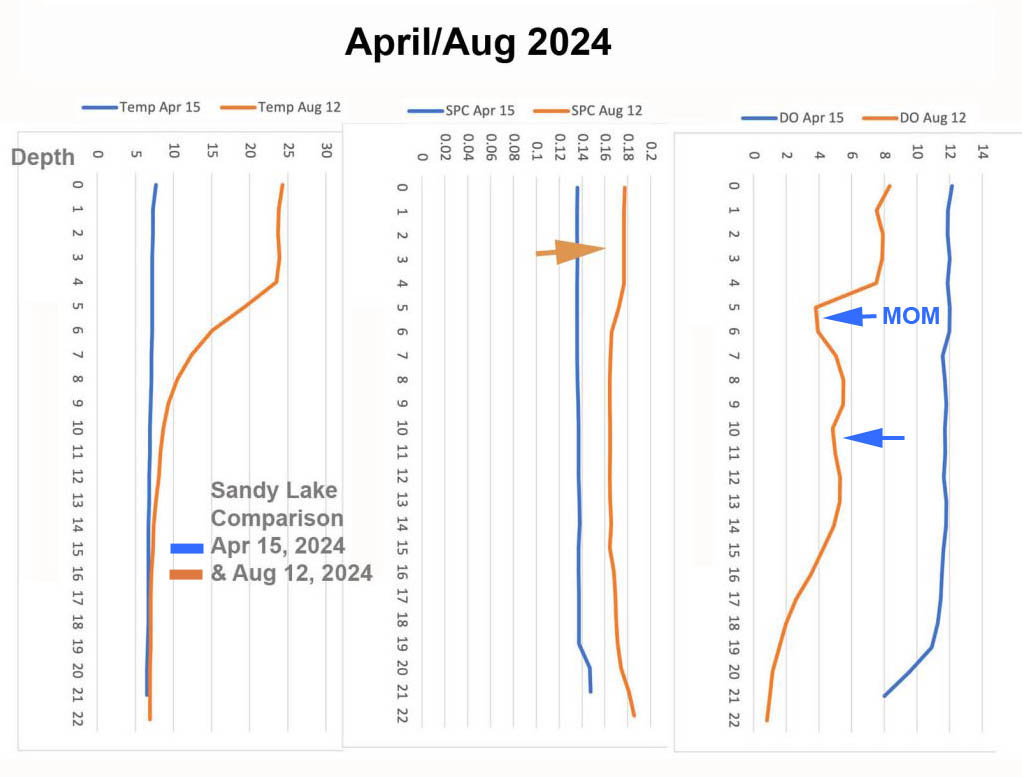
Fig. 3. Spring and Late Summer profiles in the deepest area of Sandy Lake in 2024. Note (i) in the middle figure that the entire water column had higher Conductivity values in Aug than in April (versus 2023 when the reverse was true; (ii) on the left figure that the thermocline (zone of marked temperature change) extends from 4 m to 8 m (versus a much less pronounced temperature gradient in 2023 extending from approx 2 to 11 m) (iii) in the right figure, a distinct oxygen minimum at 5 m depth – the MOM (Metalimnetic Oxygen Minimum)- and a less pronounced minimum at 10.5 m – these features very similar to 20230; (iv) in the right figure, the oxygen level at or just above the bottom (19.5 m) in Aug was 1.16 mg/L, approx1/7th of the surface value (8.34 mg/L), versus 2023 when the deep water was better oxygenated and was equivalent to about 50% of the surface value.
3. The Long Term trend in Deep Water Oxygen
Over the 53 year interval since 1971, there has been a strong trend of decline in the deep water/near-the-botton oxygen levels during the period of peak stratification in late summer/early fall ( Fig 3 Table 1 & below); it was interrupted only in 2023 when the sampling followed extreme precipitation. Levels were below 2.3 mg/L in 5 of the 6 years sampled over the period 2017 to 2024, the only exception being in 2023 following the apparent flushing event.
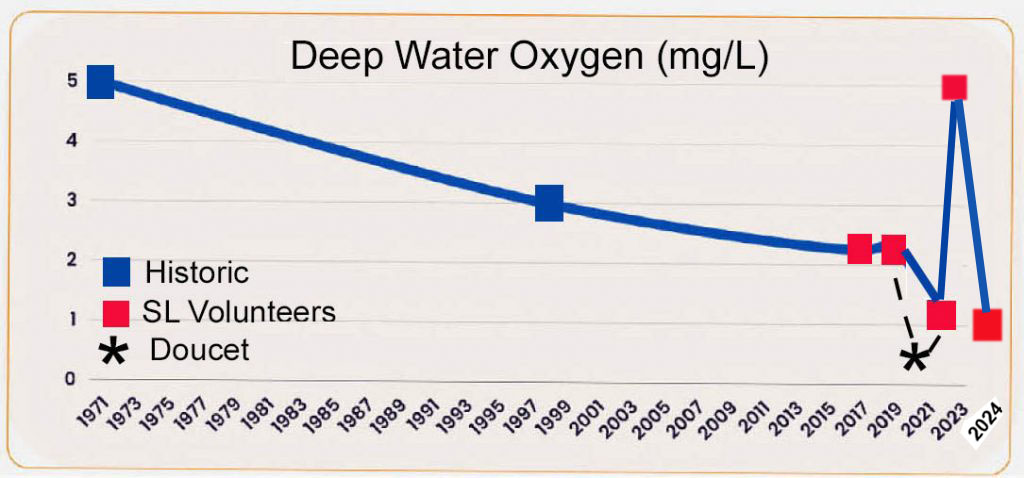
Fig 3. Deep water oxygen levels at Sandy Lake 1971-2024. In 2024, we saw a return to the trend of falling deepwater oxygen during summer stratification of recent years; it was interrupted in 2023, apparently due to flushing (turnover) of the lake brought on by heavy rains in Aug 2023. See 2023 Limnological Profiles & effects of episodic precipitation
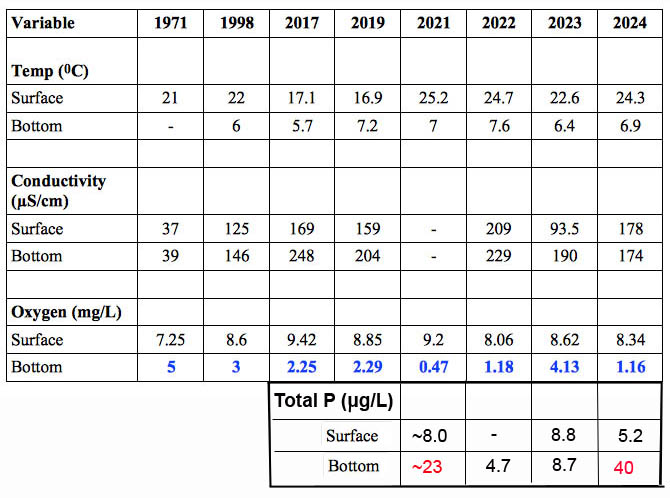
Table 1. Historic Shallow and Deep Water Temperature, EC, Oxygen & Total P values for Sandy Lake (Bedford) during the summer stratification period
1971: from Metropolitan Area Planning Committee 1971-1972: Water Quality Survey for Selected Metropolitan Area Lakes. Lake sampled on Aug 30, 1971. Deep sample at 59 feet (18 m). Chloride was 8.0 at surface, 12.0 at 59 feet (18 m). EC and chloride were elevated in the Southern Inlet sample (57.0 µS/cm, 11.0 mg/L). 1998: Nova Scotia Lake Inventory Program Sep 2, 1998. Deep sample at 19 m. Chloride at surface was 29 mg/L at 19 m, 34 mg/L. 2017: Sampled Oct 3, deep sample at 17.5 m. 2019: Sampled Sep 30, Deep sample at 21 m. 2022: Sampled Aug 22. Two profiles, averaged the values (at 19,5 and 20m). 2023 Sampled Aug 14, depth 20m. 2024: Sample Aug 12, depth 20 m. 2021. From Casey Doucet thesis (2022); 18.5 m depth; temperature and surface oxygen values interpolated from chart; deep oxygen figure given in Table B3, page 93.Total P values, 2021 from Doucet thesis; and our sampling/Halifax LakeWatchers Program for 2022, 2023, 2024
4. Metalimnion Oxygen Minimum
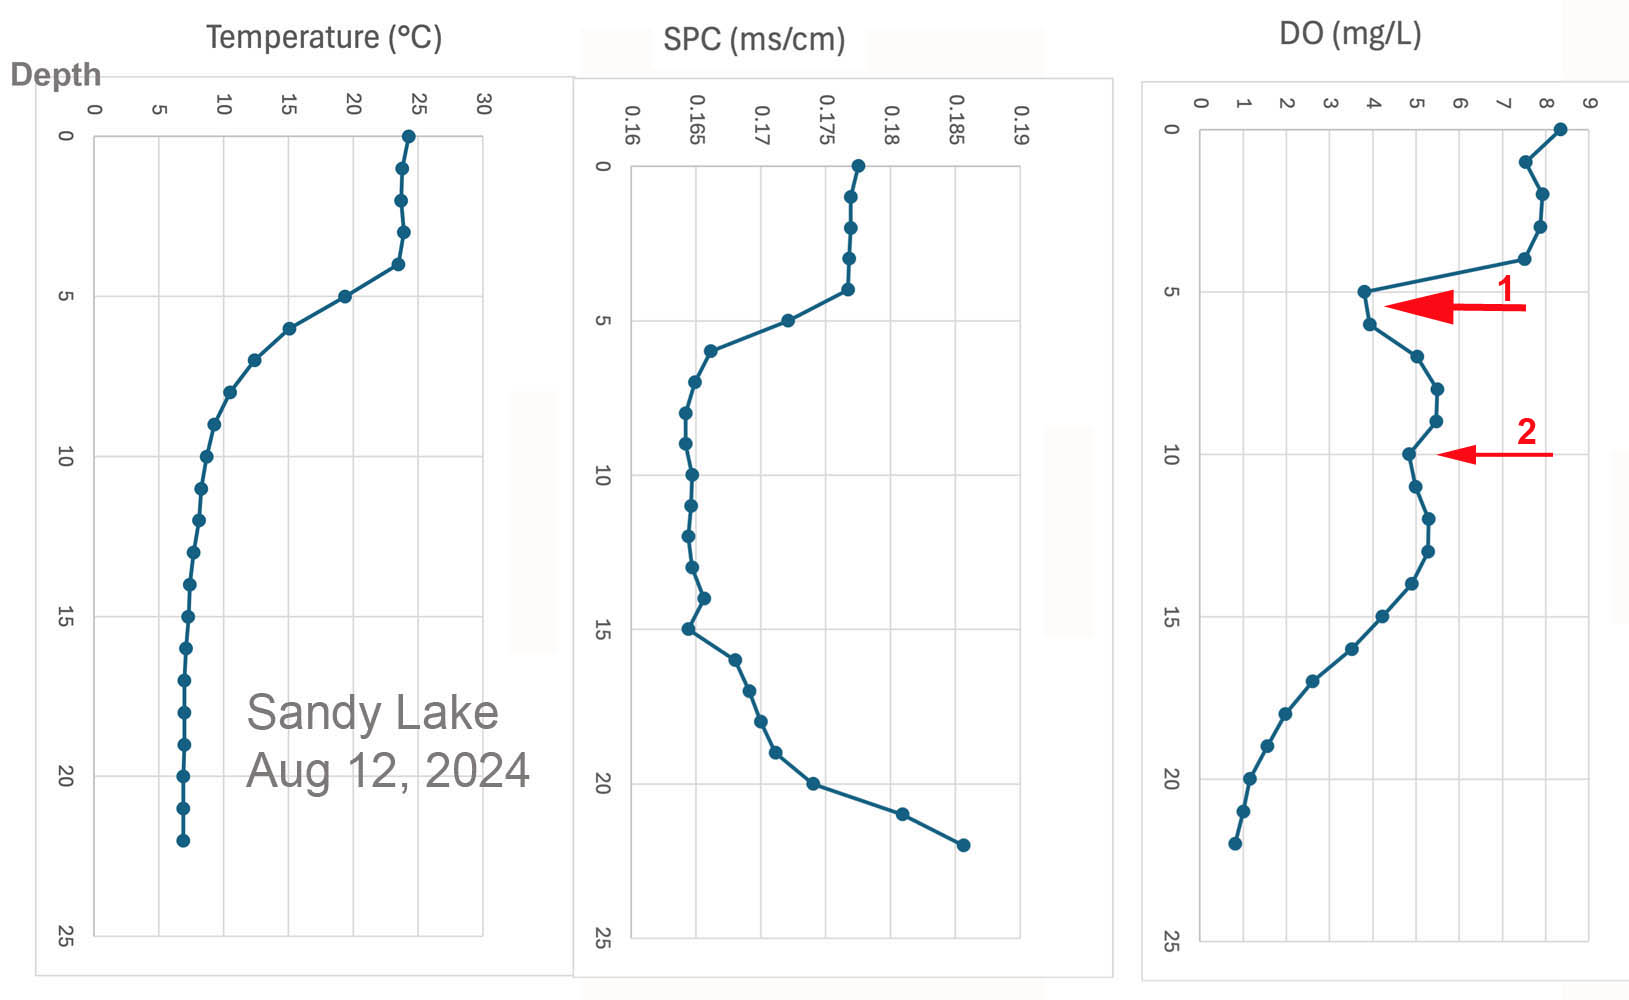
Fig 4. Profiles of temperature, conductivity and oxygen at the deepest area of Sandy Lake on Aug 12, 2024.
In 2023 we again observed in the late August sampling the presence of a “Metalimnion* Oxygen Minimum” at 5-6 m a phenomenon observed also in 2021, 2022, 2023. (See 2023 Limnological Profiles & effects of episodic precipitation & for details.). There was a weaker minimum at 10 m depth, also in 2023 at about 11 m, but not in earlier profiles.
* “Metalimnion” refers to the “The middle layer in a thermally stratified lake or reservoir. In this layer there is a rapid decrease in temperature with depth. Also called thermocline.” – Sacramento State Water and Wastewater Terms.
| Year | Depth (m) | O2 (mg/L) |
| 2021 | 6 | ~3.1 |
| 2022 | 5 | 2.4 |
| 2023 | 5 | 3.8 |
| 2024 | 5 | 3.8 |
Table 2. Metalimnion Oxygen Minimum values 2021-2024
5. Why the oxygen levels matter. A lot.
Of particular concern is the progressive decline in the deep water oxygen values over the 8 sampling dates, going from 5.o mg/L in 1979, 3 mg/L in 1998, and in the 6 samplings from 2017-2024, below 2.3 mg/L and down to 0.4 mg/L except following the apparent flushing event in 2023.
There are two major reasons these low levels are of concern:
| (i) Deterioration of the cool deep water refuge for salmonids in summer. Summer temperatures in the hypolimnion of circa 6 to 15oC and oxygen levels above 3-5 mg/L are required to support salmonids (Doudoroff & Shumway, 1970, CCME 1999, Jacobson et a., 2010). In Sandy Lake, salmonids include Brook trout and Atlantic Salmon; salmon have been returning to the Sackville River Watershed including Sandy Lake through the efforts of the Sackville Rivers Association. Warmwater fish species and other aquatic life are also affected by oxygen levels: “DO is considered an important measure of water quality as it is a direct indicator of an aquatic resource’s ability to support aquatic life…While each organism has its own DO tolerance range, generally, DO levels below 3 milligrams per liter (mg/L) are of concern and waters with levels below 1 mg/L are considered hypoxic and usually devoid of life.”- US EPABrylinski 2002 (Nova Scotia Lake Hypolimnion Project) defined “Suitable cold-water habitat” as “water temperature ≤15 °C and dissolved oxygen saturation ≥50 % [to maintain oxygen ≥5 mg/L]”.
Comment Jane et al., 2024: “For cold-water organisms, the combination of warming surface waters and declining bottom-water oxygen concentrations can lead to an oxythermal squeeze that may threaten population persistence. is mechanism has been implicated in mass mortality and even extirpation of species from lakes in the southern portion of their ranges, particularly when eutrophication has enhanced oxygen depletion at the bottom. Modeling studies suggest that these problems will be ampli ed by continued warming. In short, the depths of a lake can only serve as a warm-season refuge for cold-water specialist species if they remain adequately oxygenated.” Metalimnetic Oxygen Minima in Sandy Lake in 2021 (Casey Doucet), 2022, 2023 and 2024 (our observations) were below 5 mg/L, and thus represent further significant deterioration in the Water Quality of Sandy Lake for both both warm water and cold water aquatic life (CCME, 1999) beyond that associated with low oxygen in the hypolimnion. , |
| (ii) There is increased likelihood that intervals of hypoxia (low oxygen) in deep water could result in anoxic conditions (no oxygen) at the sediment surface and associated mobilization of phosphorous, accelerating eutrophication and marked deterioration of water quality.*Numberg (2004) states that “2 mg L–1 measured by a DO probe about 1 m above the sediment usually coincides with anoxic conditions at the sediment surfaces located at that depth.”* See the introductory paragraphs in Tammeorg et al., 2020 for an explanation; also Anoxia begets anoxia: A positive feedback to the deoxygenation of temperate lakes by Abigail S. L. Lewis et al., 2023 in Global Change Biology A comprehensive review of Nutrients and Algae Water Quality Guidelines by the B.C. Ministry of Environment and Climate Change Strategy summarizes the impacts of deep water hypoxia thus:
There is already some direct evidence for phosphorous mobilization under low deep water oxygen at Sandy Lake. In 1979, Total P of surface samples was 7 ug/L or less, well under the upper limit (10 ug/L ) for oligotrophy (the ‘clean’ state of a lake); the transition to mesotrophic status based on Total P occurred circa 2001 (re AECOM, 2014 Fig 9). AECOM (2014) cites data showing that by 2008-2011, deep water Total P on some samplings was much higher than surface water P, which they attributed to oxygen deprivation. From AECOM 2014:
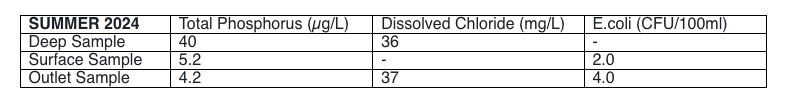
 Fig 5. Profiles for Temperature, Dissolved Oxygen and Total P in deepest area of Sandy Lake, Aug 2021, shown in Doucet (2022), reproduced with permission. More recently, two limnological profiles obtained in Sandy Lake by Casey Doucet in relation to her research for a Masters in Applied Science at Dalhousie University provide some independent verification of our observations. (View thesis on Dalspace). She sampled two sites on Sandy Lake in the latter half of August 2021, one at the deepest point or close to it; her max. depth sampled was approx 19 m; and a second site with max. depth sampled approx 5.5 m. At the 19 m site, the oxygen value for deepest sample was approx 0.41 mg/L; she also measured total P at 0, 3, 7 ,10 and approx 18 meters; values 0-10 m were close to 10 ug/L; the 18 m value was approx. 22 ug/L, i.e. there appears to have been significant internal P loading. Even at the shallower site, oxygen declined between 3 and 5.5 m from approx 8 mg/L down to close to 2 mg/L; and there was an overall increase in total P with depth. UPDATE AUG 12, 2024 DEEP WATER P:
These are Lab Results forwarded by Halifax LakeWatchers. The deep water P is the highest yet observed. 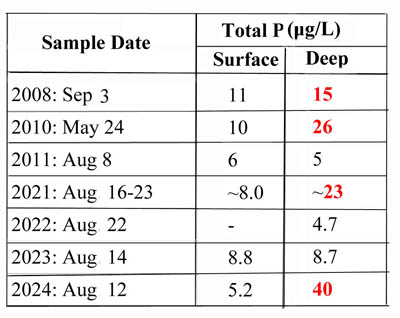 All available Total P values for Sandy Lakes for instances in which Total P was measured on samples both from the surface and from deep water (1 m from the bottom at the deepest spot in the lake which was/is 20-21 m depth). |

6. Limitations to use of Total P as predictor of
the general condition of temperate lakes
Total P is a well validated and widely accepted predictor of the general condition of temperate lakes, but it is also well recognized it does not predict the precise condition of a particular lake.
For a set of Ontario lakes, Malot et al., 1992 observed that “lake morphometry exerts a large influence on profiles and this influence is particularly evident in shallow (<20 m maximum depth) oligotrophic lakes” and that “Predictions of O2 profiles are sensitive to changes in TP concentrations, with all study lakes predicted to have severely O2-depleted hypolimnions by the end of summer at an epilimnetic TP of only 15 ug.L-1.”
At 20-21 m maximum depth, Sandy Lake could likewise be expected to very sensitive to Total P concentrations and indeed the evidence presented by AECOM 2014 suggests significant mobilization of sediment P (Internal P Loading) which they attributed to oxygen deprivation at a surface Total P value of 10 ug.L-1 (cited above).
Total P in the spring turnover sampling of 2022, measured under the LakeWatchers Program was only 6 ug/L (well within in the oligotrophic range) yet the deep water oxygen in the Aug. sampling was 1.3 ug/L. Given the trends of Total P documented in AECOM (2014), we might wonder whether the 6ug/L figure is suspect. Regardless, low deep water oxygen at such low levels is not entirely unexpected, especially given Sandy Lake is on the borderline of shallow (as noted above) and also, is relatively small (74 ha)
A small lake which is stratified and has a phosphorus concentration greater than 10 or 15 ug/L generally has some degree of hypolimnetic oxygen depletion which may be a constraint to fish habitat (loss of cool water refuge) or food supply (particularly change in benthos)…
Some lakes may have marginal hypolimnetic oxygen concentrations at concentrations of phosphorus as low as 7 or 8 ug/L (Nordin and McKean 1984). – Extracts from the comprehensive review of Nutrients and Algae Water Quality Guidelines by the B.C. Ministry of Environment and Climate Change Strategy
Thus it’s very clear from our observations (2017-2024) and those of Doucet for 2021 that a Water Quality Objective in the mid-mesotrophic range (AECOM, 2014) will not protect Sandy Lake. Indeed, Sandy Lake is in a precarious condition now and efforts should be made to ameliorate that state and shown to be effective before any major development in its watershed should even be considered.
As I have noted before, the AECOM, 2014 Report was clear on the limitations to their predictions of the effects of future development on the state of Sandy lake based on their use of a phosphorus load model:
From page iii of the Executive Summary:
“The predictions from the phosphorus load model are consistent with observations of urbanization in other watersheds. However, the degree of influence of urbanization on water quality in Sandy Lake can only be approximated using the phosphorus load model because of limitations arising from assumptions and uncertainty in the application of the model. Therefore a robust water quality monitoring plan is proposed for the Sandy Lake watershed to provide a further assessment of current conditions and to evaluate the impacts of development on the water quality.”
Section 9 (p 42) in AECOM (2014) provided specific recommendations for robust Water Quality Monitoring. Such monitoring was not subsequently pursued by HRM, but now we have sufficient data from the volunteer observations (2017-2024) validated and augmented by those of Doucet (2022) to indicate that a Water Quality Objective in the mid-mesotrophic range (AECOM 2014) will not protect Sandy Lake.
Indeed, the observations illustrate that Sandy Lake is in a precarious condition now.
That’s not exceptional, especially given that Sandy Lake is a relatively shallow lake which makes it more susceptible than lakes deeper lakes or lakes with a more extensive hypolimnion to trophic degradation and given the documented trends of declining hypolimnion oxygen levels in temperate lakes associated with climate warming – in fact a climate warming signal for Sandy lake was identified early on.*
*Establishing realistic management objectives for urban lakes using paleolimnological techniques: an example from Halifax Region (Nova Scotia, Canada) Ginn et al., 2015 in Lake and Reservoir Management. Sandy Lake was one of the 19 with observations most closely linked to climate warming.
What is exceptional is that at this time Sandy Lake watershed is still not highly developed, and that there is still a possibility of limiting the biggest threat to the future of Sandy Lake: a major new development in the area of most of the headwaters and their associated wetlands as being currently considered.
Surely, if we truly value Sandy Lake for the ecological and recreational qualities the area provides in the midst of a rapidly urbanizing landscape and not just pay lip service to them, efforts must be made (i) to ameliorate the current state of the lake and (ii) shown to be effective before any major new development in its watershed should even be – if ever – considered.
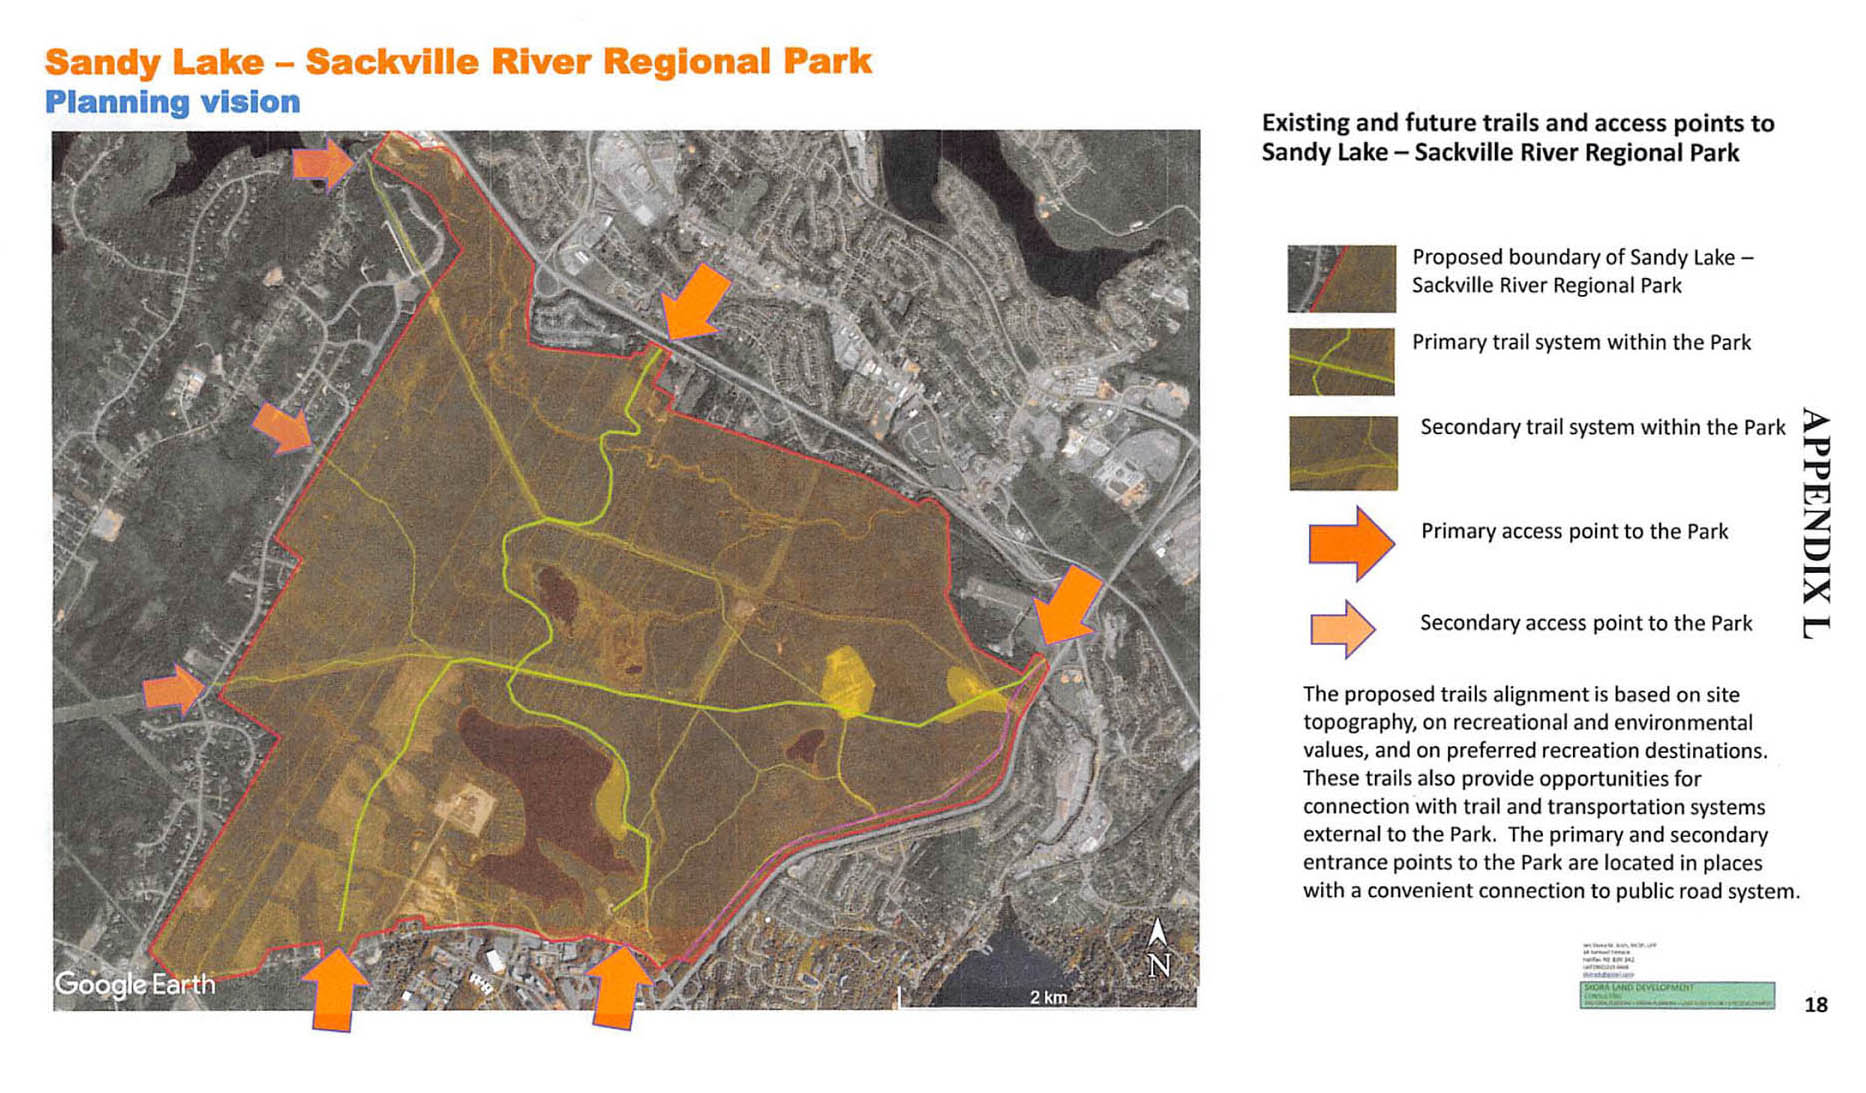
Fig 6. The proposed Sandy Lake – Sackville River Regional Park lies between growth areas on all sides. What a precious gift to future generations that would be. Map from Appendix L in the RP+10 Submissions (2020) from the Sandy Lake – Sackville River Regional Park Coalition.