
Major issues
(i) As cited by AECOM itself, modelled phosphorus concentrations differed by far more than 20% of the measured concentrations, indicating the model is not valid.
The predicted phosphorus concentration in Sandy Lake under current conditions is 20 µg/L. This predicted value is significantly greater than the median measured phosphorus concentration of 12 µg/L. Brylinsky (2004) and MOE (2010) indicate that a model is not valid if the modelled phosphorus concentrations differ by more than 20% of the measured concentrations, as is the case with the Sandy Lake results.
As discussed in Section 3, the model assumptions may over-predict phosphorus concentrations by not factoring in phosphorus retention as water travels within the watershed before it reaches the lakes. Predicted phosphorus inputs to the lakes can be reduced by adjusting the lake phosphorus retention coefficient, which in turn reduces the predicted lake phosphorus concentration.
From Brylinski 2004:
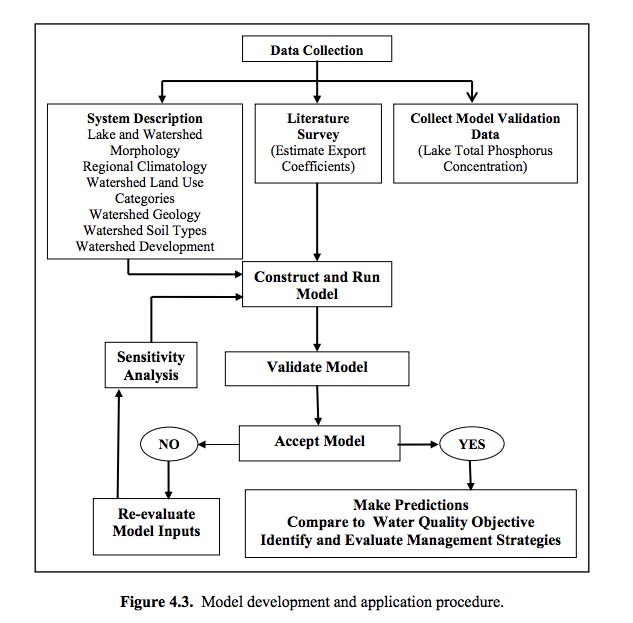
Data assimilated from existing literature and other sources is compiled and used to provide the necessary inputs for the model. The model is validated by comparing its prediction of the lake’s total phosphorus concentration with field measurements (see Section 9). If the model prediction and field data agree, the model is considered to be validated and can then be used to determine how changes in the model’s input parameters will affect the lake’s total phosphorus concentration. If the model prediction and field data do not agree, it will be necessary to review and re-evaluate the data used to estimate the model inputs. In the latter case, it may prove useful to carry out a sensitivity analysis of each model input (see Section 11).
From Brylinski 2004
Brylinski provides a detailed example of how model re-evaluation was conducted for a case – Lake George in Kings Co. in which “The model under predicts the lake’s phosphorus concentration by 21.9 % which is above the 20% difference generally considered acceptable for model validation.” None of the steps for re-evaluation were conducted by AECOM 2014 even though the predicted value exceeded the observed by a much larger factor; rather AECOM 2014 made the model work by “adjusting the lake phosphorus retention coefficient… from 0.33 to 0.6 in the LCM to reduce the predicted phosphorus concentration to match the measured phosphorus.” This is not a procedure cited by Brylinski 2004.
The MOE 2010 document cited by AECOM likewise adopts a maximum of 20% difference between observed and predicted P values as acceptable but is not as specific as Brylinksi about how to proceed if the difference is >20%.
If the modeled estimates and measured values are within 20 per cent of each other, then they aren’t considered to be significantly different. If the modeled estimates and measured values differ by more than 20 per cent, then lake managers should inspect the measured record for quality and the data used in the model for accuracy, consider alternative coefficients that may be more accurate, and consult other water quality measurements (i.e., Secchi depth and oxygen-temperature profile records).
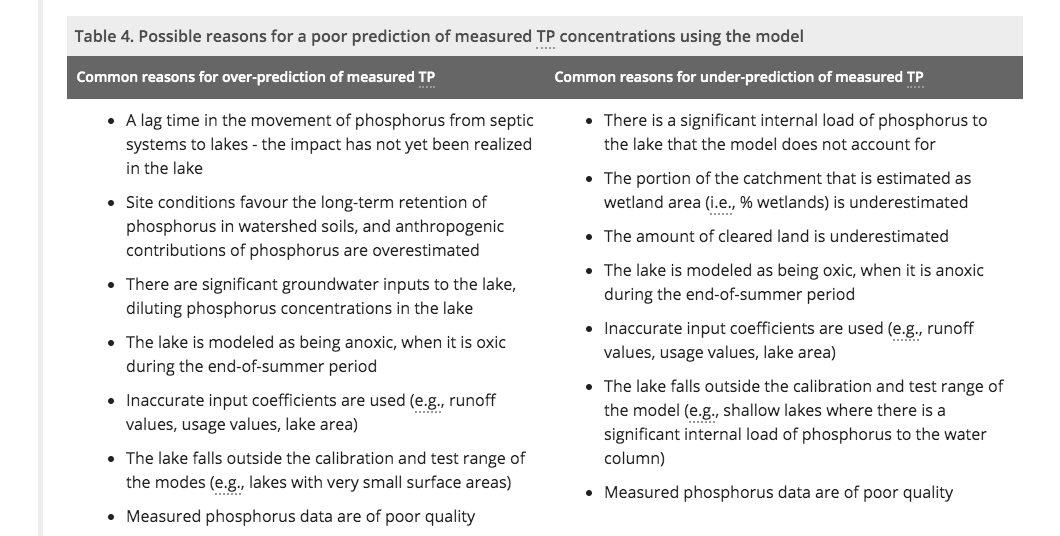
Many possible reasons for discrepancies are cited:
From MOE
What if the model fails?
The Ministry recommends that the Lakeshore Capacity model be used to manage the effects of shoreline development and land-use change on P concentrations in Precambrian Shield lakes. As outlined in Appendix A, this approach allows resource managers and planning authorities to assess changes relative to lake-specific PWQOs for phosphorus, to assess future risks from the cumulative effects of development, and to protect the trophic diversity of lakes across the province. However, in some cases the model may not predict phosphorus concentrations within acceptable limits, putting into question its applicability. In these cases, it is recommended that the interim PWQO for phosphorus be followed as a guideline (Section 2.2).
In both cases, a total phosphorus concentration of 20 µg/L will be used as the upper limit to protect against nuisance algal blooms. In situations where a lake is naturally above 20 µg/L (e.g., highly coloured, tea-stained lakes), Regional MOE staff may use discretion to allow a limited amount of new development (e.g., < 10 lots), provided the lake is not sensitive, and downstream lakes are not designated at-capacity.
As in Brylinski (2004), the MOE (2010) document makes no mention of a one-stop book-keeping fix for the model as applied by AECOM 2014. So the predicted impacts of development on lake Total P and mitigative measures must be regarded as highly hypothetical.
(ii) Further monitoring, as advised by AECOM 2014, has not been conducted. One route Brylinski and MOE advised to revising an invalid model is to conduct more monitoring and AECOM 2014 was explicit on the need for more monitoring. From page iii of the Executive Summary:
“The predictions from the phosphorus load model are consistent with observations of urbanization in other watersheds. However, the degree of influence of urbanization on water quality in Sandy Lake can only be approximated using the phosphorus load model because of limitations arising from assumptions and uncertainty in the application of the model. Therefore a robust water quality monitoring plan is proposed for the Sandy Lake watershed to provide a further assessment of current conditions and to evaluate the impacts of development on the water quality.”
Section 9 (p 42) in the AECOM Report provides specific recommendations for robust Water Quality Monitoring.
The report was submitted in 2014. In 2020, such monitoring has still not been initiated, and, I am told, a request for Secondary Planning in the study area of the AECOM report was submitted to HRM in the summer of 2020.
So we could be proceeding to secondary planning without any validation of the AECOM model as advised by AECOM, or revision of the model as advised by Brylinksi 2004. A factor that should be examined in the field: the possibility/likelihood of significant phosphorus retention in streams/watercourse wetlands; it could account for the large discrepancy between the observed and predicted values. From Brylinksi 2014:
The model makes no allowance for the assimilation of phosphorus within upstream rivers or streams entering a lake, or for tributaries contained within a lake’s drainage basin. This is a potentially serious limitation if the model is used to determine the permissible level of development within the watershed of a lake that has effluents entering lakes located downstream. If a downstream lake exceeds a phosphorus objective, no upstream development would be allowed.
The retention of phosphorus in streams and rivers can result from settling of particulate phosphorus, sorption of dissolved phosphorus to stream sediments, chemical precipitation of phosphorus, and uptake of phosphorus by benthic algae and macrophytes (Wagner et al. 1996). Behrendt and Opitz (2000) carried out a number of studies in which it was found that as much as 20 to 40 % of the phosphorus load was retained within streams before reaching the receiving water body – Bryinski 2004 p 73

Uplands Park Wastewater Treatment Facility – here the effluent enters an open, fenced wetland. View more pics in a Google Photo Album
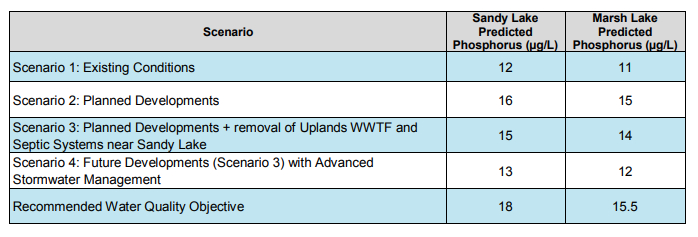
It is also assumed in the AECOM 2014 application of the model that there is no removal of P in effluent from the Uplands Park Waste Water Treatment Facility (IPWWTF) after it leaves the facility – even though the plant was designed with tertiary treatment to remove nutrients via a wetland, and there are further wetlands on the watercourse to Sandy Lake (view W and SW of S. Lake 2Oct2020). The quantitative benefit of diverting effluent to the Halifax system is very small as it is, the combined removal of Uplands WWTF and Septic Systems near Sandy Lake lowering the Sandy Lake Predicted P by only 1 ug/L (from 16 to 15 ug/L), surely well within any expected error limits (which are not given):
From the Executive Summary in AECOM 2014
While I think the benefits of removing Uplands WWTF and Septic Systems to reduce P loading are doubtful, there is likely significant value in doing so to reduce or even eliminate fecal contamination in Sandy Lake.
(iii) Setting The Water Quality Objective for Total P Sandy Lake at 50% above current value is not justified. There is evidence that at the current (2014) total P level, the lake deep water oxygen is significantly reduced from historic levels and that P is sometimes being released in the hypolimnion, thus the objective should be to move towards lower, historically oligotrophic values. Climate warming provides additional reason for setting a more stringent and conservative Water Quality Objective for Total P.
From AECOM 2014:
Historic water quality samples and water samples collected during the course of this study are used to identify water quality objectives for parameters that are influenced by development. The water quality in Sandy Lake and Marsh Lake is currently being affected by urban development as displayed by the increasing phosphorus concentration in Sandy Lake. Both Sandy Lake (12 μg/L) and Marsh Lake (10 μg/L) have median phosphorus concentrations that place them in the lower end of the mesotrophic range. Water quality objectives and early warning values are set at 18 μg/L and 15 μg/L for Sandy Lake and 15 μg/L and 13 μg/L for Marsh Lake respectively.
How were those levels set? Here is what AECOM has to say about it:
7.1 Development of Total Phosphorus Water Quality Objectives (WQO)
For the Sandy Lake watershed AECOM recommends the use of Environment Canada’s trophic status classification to set WQOs for total phosphorus.
As noted in section 1.2.1, an objective of the 2006 HRM Regional Plan is to “maintain the existing trophic status of our lakes and waterways”. This suggests that both Sandy and Marsh Lakes should be maintained in their current mesotrophic state and so the WQO for total phosphorus should be the upper limit of the mesotrophic range, or 20 g/L. However, since both lakes are currently at the lower end of the mesotrophic range, considerable water quality degradation could occur before the lakes were at risk of exceeding such a WQO.
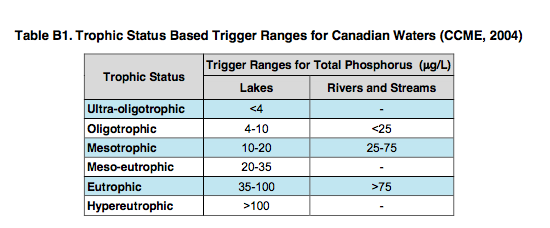
How does “maintain the existing trophic status of our lakes and waterways” justify setting the WQO 50% than the current value? According to this logic- or interpretation of the statement “maintain the existing trophic status of our lakes and waterways” – no efforts would be made to reduce phosphorus levels in lakes that currently have phosphorus levels highly elevated above recorded historic levels such as Banook Lake. All that is being maintained is the classification of the lake as mesotrophic.
AECOM 2014 in facts cites evidence that in its current state (at 12 ug/L phosphorus), Sandy Lake is already seriously degraded. In 1979, Total Phosphorus was 7 ug/L or less, well under the upper limit (10 ug/L P) for oligotrophy (the ‘clean’ state of a lake); the transition to mesotrophic status occurred circa 2001 (re AECOM Fig 9). AECOm 2014 presents evidence that by 2008, deep water Total P had incresed compaterd to surface water P, likely due to oyygen deprivation. FROM THE AECOM 2014 REPORT (text bolding inserted:
Table 5 compares the phosphorus concentrations of shallow (epilimnion) to deep (hypolimnion) samples from three sampling events. Total phosphorus concentrations in the shallow surface (epilimnion) samples are less than in the deep (hypolimnion) samples in two of the three examples. Although the data are limited, this suggests that the deeper portions of Sandy Lake may be fully or partially oxygen- deprived during certain times of the year, a situation that may arise when decomposing organic matter consumes available oxygen at depth. This in turn promotes the release of phosphorus from lake sediments, which is recorded in the water samples.

There have been very few measurements made of deep water oxygen levels in Sandy Lake On Oct 3, 2017, I conducted a standard limnological profile in the deepest area of Lake at which time the oxygen level was 2.25 mg/L. This is less than half of the value obtained on Aug 30 1971 when the lake was still in the oligotrophic range (that’s the only comparable historical data for Sandy Lake).
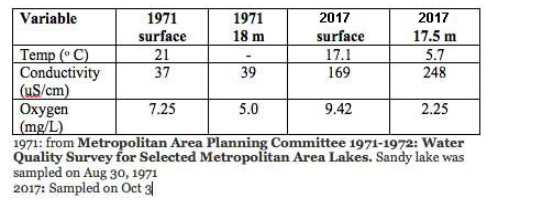
The Aug 30 1971 measurement was at ‘peak stratification’ when deep water oxygen would be at its lowest level. On Oct 3 2017, the 2 -layer stratification was in the process of breaking down, so it’s likely that earlier (in August), the deep water oxygen value was even lower.
So this observation confirms that, indeed, as AECOM inferred from the deep water phosphorus values, “Sandy Lake may be fully or partially oxygen- deprived during certain times of the year”. That condition results in the deep waters becoming inhospitable for desirable aquatic species such as salmonids and by inducing release of phosphorus from the sediment – which seems to be already occurring – sets up a positive feedback loop and accelerates the process of eutrophication and deterioration of the lake for both desirable fauna and human recreation.
In commenting that “that both Sandy and Marsh Lakes should be maintained in their current mesotrophic state and so the WQO for total phosphorus should be the upper limit of the mesotrophic range, or 20 g/L”, AECOM 2014 seems to have taken a cue from the MOE Ontario Minister of Environment) 2010 document as cited above in which it is suggested that “If the model fails….a total phosphorus concentration of 20 µg/L will be used as the upper limit to protect against nuisance algal blooms.”
Total P is a well validated and widely accepted predictor of the general condition of temperate lakes, but it is also well recognized it does not predict the precise condition of a particular lake. For a set of Ontario lakes, Malot et al., 1992 observed that “lake morphometry exerts a large influence on profiles and this influence is particularly evident in shallow (<20 m maximum depth) osligotrophic lakes” and that “Predictions of O2 profiles are sensitive to changes in TP concentrations, with all study lakes predicted to have severely O2-depleted hypolimnions by the end of summer at an epilimnetic TP of only 15 ug.L-1. At 21 m maximum depth, Sandy Lake could likewise be expected to very sensitive to TP concentrations and indeed the evidence suggests significant deterioriationin hyplimetic oxygen at 12 ug.L-1. So clearly, to keep Sandy lake from deteriorating further, we should be trying to reduce Total P, not to allow it to increase.
Climate warming…O2. and Gunnet al. etc.
Mechanisms not knowns; very possibly/likely wetlands so how would those affect mitigatove masures
(ii) Goal, arbitrary and too high, already signs. O2 P, BGA
(iii) temperature/oxygen; length of stratification
(v) Salt, perhaps most worrisome. Propotional to hard surfaces.% developed. S of HPR
Some issues recognized AECOM. Moitoring vitally imp. detailed. Not conducted
The relatively high EC values for streams to the southwest of Sandy Lake are concerning, as those areas are relatively light settled now. The area south of Hammonds Plains Road has been approved for development, while, apparently, a request has been put into HRM this past year (2020) for secondary planning for development just above HPR.
“It is more cost-effective to
manage urban development within the watershed in order to maintain established water quality objectives than to try
to improve or restore water quality after the lake has degraded to an unacceptable condition.” AECOM 2014,page 14
In keeping with direction given in the Regional Plan, the water
quality objectives recommended in this report are based on current or existing water quality. For this reason, the
discussion below focuses mainly on water quality data collected over the past five years, which is considered
representative of existing conditions. page 17
p31: Water quality objectives are set for indicator parameters that are sensitive to impacts from development. The
indicator parameters include:
Nitrate;
Total Suspended Solids;
Chloride;
E.coli; and
Phosphorus.
For the Sandy Lake watershed AECOM recommends the use of Environment Canada’s trophic status classification
to set WQOs for total phosphorus. As noted in section 1.2.1, an objective of the 2006 HRM Regional Plan is to
“maintain the existing trophic status of our lakes and waterways”. This suggests that both Sandy and Marsh
Lakes should be maintained in their current mesotrophic state and so the WQO for total phosphorus should be the
upper limit of the mesotrophic range, or 20 g/L. However, since both lakes are currently at the lower end of the
AECOM Halifax Regional Municipality Sandy Lake Watershed Study –
Final Report
2014 08 25 60303077 Sandy Lake Final Report 32
mesotrophic range, considerable water quality degradation could occur before the lakes were at risk of exceeding
such a WQO.
In an effort to maintain current water quality and meet the Regional Plan objective, we recommend a dual
management objective: (1) maintain the trophic status of the lake and (2) restrict total phosphorus increases to less
than 50% above current conditions. If a monitoring program shows that this WQO is being exceeded, then
management action would be warranted to protect the lake. In this approach the WQO becomes a “trigger value” for
action. This approach is consistent with the objectives of the Regional Plan, which seeks to maintain the existing
trophic status to the extent possible.
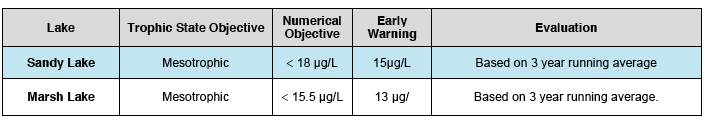
Lake-specific total phosphorus objectives and early warning values have been developed based on existing data.
Table 11 provides a summary of the total phosphorus water quality objectives and early warning values and a
method to evaluate whether or not the objective or alert value is being approached for each lake.
Table 11. Water Quality Objectives and Early Warning Values for Total Phosphorus

The development of national guidelines has been hindered by the need to consider the
following factors that affect the nature of phosphorus as a pollutant:
a) It is non-toxic and is a required and limiting nutrient in fresh water, such that small increases stimulate
aquatic productivity;
b) The natural or baseline water quality and trophic status for lakes varies extensively across Canada;
c) The detrimental effects of phosphorus are indirect, resulting from algal growth and oxygen depletion, and
so there is a lot of variation in phosphorus concentrations associated with observed effects;
d) The effects of phosphorus on primary biological production are modified by natural factors that attenuate
light (i.e., Dissolved Organic Carbon or turbidity). These factors can mask the effects of increased
phosphorus by reducing the biological response normally associated with elevated phosphorus
concentrations;
e) The effects of phosphorus on surface water are partially aesthetic (i.e., decreased water clarity), and so
determination of thresholds of effect is somewhat subjective; and
f) Phosphorus concentrations can vary substantially in surface water, as a result of season, differences
between river and lake systems and as a result of natural factors in the landscape such as geology, soils
and wetlands.