DRAFTING
Electrical Conductivity (EC) of water increases with increasing content of ‘salt’ in the water, where the word “salt” is used in the chemical sense.
The standard unit for electrical conductivity of water is ‘microsiemens per centimeter’ or uS/cm.
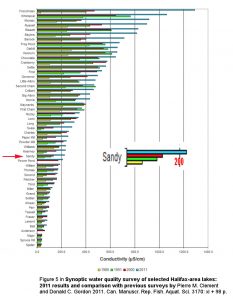
Values of electrical conductivity (EC) in the area of 30-60 uS/cm are typical of pristine lakes in the Halifax region. 7 EC values for Sandy Lake were in that range in 1955 and 1971, and 1980 (not in 1977 however) but samples taken from 1985 onward were well above 100 with an overall upward trend. The low values in 1955 and 1971 are consistent with the lake being well below the mesotrophic range in those earlier years (AECOM 2014, as cited above).

EC appears to have been stable up to 1971, then increases continuously. Only the 2020 value is a an average for values (11) over a whole year. View sources
Electrical conductivity (EC) tends to increase with urbanization.6 In Nova Scotia, our liberal use of road salt is blamed for much of the trend of increase in conductivity in EC of Halifax area lakes over the interval 1980-2000 as revealed in synoptic studies (see Figure at right)7
Limnological profiles of Sandy Lake obtained in 2017 and 2019 revealed that the deeper waters are saltier than surface waters, likely due to increasing salt input to the lake as the watershed has become more settled. If the trend continues, it could result in the lake not turning over (mixing) as it normally does in the fall and spring. View Limnological Profiles
Hence it is relevant to try to figure out where the salt is coming from. The salt content itself acts as a kind of tracer, and is easy and inexpensive to measure.
EC values for water around the perimeter of Sandy Lake in Aug of 2017 were highest at the inlet at the SW corner of the lake where Johnson’s Brook enters the lake. View Map. Several streams converge with Johnson’s Brook at Murphy’s Pit. Several followup sets of observations were made on these streams:

