
DEFINITION & MEASUREMENT
EDITING/REVISING
“EC” is shorthand for Electrical Conductivity, often referred to as just “Conductivity” It is a property of water routinely included in water quality measurements. Along with temperature and oxygen (and usually pH) it is one of the basic variables that is measured with multi-parameter water-quality instruments to characterize “vertical profiles” of lakes.
Conductivity, in particular specific conductance, is one of the most useful and commonly measured water quality parameters . In addition to being the basis of most salinity and total dissolved solids calculations, conductivity is an early indicator of change in a water system. Most bodies of water maintain a fairly constant conductivity that can be used as a baseline of comparison to future measurements. – from Fondriest
EC is a measure of the capacity of water to conduct electricity, a property than can be measured readily and reliably with very simple instruments.
The standard units for electrical conductivity in fresh waters are microsiemens per centimeter, µS/cm or sometimes without the special symbol for “micro” as uS/cm.
EC increases with ionic content.
Conductivity is a measure of water’s capability to pass electrical flow. This ability is directly related to the concentration of ions in the water. These conductive ions come from dissolved salts and inorganic materials such as alkalis, chlorides, sulfides and carbonate compounds.. Compounds that dissolve into ions are also known as electrolytes The more ions that are present, the higher the conductivity of water. Likewise, the fewer ions that are in the water, the less conductive it is. Distilled or deionized water can act as an insulator due to its very low (if not negligible) conductivity value. Sea water, on the other hand, has a very high conductivity. – Read more at Conductivity, Salinity & Total Dissolved Solids: What is Conductivity?on fondriest.com
The “limnologically important ions“ are the cations Ca2+ Mg2+ Na+ K+ NH4+ and the anions HCO3–, SO42- Cl– NO3– F– CO32-; the bolded ions typically account for 99% of the EC.
If all of the major ions (cations and anions) are measured, a “Theoretical Conductivity” can be calculated. Typically the calculated values are very close to observed values; if not it’s an indication that something has been missed in the ion analysis, e.g., metals that could be entering surface waters from mining operations. View Calculating the conductivity of natural waters by Rich Pawlowicz Limnol. Oceanogr.: Methods 6, 2008, 489–501. A Simplified Model to Estimate the Concentration of Inorganic Ions and Heavy Metals in Rivers by Clemêncio Nhantumbo et al., Water 2016, 8, 453
“Specific Conductance” is the EC at 25°C
Conductivity increases approximately 2-3% per 1°C increase in temperature, though in pure water it will increase approximately 5% per 1°C 11. This variation is why many professionals use a standardized comparison of conductivity, known as specific conductance, that is temperature corrected to 25°C – from Fondriest
The meter we have been using for most EC measurements, the AP-2: AquaPro Water Quality Tester (EC) provides Automatic Temperature Compensation
TDS or Total Dissolved Solids is the weight of all particles smaller than 2 microns in water, expressed as milligrams per liter, mg/L and is measured by measuring the weight remaining when all of the water in a sample has evaporated. In “clean water”, TDS are made up mostly of ionic substances and there is a close relationship between TDS and EC, so TDS can be estimated from the more readily measured EC. The exact relationship varies with ionic composition (see Fondriest article). “Dirty water” may include significant components of small non-ionic substances such as urea and hydrocarbons; for such waters, there may be a very poor relationship between TDS and EC (see Rusydi, 2017 for examples).
Salt, Salinity EC increases with increasing content of “salts” as defined chemically, so EC could be thought of as a measure of the salt content. “Salty waters” are waters with sufficiently high content of common ions that they taste “salty”. “Salinity” is a term generally applied only to seawater. Seawater has highly consistent proportions of the major ions and so there is a highly consistent relationship between “salinity” as traditionally measured in seawater* and electrical conductivity; today salinity of seawater is generally determined by measuring its electrical conductivity and applying particular formulas or conversion factors to give the “salinity” in units that describe the weight of salt in a kilogram of seawater, typically g/kg or “parts per thousand”, ppt. Typical seawater has values in the range of about 32 to 35 g salt/kilogram of water (32-35 ppt).
__________________
*By determination of chloride content or the “chlorinity”; or from measurement of the weight of a sample of water of known volume at a known temperature, i.e. its “density”, the weight per unit volume.
The units for salinity are similar to units for TDS, except TDS is expressed per liter of water not per kilogram; one kilogram of pure water occupies one liter (a density of 1 g/mL) at 4 deg C. The differences are very small numerically, but can be important in relation to oceanographic calculations that involve density.
Factors relating EC, TDS and Chloride
Using Electrical Conductivity and Total Dissolved Solids Meters to Field Test Water Quality
Tom Scherer et al., 2019. North Dakota State University. Electrical Conductivity (EC) as a measure of the TDS content (view conversion factors)
Conductivity, Salinity and Total Dissolved Solids
Fondriest Environmental, Inc. 3 Mar 2014. Web. Units of measurement etc.
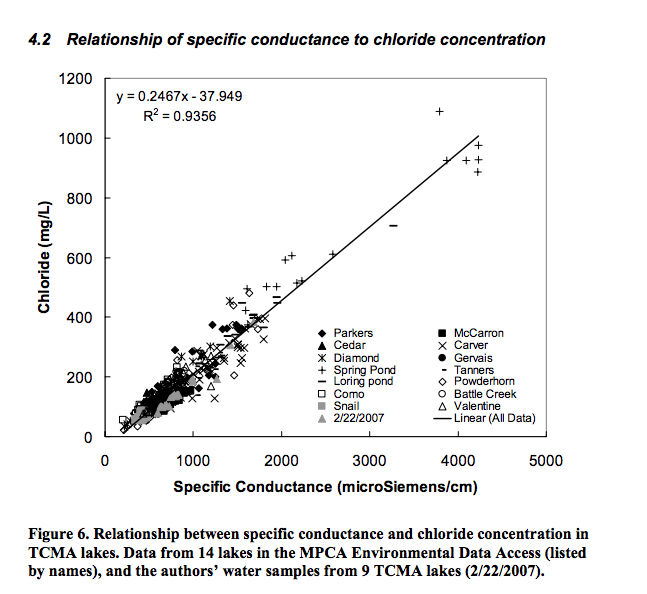
From Novotny et al., 2007
Road Salt Effects on the Water Quality of Lakes in the Twin Cities Metropolitan Area
Novotny et al. 2007. ST. ANTHONY FALLS LABORATORY Engineering, Environmental and Geophysical Fluid Dynamics Project Report No. 505
[Cl-] = 0.2467 * SC – 37.949. where [Cl-] is the chloride concentration in mg/L and SC is the specific conductance in µS/cm. This equation was used to convert specific conductance measurements to chloride concentrations. (R2 = 0.96).
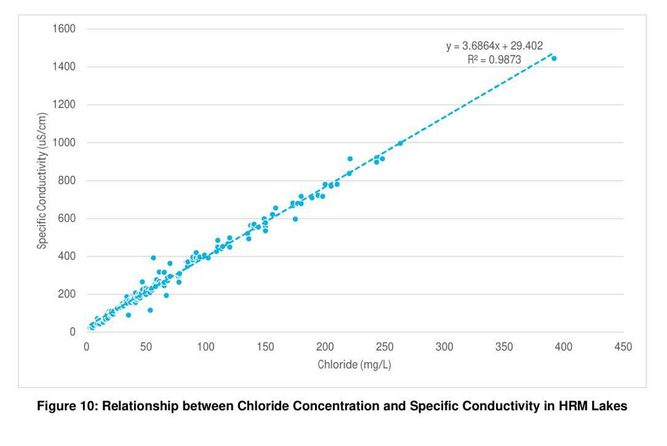
From AECOM 2020
AECOM 2020: Chloride Concentration (mg/L) = 0.268 * Specific Conductivity (uS/cm) — 6.9
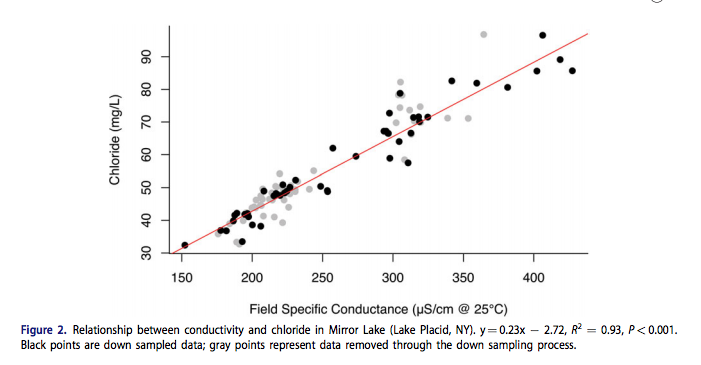
From Wiltse et al., 2019
A reduction in spring mixing due to road salt runoff entering Mirror Lake (Lake Placid, NY)
by B. Wiltse et al., 2019, Lake and Reservoir Management 36:109–121 [Cl-]=0.23 * SC -2.72
Williams Lake, Halifax. Nova Scotia: An Investigation of the Aquatic Ecosystem of an Urbanizing Watershed
Scott, R. 1992. Report to Nova Scotia Department of the Environment, 39 pp
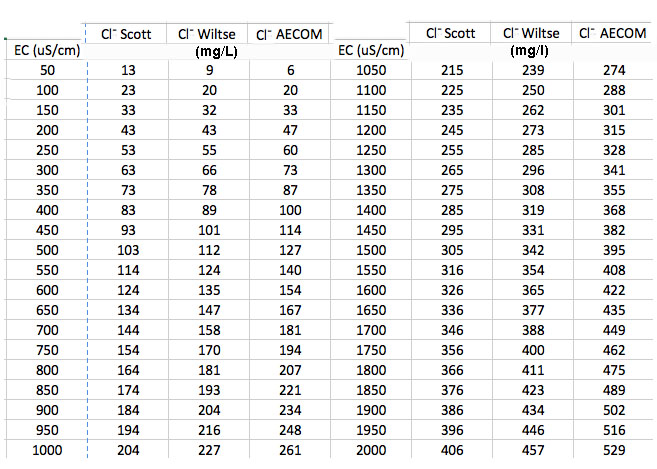
Scott (1992) observed a close linear relationship between chloride and specific conductance: Chloride (mg/L) = 0.202 (specific conductance umhos/cm) + 2.48 (r2 = 0.981, n = 68)
Conversion of EC (uS/cm) to chloride (mg/L)
asdaasda
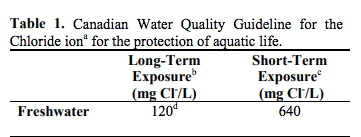
From CCME. 120 mg chloride/L=581 uS/cm & 640 mg chloride/L=3156 uS/cm by the Scott relationship
By the conversion given in AECOM 2020 for Halifax area lakes, 120 mg/L Cl- is equivalent to 474 uS/cm, 640 mg/L Cl- to 2414 uS/cm
TYPICAL EC VALUES*
| Water Type | Electrical Conductivity (uS/cm) |
| Distilled water | 0.5 – 3 |
| Melted snow | 2 – 42 |
| Tap water | 50 – 800 |
| Potable water | 30- 1500 |
| Freshwater streams | 50 – 2000 |
| Industrial wastewater | 10,000 |
| Seawater | 50,000 |
*From Conductivity, Salinity & Total Dissolved Solids: What is Conductivity on fondriest.com; except that the lowest value for freshwater streams was changed from 100 to 25 to better represent values in Nova Scotia.
Most lakes without significant development or seawater influence in NS have values in the range 30 to 400 uS, the higher values commonly associated with lakes with high calcium content in areas of gypsum or limestone deposits – View Nova Scotia Lake Chemistry Data
In the Halifax area, EC values of pristine lakes and associated streams are typically fall within the range 30-60 uS/cm – View Synoptic water quality survey of selected Halifax-area lakes : 2011 results and comparison with previous surveys Pierre M. Clement and Donald C. Gordon 2011. Can. Manuscr. Rep. Fish. Aquat. Sci. 3170: xi + 98 p.
SOURCES & VARIATION OF EC IN FRESH WATERS
- Bedrock & Soils
In streams and rivers, normal conductivity levels come from the surrounding geology 1. Clay soils will contribute to conductivity, while granite bedrock will not. The minerals in clay will ionize as they dissolve, while granite remains inert. Likewise, groundwater inflows will contribute to the conductivity of the stream or river depending on the geology that the groundwater flows through. Groundwater that is heavily ionized from dissolved minerals will increase the conductivity of the water into which it flows. – from Fondriest
- Ecoregion
EC tends to vary with Ecoregions which are “areas of relative homogeneity based on landuse, soils, land and surface form, and potential natural vegetation” – see Water on the Web/Ecoregions for examples.
- Area of watershed/Area of Lake
The size of the watershed (lake basin) relative to the area of the lake (Aw : Ao ratio) – A bigger watershed to lake surface area means relatively more water draining into the lake because of a bigger catchment area, and more contact with soil before reaching the lake. (On Water on the Web)
- Clearcutting/Soil Disturbance
Effects of Forest Cutting and Herbicide Treatment on Nutrient Budgets in the Hubbard Brook Watershed‐Ecosystem
Gene E. Likens et al., 1970. A classic field scale experiment. “All vegetation on Watershed 2 of the Hubbard Brook Experimental Forest was cut during November and December of 1965, and vegetation regrowth was inhibited for two years by periodic application of herbicides…Electrical conductivity increased about 6—fold in the stream water after deforestation and was much more variable.”On-farm measurements of pH, electrical conductivity and nitrate in soil extracts for monitoring coupling and decoupling of nutrient cycles
D.G. Patriquin et al., 1993. Biological Agriculture and Horticulture 9: 231-272 “Concepts of interacting nutrient and proton cycles, “decoupling” of mineralization and uptake, and the steady state soil solution, developed mainly to assess impacts of acid rain on forests and their catchment waters, are very pertinent to biological agriculture. In particular, they illustrate how decoupling of soil-plant nitrogen cycling also decouples cycling of protons and basic cations (chiefly Ca, Mg, K), and can result in acidification of soil and in loss of cations as well as of nitrate.”
- Solubilization of Iron and Manganese in Hypolimnion
The Exchange of Dissolved Substances between Mud and Water in Lakes
Clifford H. Mortimer 1942. Journal of Ecology 30: 147-201 Classic (foundational) paper linking solubilization of iron and manganese and phosphorus under anoxic conditions. Over the anoxic period, EC rose by about 40 uS/cmChesley Lake 1991 Water Quality Assessment
Ontario Ministry of Environment, 1993 Illustrates increase in electrical conductivity of about 30 uS/cm in hypolimnion water associated with anoxia and release of iron and manganese. Phosphorous is also released.Water Quality Assessments – A Guide to Use of Biota, Sediments and Water in Environmental Monitoring
Second Edition Edited by Deborah Chapman © 1992, 1996 UNESCO/WHO/UNEP. p. 338: “Depletion of oxygen in lake bottom waters and the onset of anoxia results in the remobilisation of phosphorus and other elements from lake sediments. This mechanism was described by Mortimer (1942) and has been the subject of many investigations. Project Hypo (Bums and Ross, 1971) followed the release of phosphorus during anoxia in the hypolimnion of Lake Erie. It was also noted that with decreasing redox potential, manganese was the first element to be released from bottom sediments to the hypolimnion, followed by the synchronous release of iron and phosphorus. The association of phosphorus with iron in bottom sediments has been well established (e.g. Williams et al., 1976) and the reduction of Fe3+ to soluble Fe2+ results in the release of phosphorus. Other elements adsorbed by, or co-precipitated with, the oxides of iron and manganese are also released to the bottom waters under anoxic conditions.”
- Bacterial Metabolism in the Hypolimnion
On Water on the Web
“…when lakes are thermally stratified for long periods of time (in Minnesota this might be May – November depending on the basin shape, lake depth and weather). During this period, there is a steady “rain” of detritus (dead stuff, mostly algae and washed in particulate material from the watershed) down to the bottom. This material is decomposed by bacteria in the water column and after it reaches the sediments. Their metabolism releases the potential energy stored in the chemical bonds of the organic carbon compounds, consumes oxygen in oxidizing these compounds, and releases carbon dioxide (CO2) after the energy has been liberated (burned). This CO2 rapidly dissolves in water to form carbonic acid (H2CO3), bicarbonate ions (HCO3- ) and carbonate ions (CO3-) the relative amounts depending on the pH of the water. This newly created acid gradually decreases the pH of the water and the “new” ions increase the TDS, and therefore the EC, of the hypolimnion.”
- Wastewater
– wastewater from sewage treatment plants (point source)
– wastewater from septic systems and drainfield on-site wastewater treatment and disposal systems (nonpoint source)(Water on the Web)
– Home wastewater, e.g., associated with use of table salt, water softeners (Chlorides in Fresh Water)
- Fertilizers
Agricultural runoff of water draining agricultural fields [&lawns, turfs etc] typically has extremely high levels of dissolved salts. mostly due to potash (potassium chloride and/or potassium sulfate).
- Roadsalts
From Chlorides in Fresh Water by Molly Hunt et al. 2012:
The use of road salts for deicing in snow-belt states such as Rhode Island began in the 1940s and sharply increased in the 1970s. Chlorides are the “active” ingredient in most commercial deicers, whether they are made with sodium chloride or new alternatives like potassium chloride. When ice and snow begin to melt in the winter and spring, chloride concentrations spike in roadside streams due to road runoff. When roads are pretreated in anticipation of snow and ice but precipitation comes as rain, chloride from pretreatments is washed off with stormwater. Uncovered salt storage piles lose about 20% of their salt each year, much of which finds its way into nearby waterways.
Chloride concentrations tend to be higher in areas with pavement and other treated surfaces because stormwater and snowmelt runoff does not have a chance to soak into the ground before entering rivers, lakes, and streams. Road salts travel farther from roads when the speed limit is high; they have been observed traveling over 40m (130 ft) from the side of major highways (Karraker, 2008). Concern over the release of sodium into the environment has prompted many communities to switch to other chloride road salts; however, these salts may be more toxic to aquatic organisms than sodium chloride road salts (Mount et al., 1997). Commercial road salts have phosphorus compounds added to keep them from clumping, contributing nutrient increases in lakes and streams. Road salts often have heavy metal additives, so high chloride concentrations may indicate the presence of other harmful substances in lakes and streams.
Acid Rain/Watershed effects
Population density of Brown trout (Salmo trutta) in extremely dilute water qualities in mountain lakes in southwestern Norway.
Enge, E.; Kroglund, F. 2011 Water, Air, Soil Pollut.219, 489−499. We have examined populations of brown trout in low conductivity mountain lakes (5.0-13.7 mu S/cm and 0.14-0.41 mg/l Ca) in southwestern Norway during the period 2000-2010. Inlets to the lakes were occasionally even more dilute (2007; conductivity = 2.9-4.8 mu S/cm and Ca = 0.06-0.17 mg/l). The combination of pH and conductivity was the best predictor to fish status (CPUE), indicating that availability of essential ions was the primary restricting factor to fish populations in these extremely diluted water qualities. We suggest that conductivity < 5 mu S/cm is detrimental to early life stages of brown trout, and subsequently that there are lakes in these mountains having too low conductivity to support self-reproducing trout populations. Limited significance of alkalinity, Ca, Al, and color suggests that effects of ion deficit apparently overruled the effects of other parameters.
Also view: EC & Lake Stratification (This Website)
Urban Development – HRM
Identifying lake water quality trends and effective monitoring strategies in a rapidly urbanizing region
Casey Doucet, 2022. Masters Thesis, Dalhousie University “This thesis analyzed water quality trends in a set of ~50 lakes that have been sampled on a decadal-basis over a 40-year period in the Halifax Regional Municipality (HRM). Trophic state was also tracked in a subset of lakes over the 2021 open-water season to evaluate common and novel strategies for monitoring lake health. Aluminum, chloride, manganese, and arsenic concentrations were found to exceed national guidelines for the protection of aquatic life in one or more of the study lakes in 2021. Urban development was identified as an important driver of increasing chloride, conductivity, sodium, calcium, and total phosphorus (TP) concentrations. Regional factors, including climate change and decreasing acid deposition, hydrology, and watershed characteristics are believed to be stronger drivers of other observed changes. Decadal spring synoptic surface sampling was determined to be useful at highlighting emerging water quality concerns but may be less effective at characterizing parameters that are more spatially and temporally variable, such as nutrients, particularly in lakes where internal P loading occurs.Assessing and predicting Lake Chloride Concentrations in the Lake-Rich Urbanizing Halifax Region, Canada
Tessa Bermarija et al., 2023 in Journal of Hydrology “Highlights• [Cl-] was correlated with urban cover, road density, and stormwater pipe density. • Annual Cl- loading rates were developed for urban land uses.• A mass balance model was developed to predict Cl- loading to lakes.Long-term evaluation of the impact of urbanization on chloride levels in lakes in a temperate region
Scott et al., 2019. J. Environ. Manag. The application of road salts for winter de-icing of roadways in cold regions has been demonstrated to increase chloride (Cl) concentrations in nearby surface waters and have a negative impact on aquatic organisms and processes. In addition to toxicity to aquatic organisms, high concentrations of Cl in lakes can alter mixing processes, resulting in prolonged anoxic conditions and associated water quality degradation. Elevated concentrations of Cl in freshwater environments in cold regions is a well-documented phenomenon, but few studies have undertaken a long-term evaluation of the impact of urbanization on lakes. In this paper, nine lakes in the Halifax region of Nova Scotia, Canada, were monitored over 35 years to observe Cl concentrations prior to, during, and after urbanizing development. Cl concentrations were observed to increase in most study lakes over the monitoring period and all nine exhibited seasonal trending in response to winter de-icing activities. Six of the lakes achieved a steady-state Cl level after an initial increase in response to development activities, two are potentially still in transition, and one was unaffected by development activities. Watershed land use was found to be a good predictor of the springtime concentration of Cl and can help to inform decision-making surrounding development activities. When the percent of developed land was 25% or more, the Cl concentrations tended to exceed Canadian freshwater quality guidelines for the protection of aquatic life.”
Effect of Road Salt on Soil and Water Properties in Halifax, Nova Scotia
Sahana J. Kanabar Honours Thresis, SMU
Applied landscape geochemistry and environmental change in Nova Scotia, Canada
P Rogers, W Jones – Atlantic Geology, 2018
Also related.
Electrical conductance – a versatile guide in freshwater science
J.F. Talling 2009. Freshwater Reviews 2, pp. 65-78
Can you determine water hardness from conductivity or total dissolved solids measurements?
On global.com
The influence of ion composition of water on its electrical conductivity
Ivan Tikhonov on tiwater.info
The conductivity of low concentrations of co2 dissolved in ultrapure water from 0-100°c
Truman S. Light et al., 1995. Paper presented at the 209th American Chemical Society National Meeting, Anaheim, CA, April 2-6, 1995
A practical approach to lake water density from electrical conductivity and temperature
Santiago Moreira et al., 2016 Hydrol. Earth Syst. Sci., 20, 2975–2986
Can we keep our freshwater fresh?
By Angela Wallace, Calvin Hitch, Jonathan Ruppert, Krista Chomicki, Lyndsay Cartwright, and Tim VanSeters -March 11, 2022 for Water Canada
Road Salt and Water Quality
New Hampshire Dept Environment Doc WMB-4, published 2021. Includes descriptions of various types of salt and additives
An odd discrepancy in the EC-Temperature relationship
As stated above, “Conductivity increases approximately 2-3% per 1°C increase in temperature”. Bruce S. in his volunteer monthly monitoring of EC in surface waters associated with Sandy Lake, makes in-situ measurements of temperature and EC, and then brings a sample back to his home which he leaves at room temperature overnight and then measures them again the next day. We have kept records of these dual measurements – see Original Field Observations on the Seasonal Monitoring page – and typically the next-day EC values are somewhat higher (as is the temperature).
In 2023 he began occasional sampling of some standing water near a salt pile within the watershed. Here are two sets of values:Upper Pond by salt storage
Date EC (uS/cm) Temp (deg C) May 5 1693 12.6 Next Day 908 17.7 May 8 3066 14.3 Next Day 2107 20.4 I had commented that I thought the Next Day value for the May 5 sample was odd, so he took another sample, and obtained similar results. Clearly, EC decreased after overnight incubation/higher temperature. This suggests there was some chemical changes overnight, perhaps related to an additive in the road salt.