
More to come..
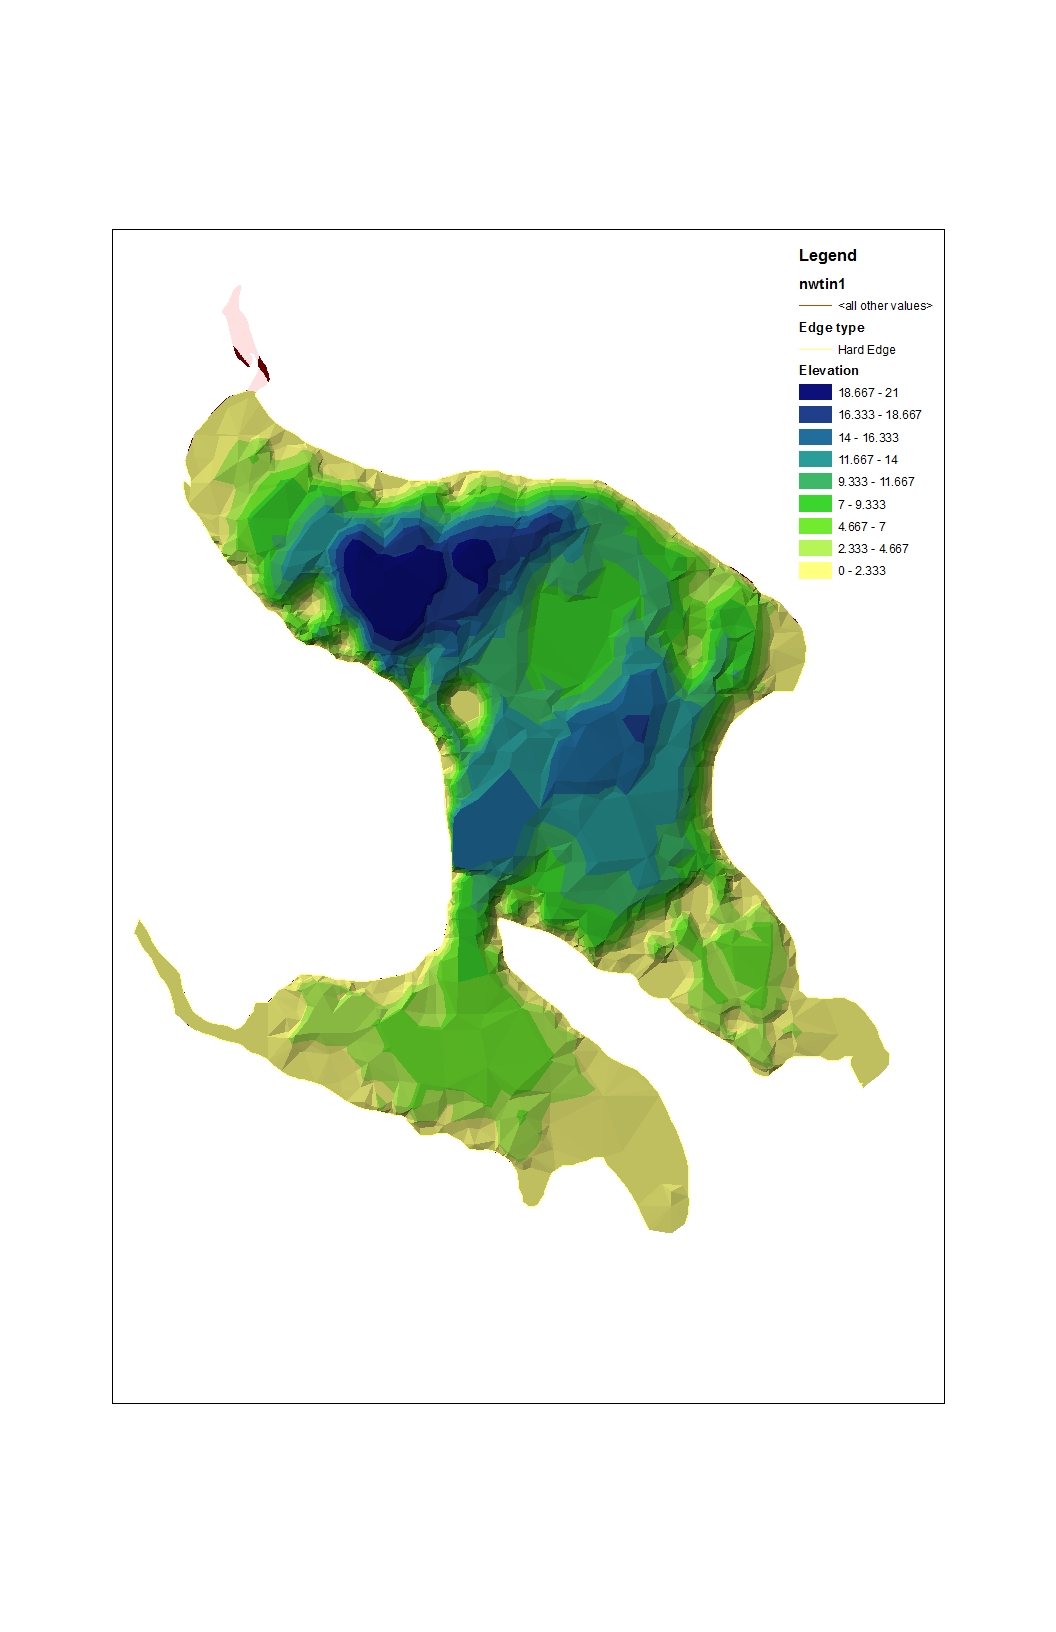
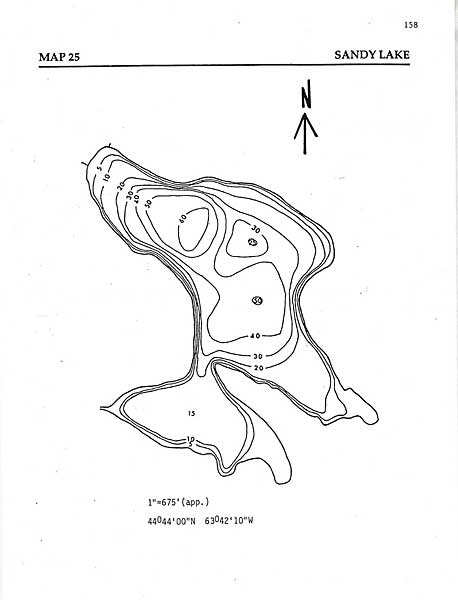
Sandy Lake Bathymetry
Map by Ed Glover, 2006
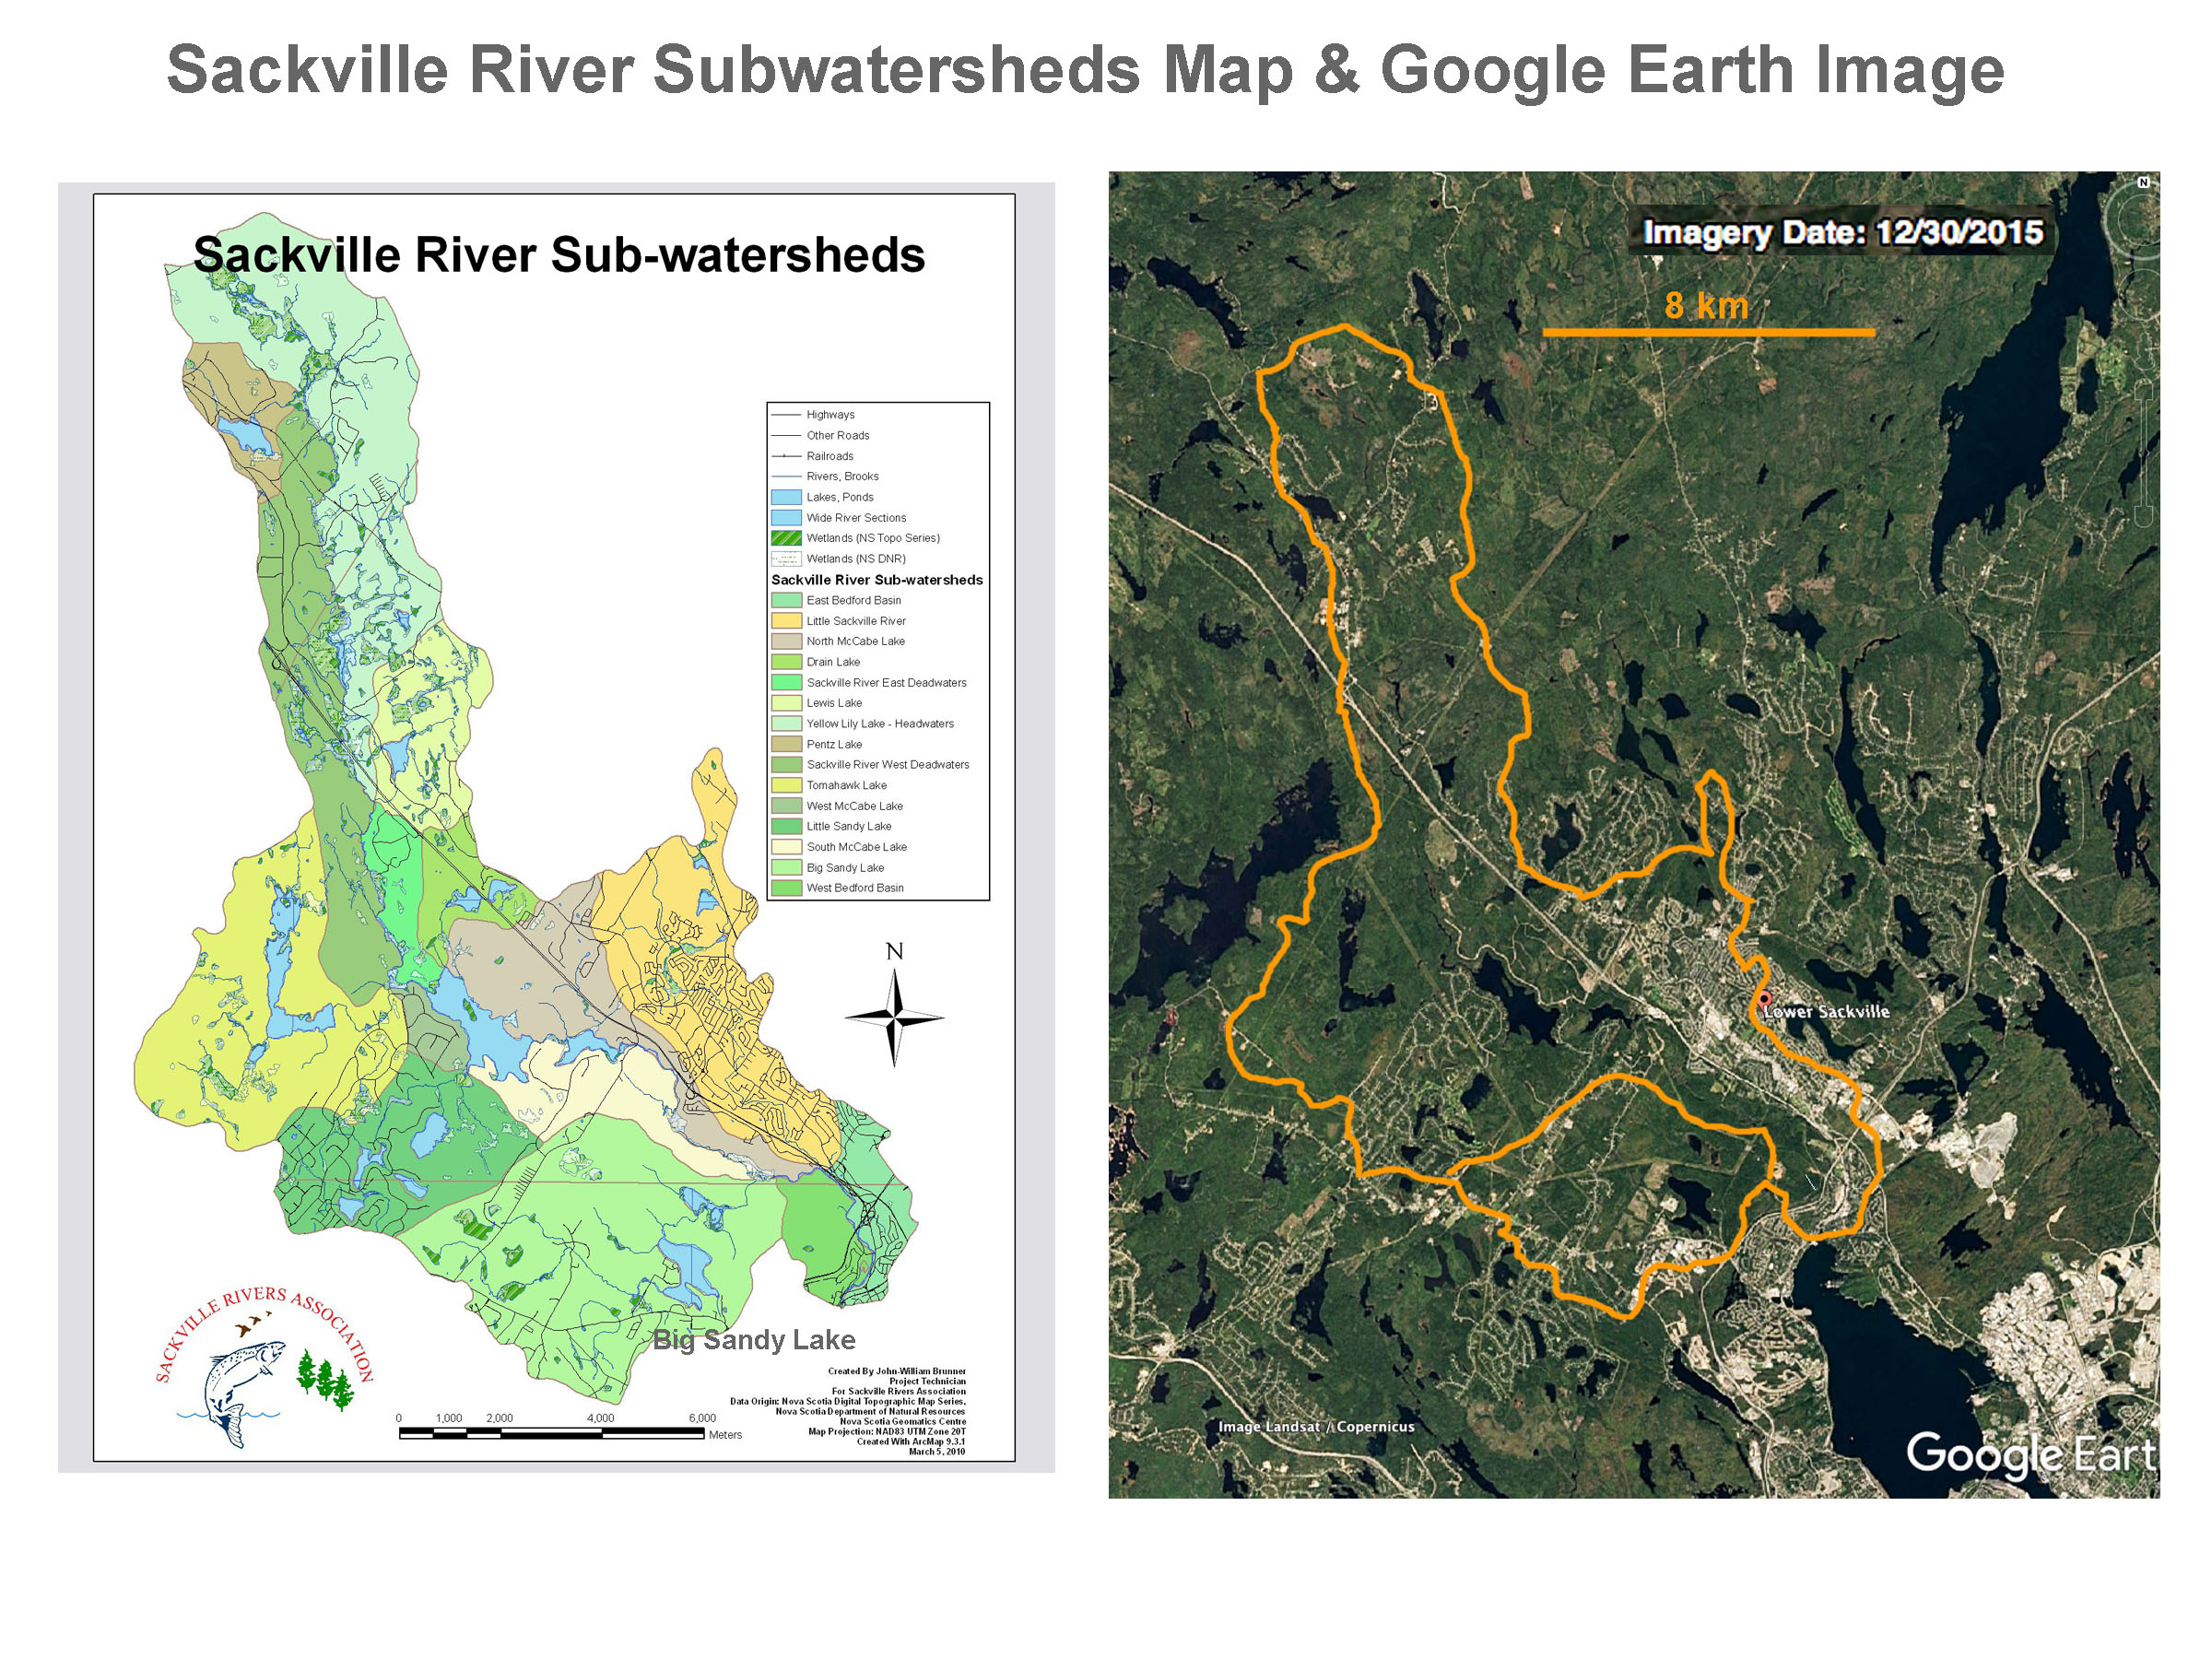
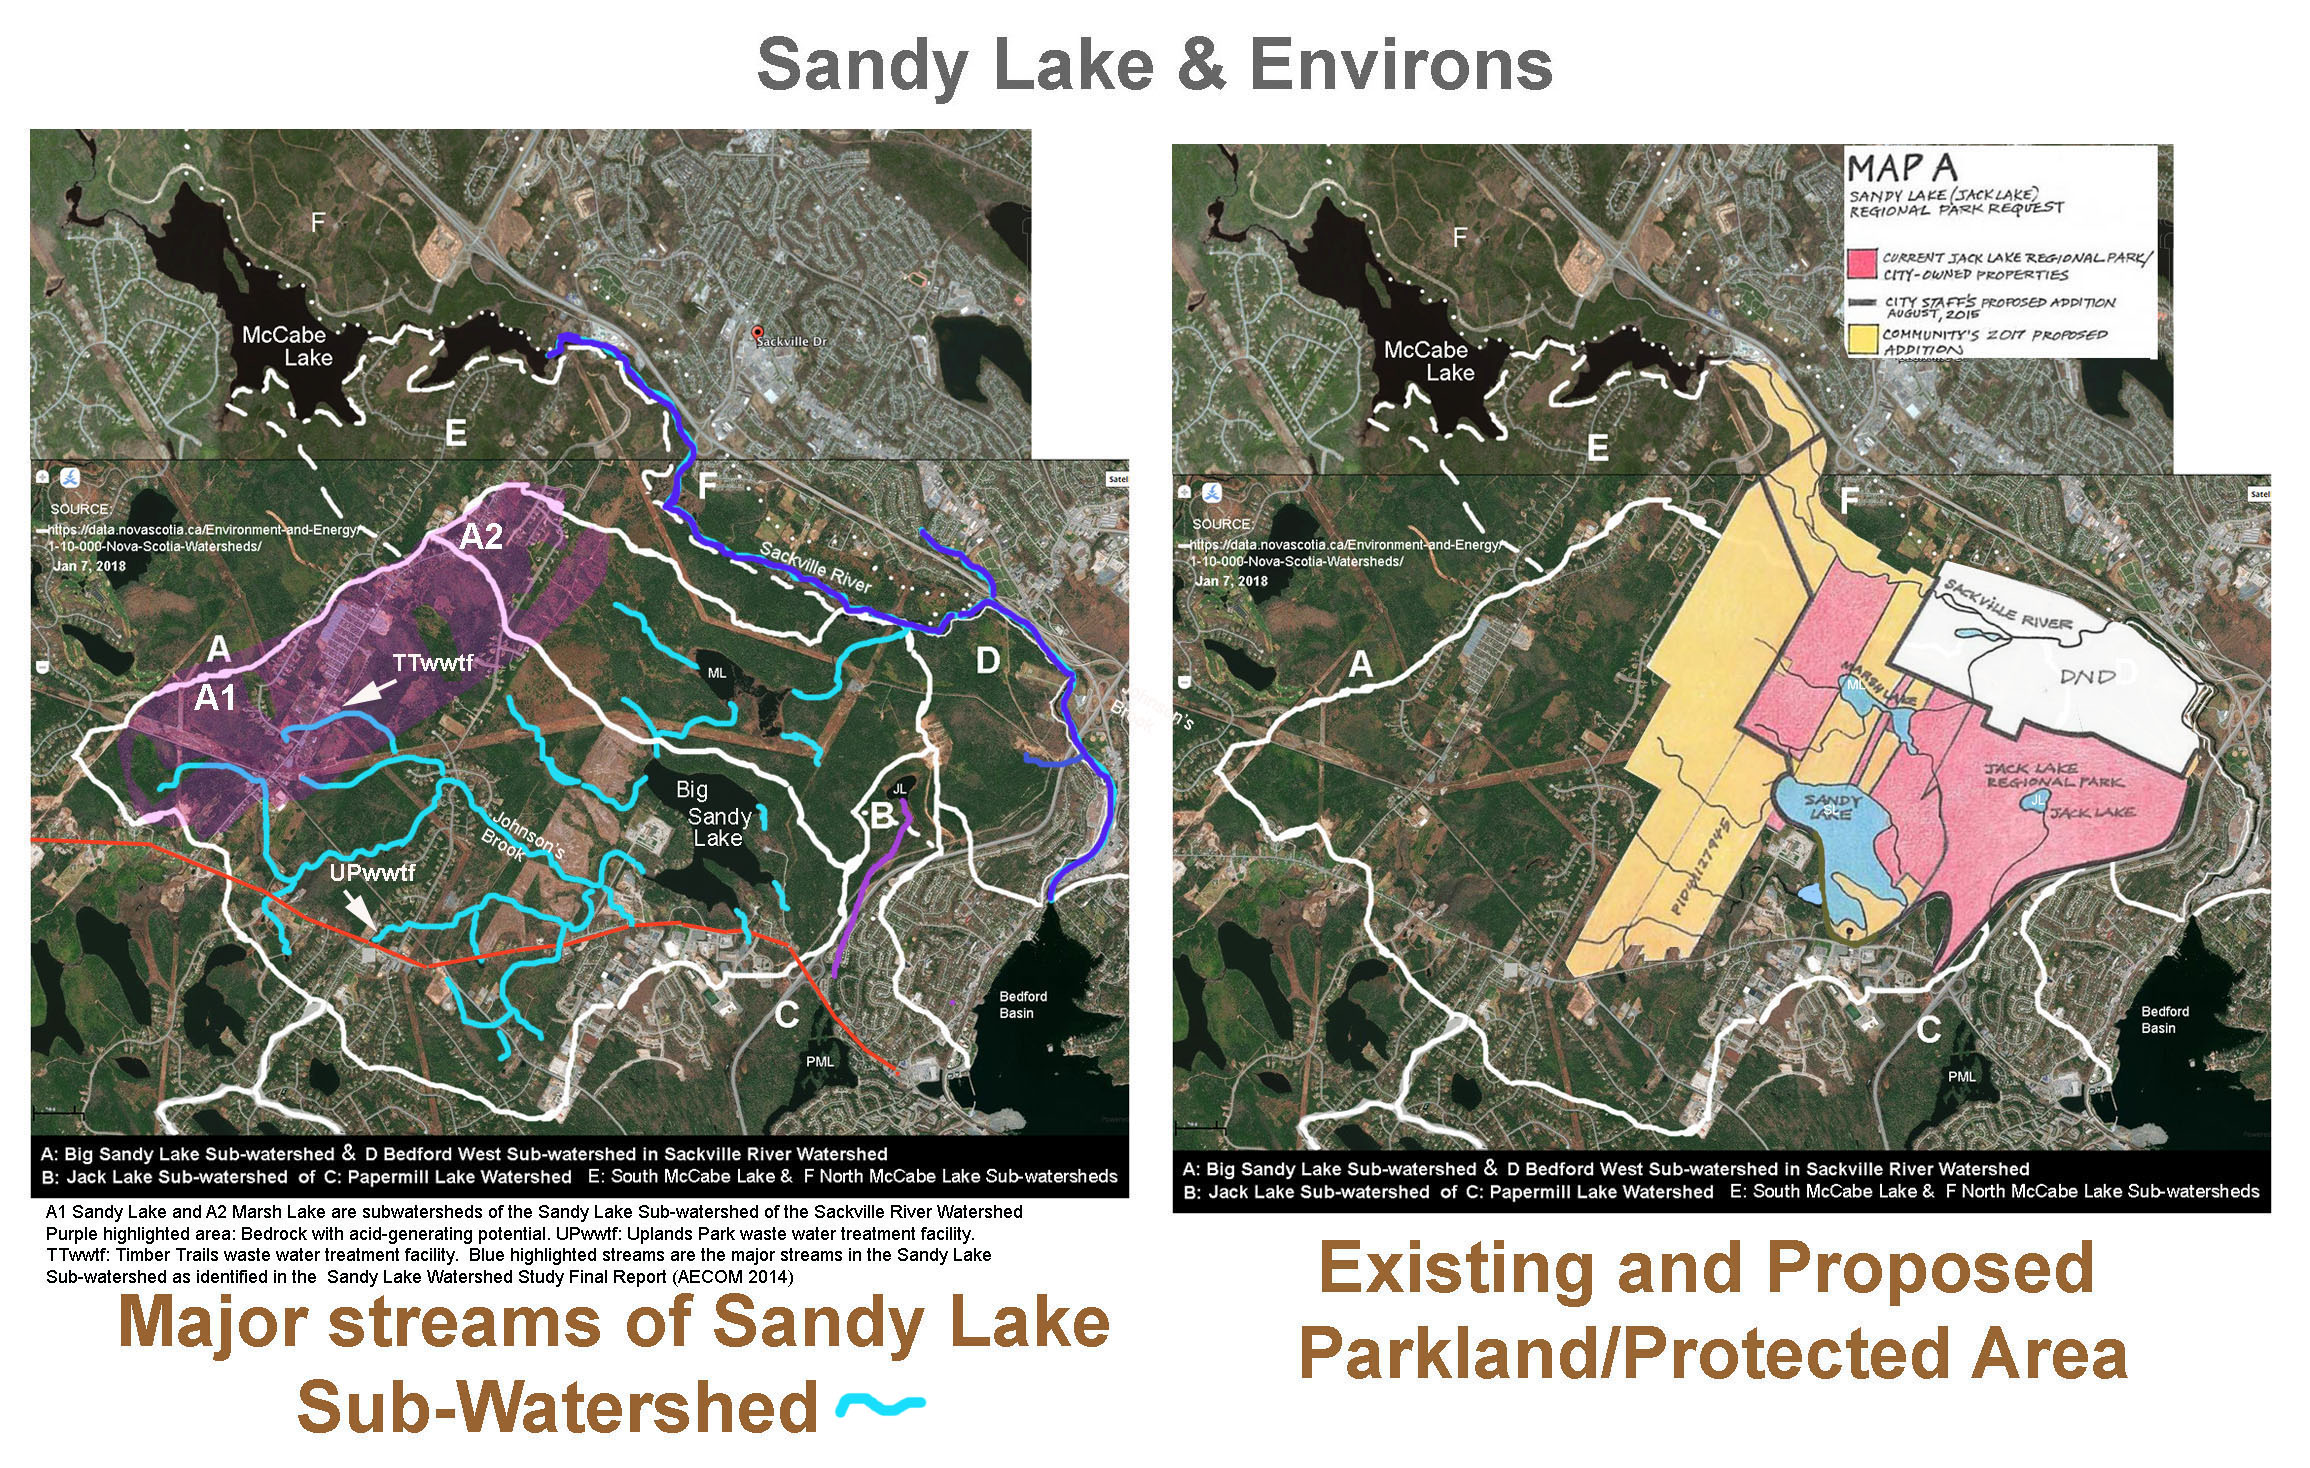
Watershed Maps
Sackville River Watershed – Subwatersheds & Google Map*
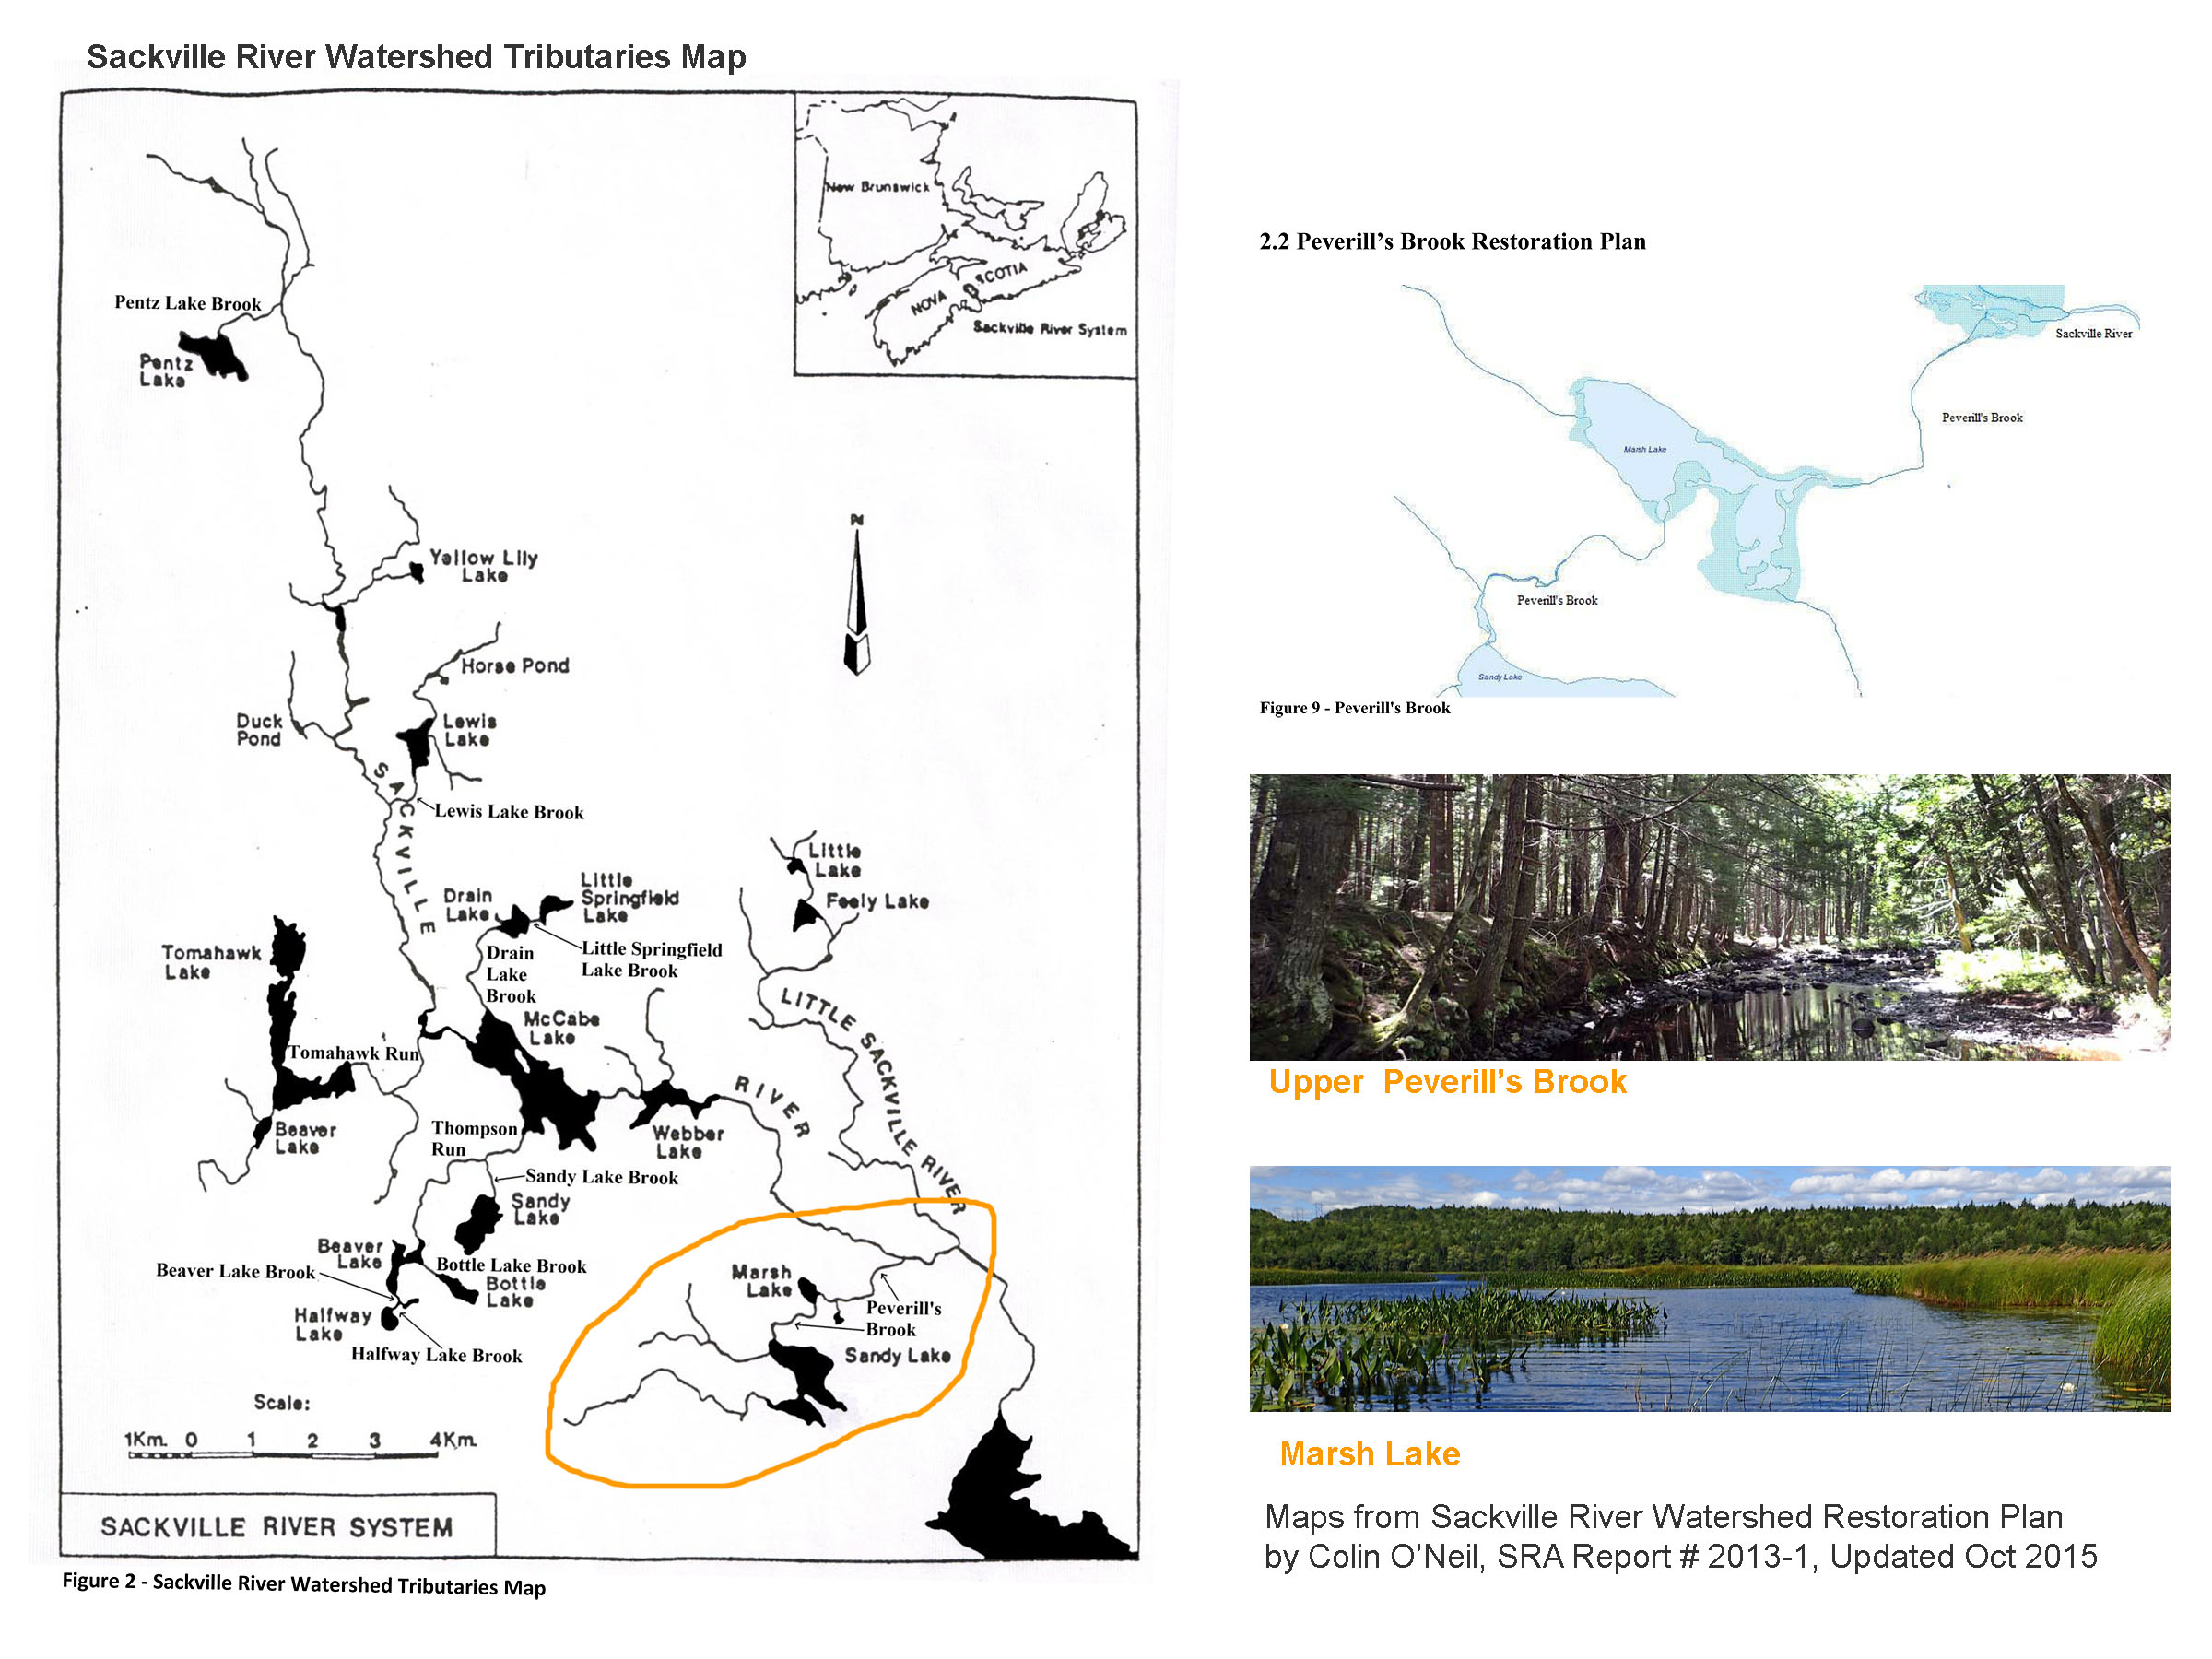
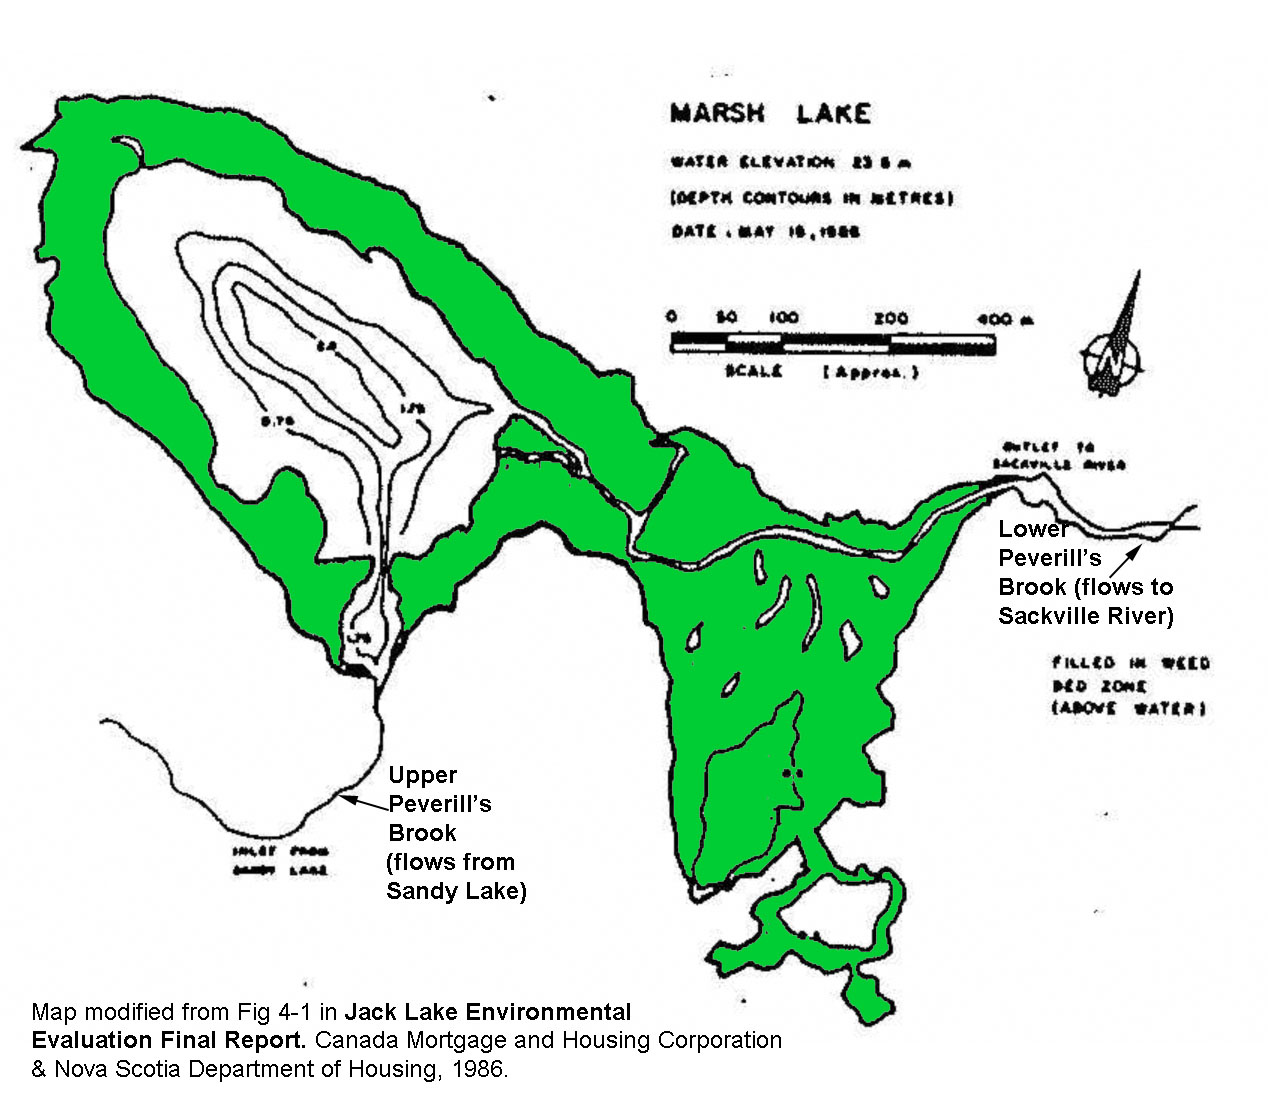
Sackville River Tributaries Map & Peverill’s Brook
Major streams of the Sandy Lake sub-watershed
_________________
*These maps include Google Earth maps on which I have sketched in watershed and park boundaries (by combining the maps in Photoshop layers and tracing boundaries), i.e. these boundaries are approximate.
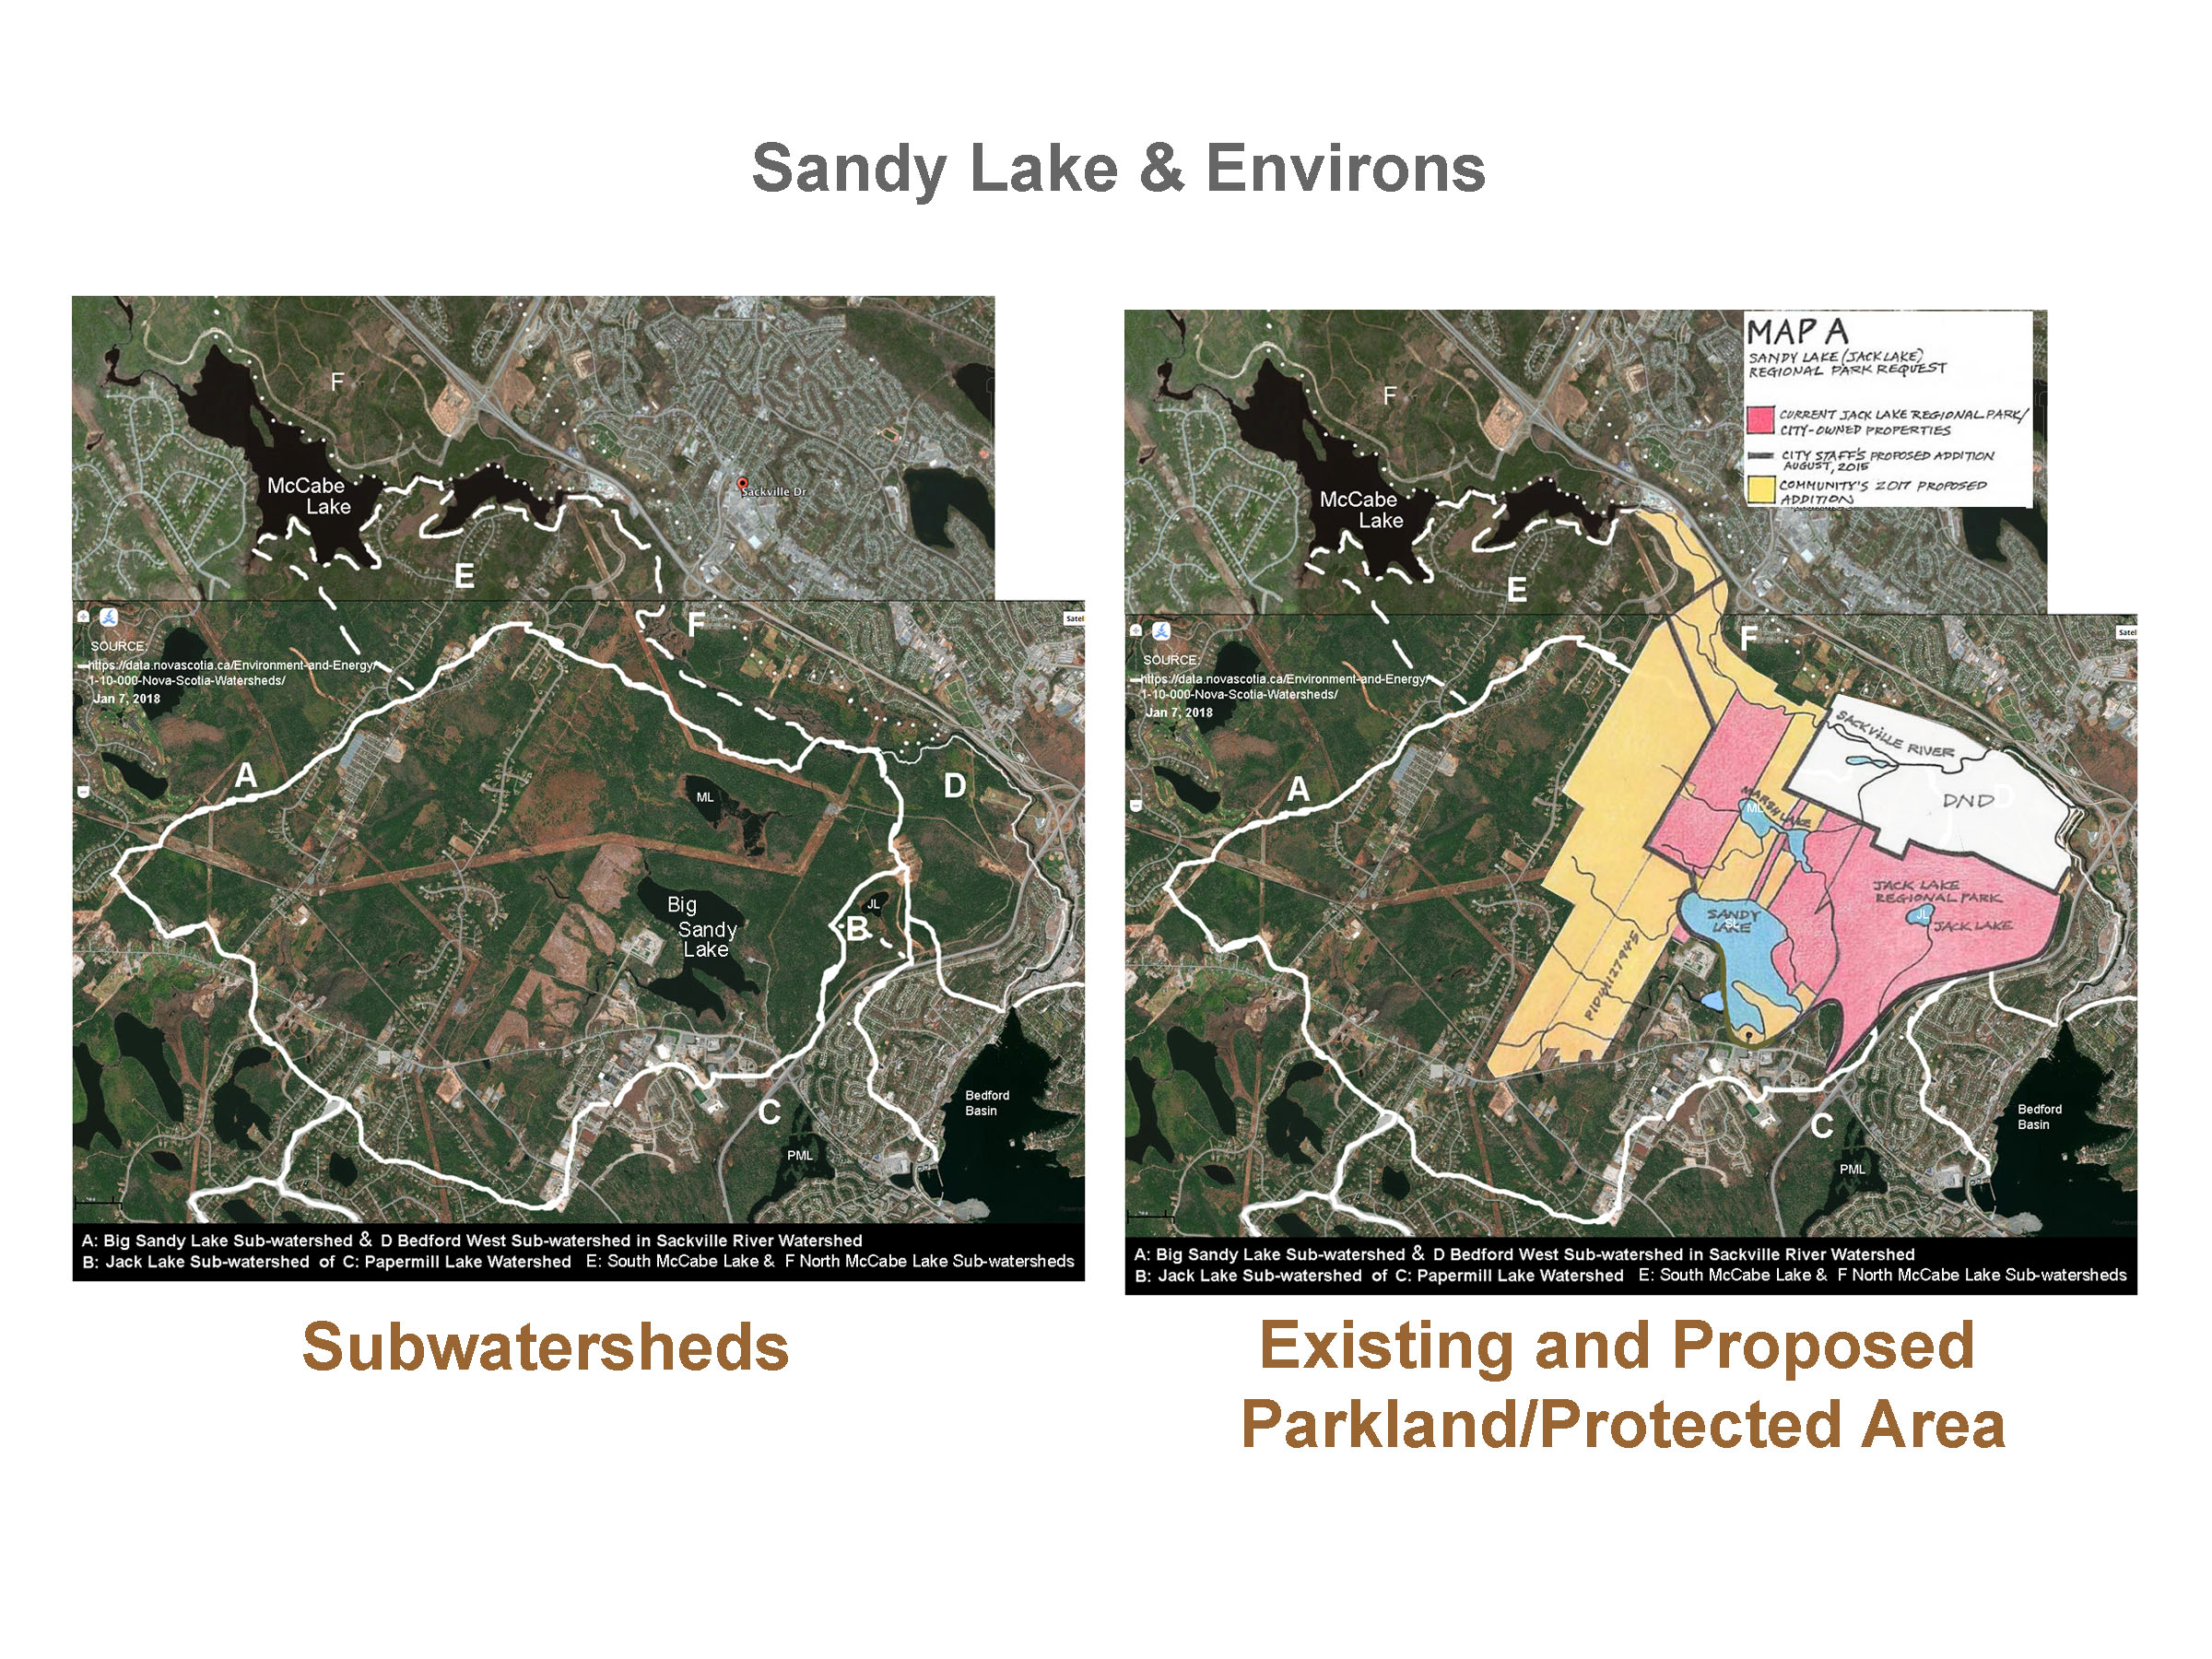
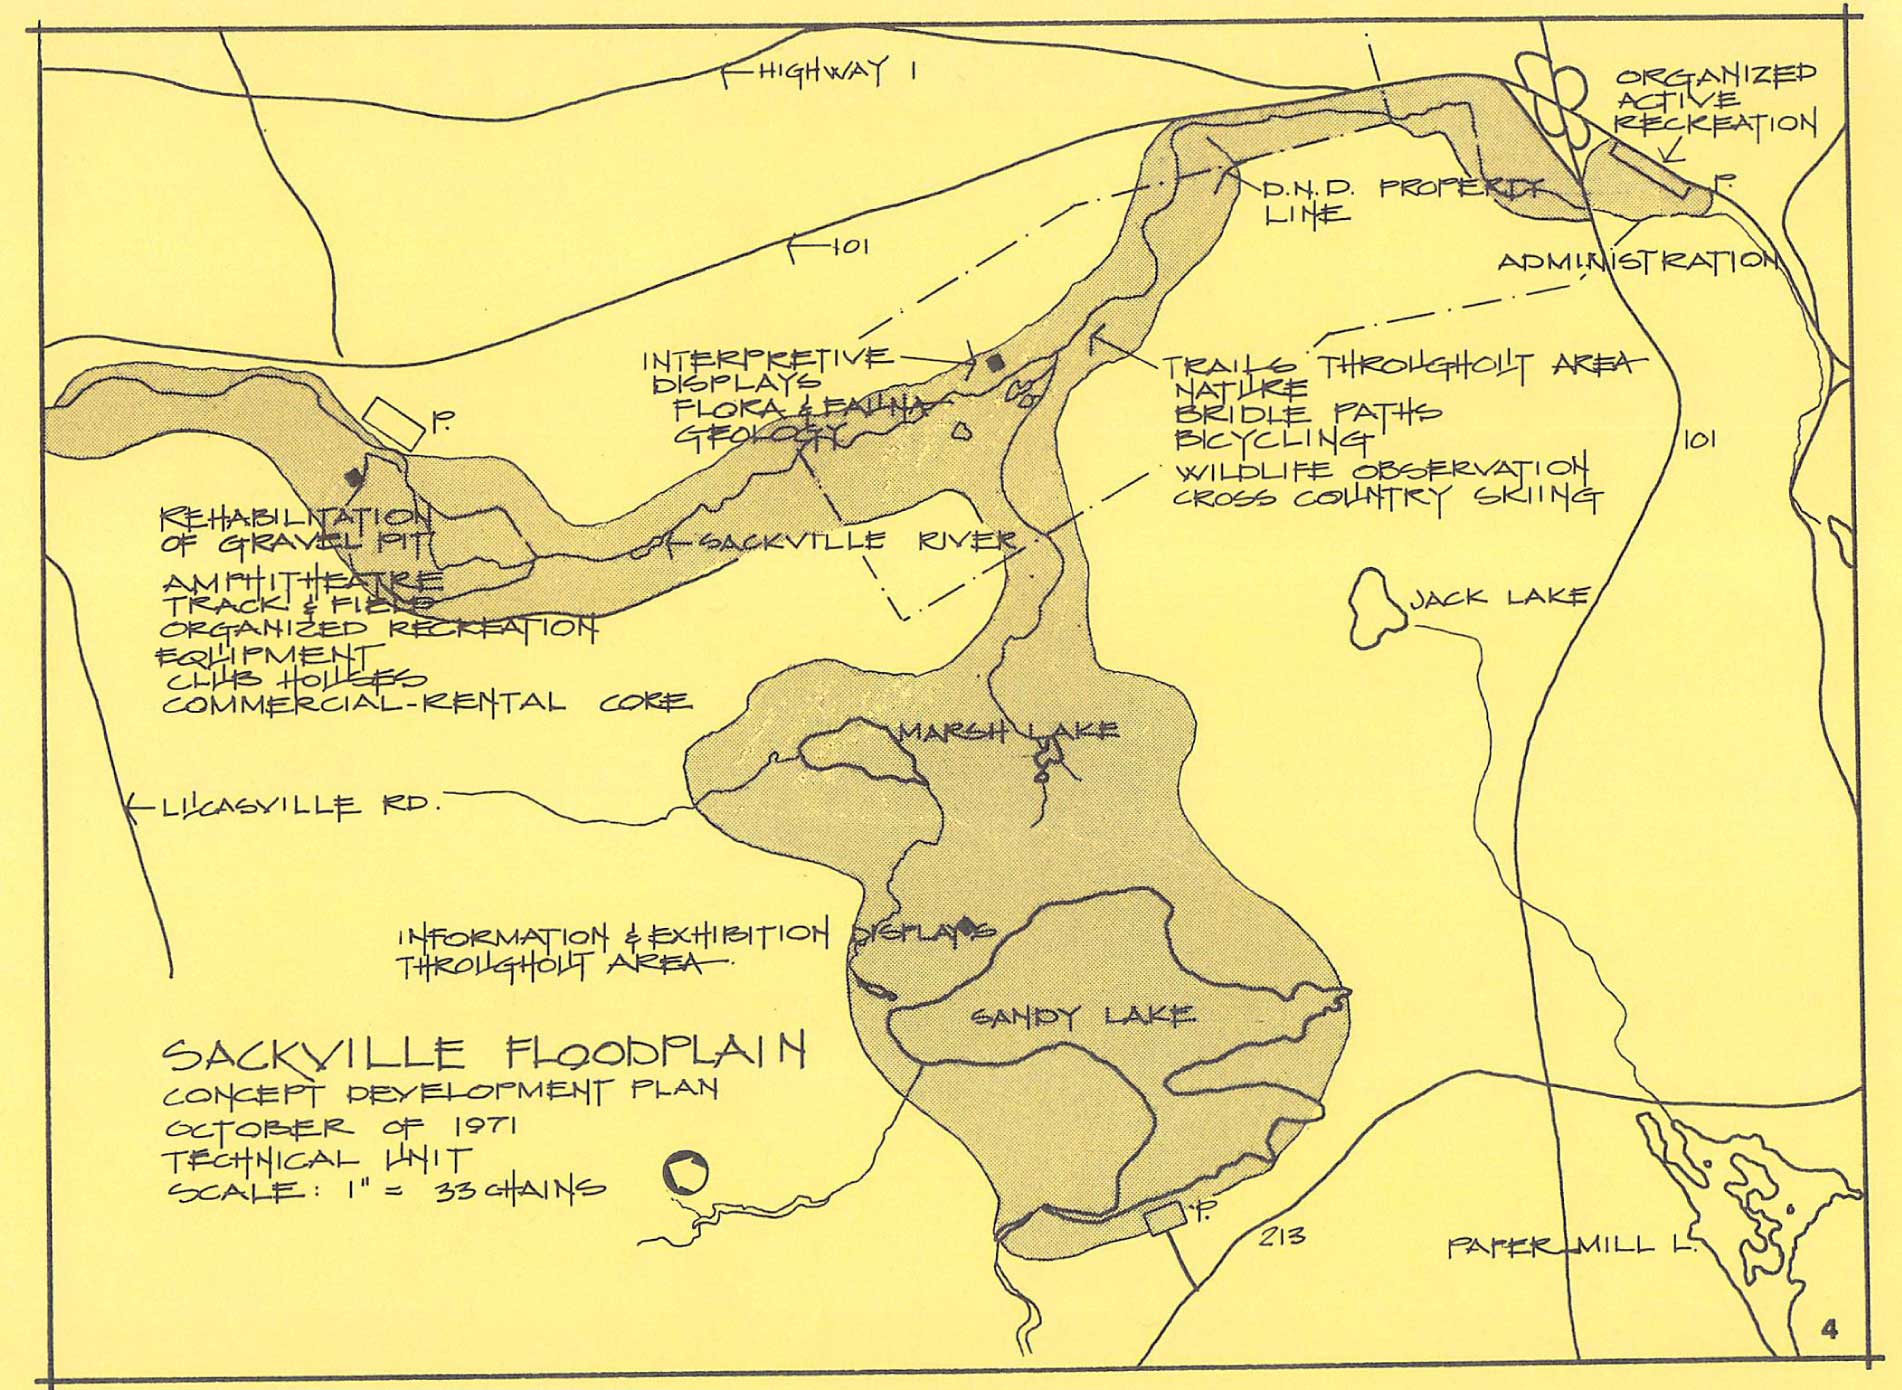
Park Concept
Map A: Sandy Lake (Jack Lake) Regional Park Request
Map extracted from Sandy Lake Conservation Association and Sackville Rivers Association submission to the Halifax Green Network Plan implementation public process (2017 documents on on SLCA website)
This map has been slightly revised and improved (Jan13, 2019).
See Updated Map .

Marsh Lake Lands
Off-site Parkland Dedication Request – Marsh Lake Lands, Bedford, Halifax Regional Council August 4, 2015. View extract from HRM doc
Sackville Flood Plain/Sandy Lake Regional Park Concept Map
MAPC 1971
Lake Bathymmetry
Sandy Lake Bathymetry 1600 | 600
From Paul Mandel, MSc thesis, Dalhousie University, 1994: The effects of land use changes on water quality of urban lakes in the Halifax-Dartmouth region
Marsh Lake Bathymetry: 1200 px | 600 px
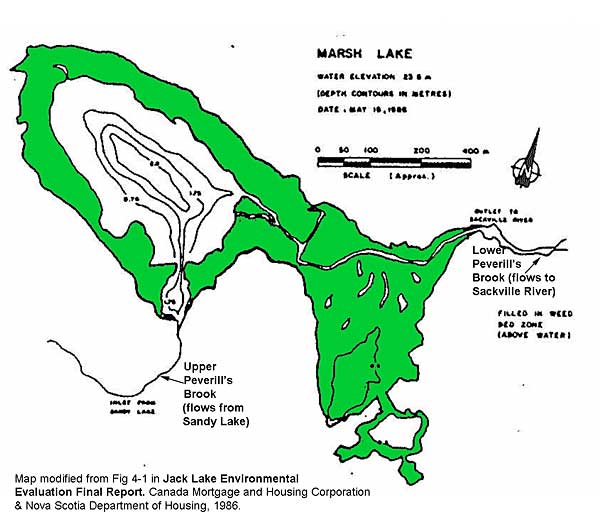
Jack Lake Bathymetry: 1600 px | 600 px
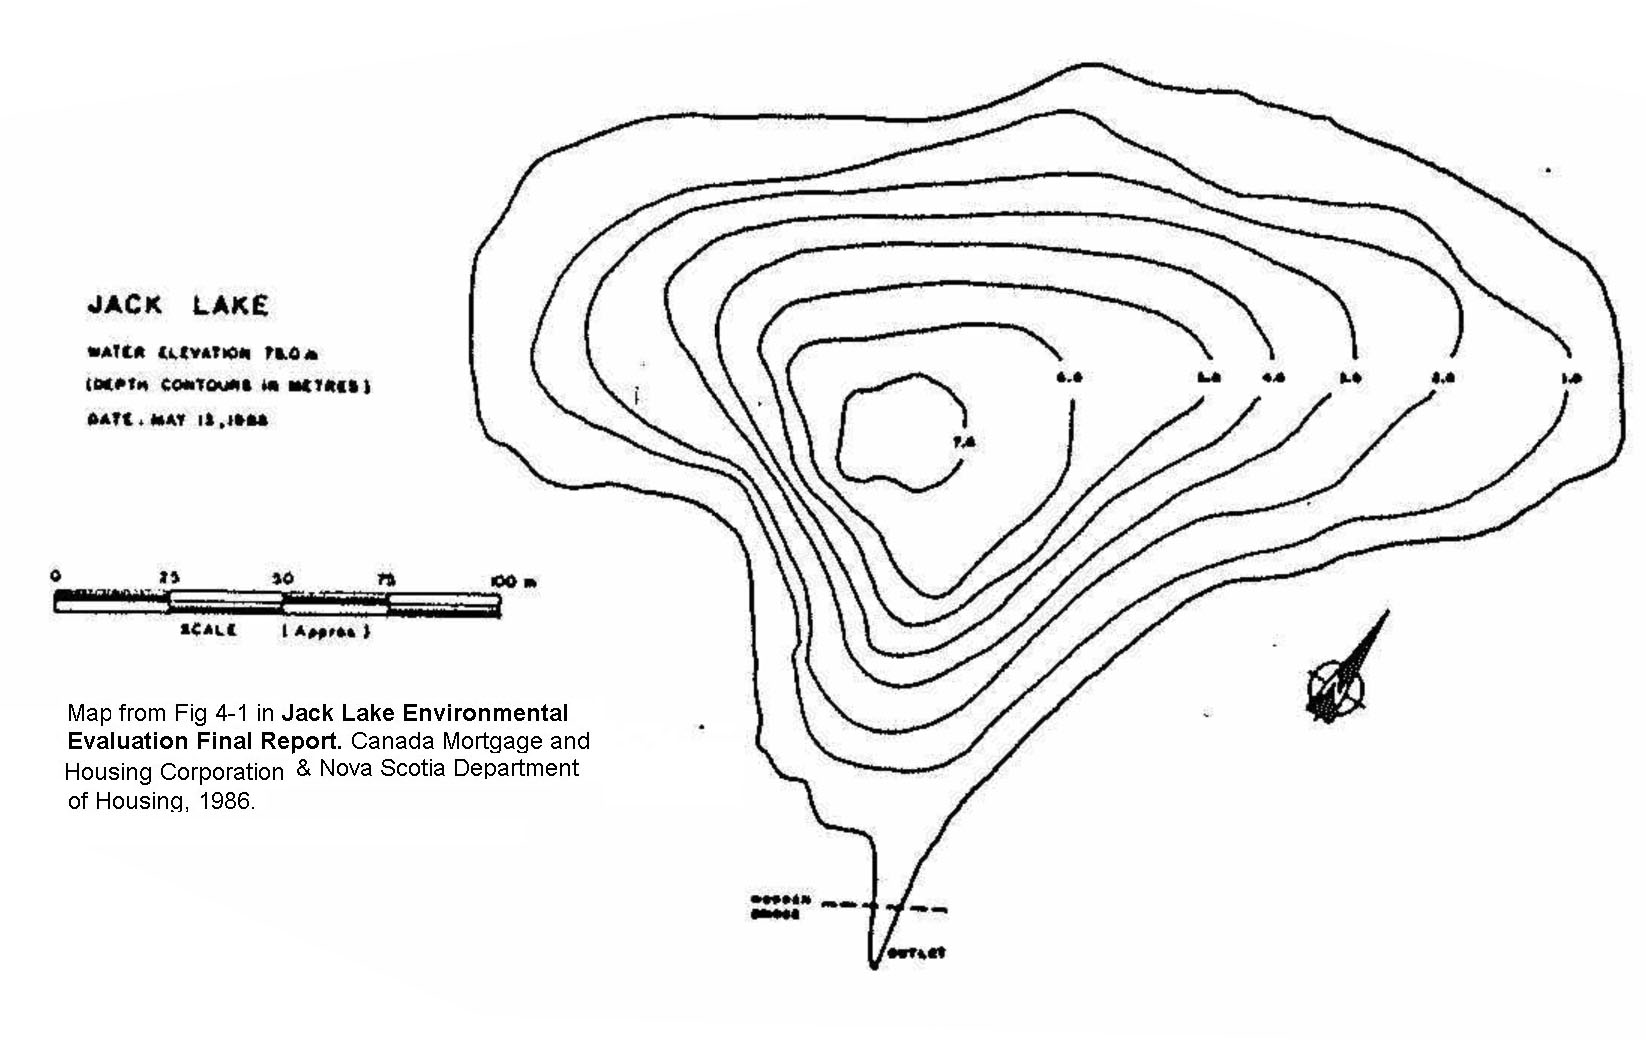
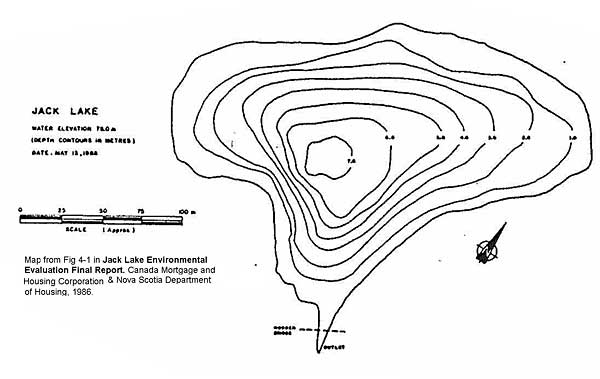
Sandy Lake Bathymetry: Ed Glover Map | Data (.xls)
Units are in meters. Map is TIN interpolated output; raw data in .xls file. Data collected by Ed Glover in 2006
DNR Maps
DNR Landscape Maps
These screen captures from the NS Landscape Maps Viewer show forest development class, species etc. for Sandy Lake and Environs
Sandy Lake and Environs on Crown Land Grant Map,Index Sheet No. 66, Halifax County
Courtesy of Beth McGee. The full index maps are available online
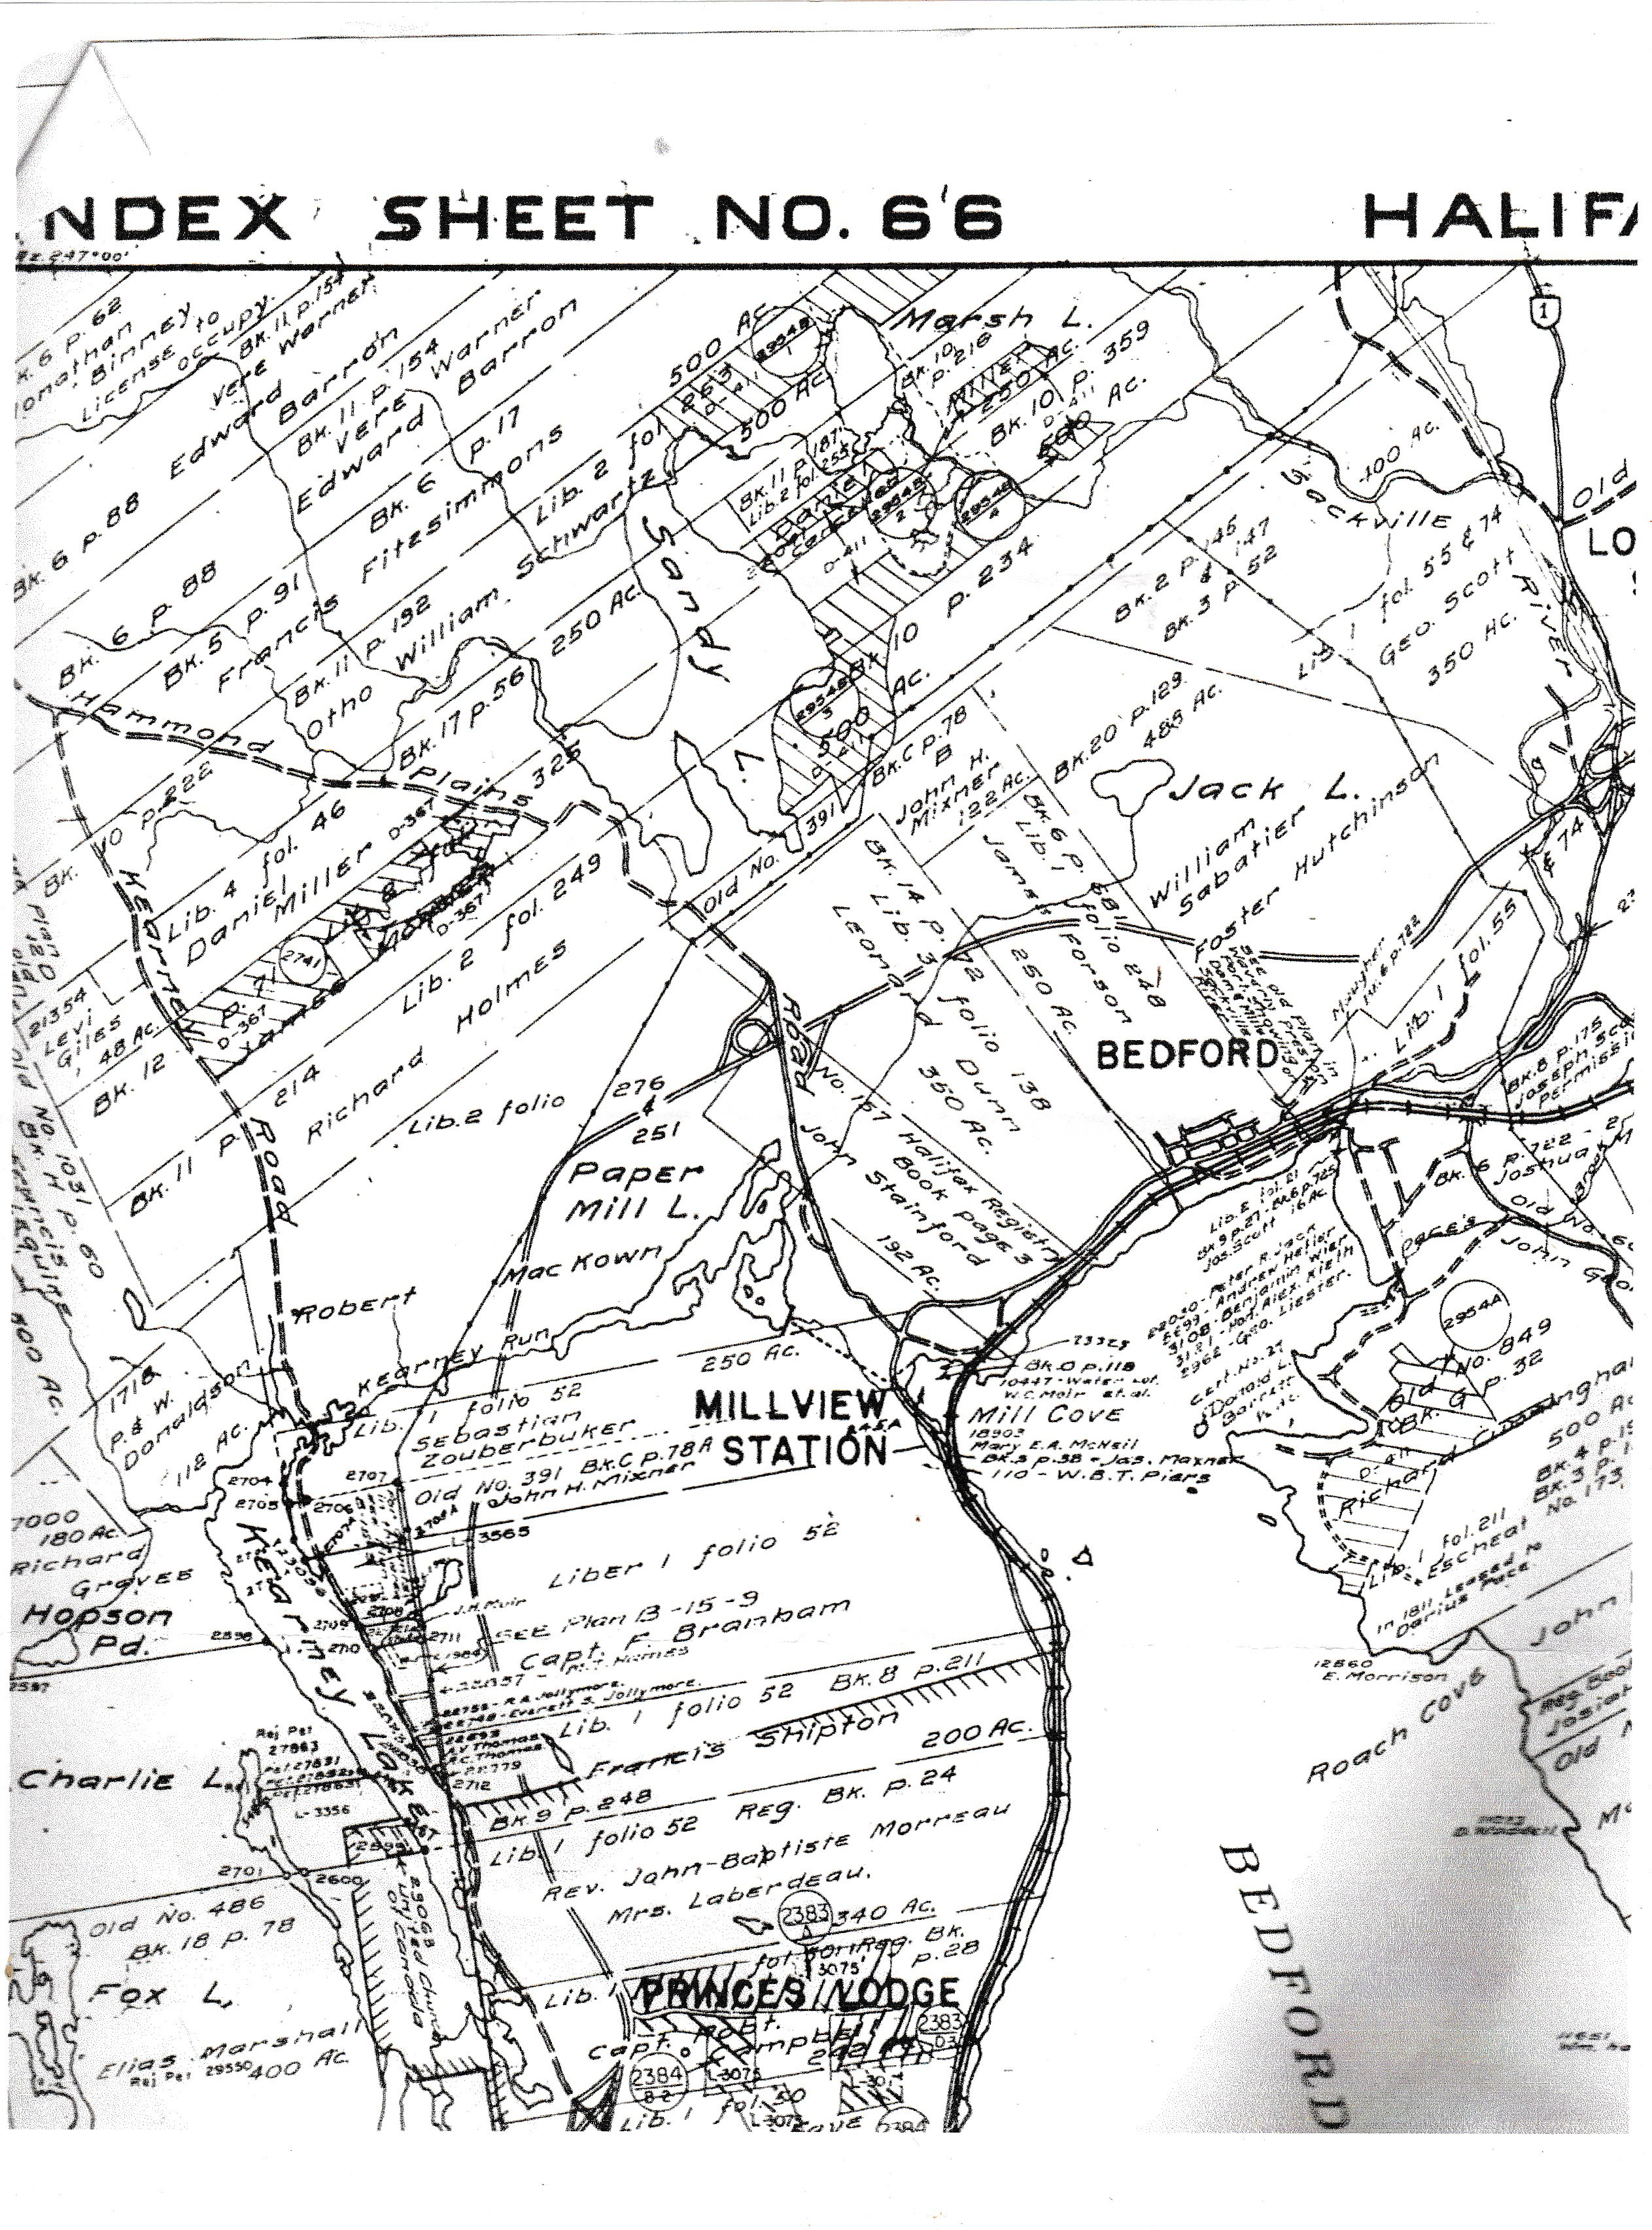
Development & logging
Google Earth Images showing clearcuts by Sandy Lake 2004/5 to 2016/7
Global Forest Watch Maps of Sandy Lake & Environs, Bedford NS
Scree captures from Global Forest Watch Maps showing changes in forest cover in Sandly lake and Environs, 2001-2016.
Development & Logging in a portion of Sandy Lake Watershed 2004-2016
Screen captures from Google Earth Maps
List of Figures
Figure 1. Watershed Boundary and Project Study Area, page 2
Figure 2. Local Communities and Service Areas, page 3
Figure 3. Wetlands and Forest Cover, page 7 7
Figure 4. Bedrock Geology, page 10
Figure 5. Surficial Geology, page 11
Figure 6. Groundwater Recharge in the Sandy Lake Watershed, page 12
Figure 7. Constraints page 19
Figure 8. Sandy Lake Total Phosphorus – Current Conditions
Figure 12. Scenario 1 – Existing Land Use Conditions, page 35
Figure 13. Scenario 2 – Future Land Use Conditions, page 36
Figure 14. Scenario 3 – Future Land Use Conditions with Removal of Septic Systems near Sandy Lake and Removal of Uplands WWTF, page 37
Figure 15. Scenario 4 – Future Land Use Conditions Scenario 3 with Advanced Stormwater Management, page 38