—————————————————
In an effort to identify the major sources of high EC (high salt) water entering Sandy Lake via the SW Inlet, on Nov 8, 2018 I took water samples from streams flowing into Murphy’s Pit (Sites 1,2, and 3-4) and from Murphy’s Pit water just north of the service road (Sites 5,6) – the streams converge upstream from the Service Road), also just below the culvert where the water enters Sandy Lake Site 7); and for reference I took a sample of lake water by Sandy Lake Beach Park (Site 8), and from a stream flowing into Sandy Lake by Sandy Lake Beach Park (Site 9). They were analyzed on-site using pocket probes.
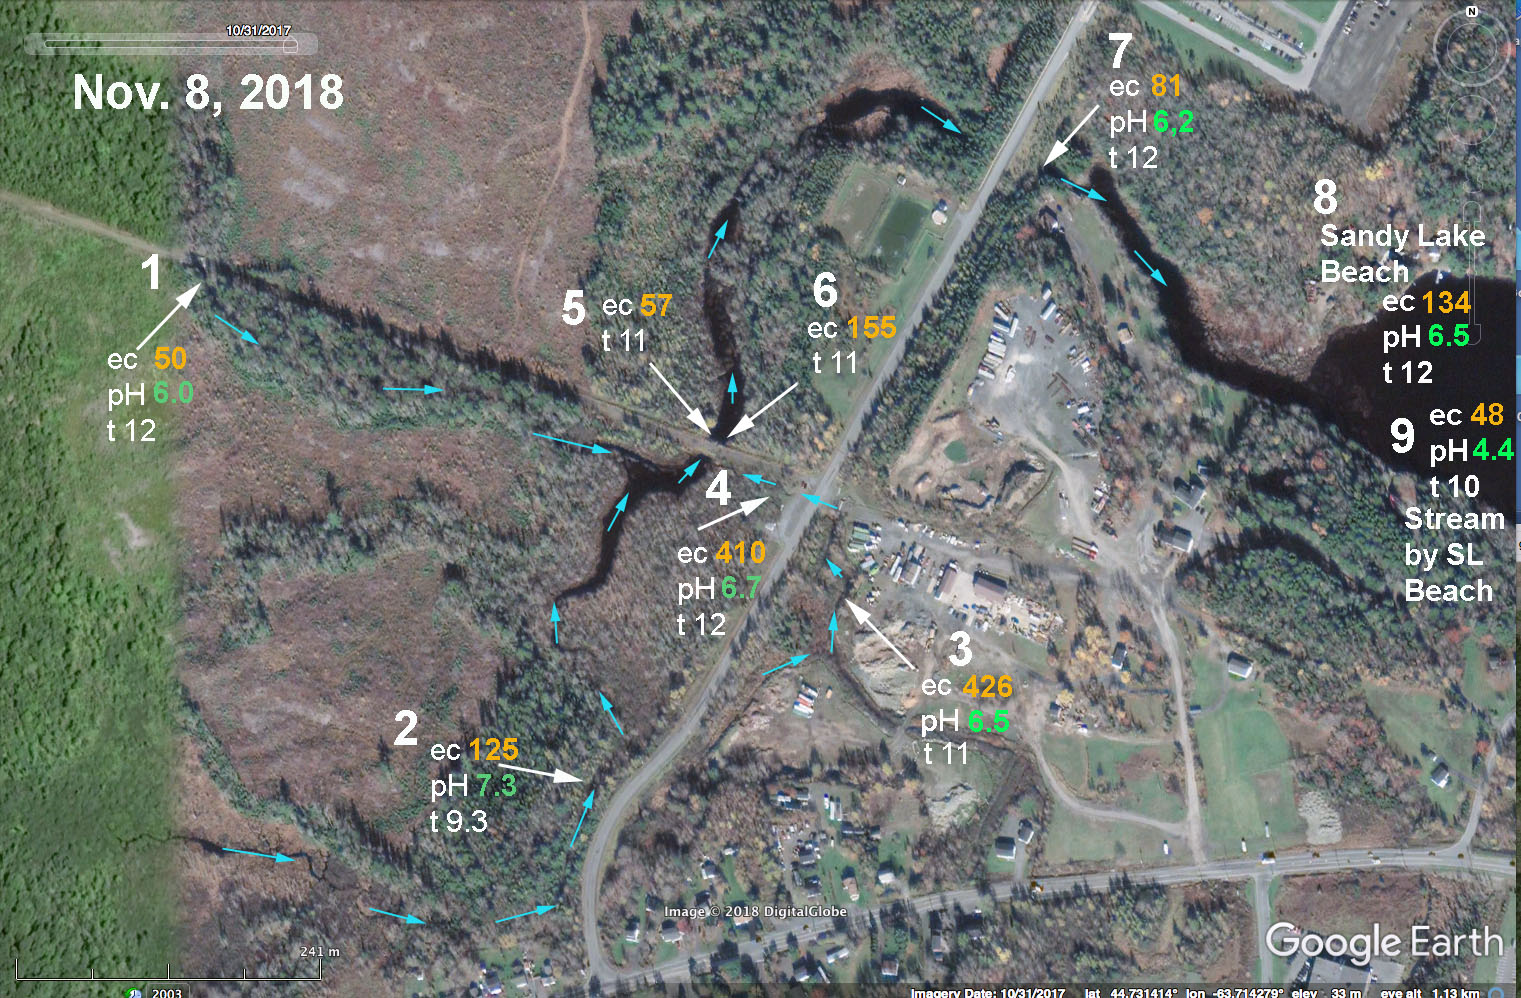
Above: EC and pH values for streams associated with Johnson’s (Bob’s) Brook on Nov 8, 2018. #1 Upper Johnson’s Brook. #2 Brook receiving drainage from Uplands Park wastewater treatment area, also from streams south of Hammonds Plains Road. #3 and # 4: Brook draining construction/trucking yard and community just to the SE of the Dairy Road. These 3 system converge in the area of sites 5& 6 and then water flows downstream to enter Sandy Lake through two large culverts at site #7. Nos 8 and 9 were taken at Sandy Lake Beach Park for reference. There were strong flows in the brooks at sites 1 and 2. A steady but weaker flow was observed at site 3-4 (it crosses the road from 3 to 4 through a culvert and that water was very cloudy and had a lot of suspended material.
The EC value at the 2 culverts where the Johnson’s Brook system enter Sandy Lake was 81 uS/cm, much lower than the 200 uS/cm observed June 21, 2017, and reflects the high rainfall in the preceding month or so; likewise, the EC value at Sandy Lake Beach Park was 134 uS/cm on Nov 8, 2018, compared to 163 uS/c, on Sep 8, 2017.
Three streams converge at “Murphy’s Pit” (see Map page 3 in Thompson 2001). I estimated the volume of flow in Upper Johnson’s Brook (#1 in map above) to be 3 x that in the stream draining the Uplands Park wastewater treatment area/watershed south of Hammonds Plians Road, and at least 30 times that draining the construction/trucking yard and community just to the SE of the Dairy Road. Upper Johnson’s Brook had a very low EC value, while those of the other two brooks were elevated (125 uS/cm for #2, 410 uS.cm for #3/4); those streams are major sources of pollutants going into Sandy Lake.
The sites above should be sampled in the winter when salt is being applied to roads.
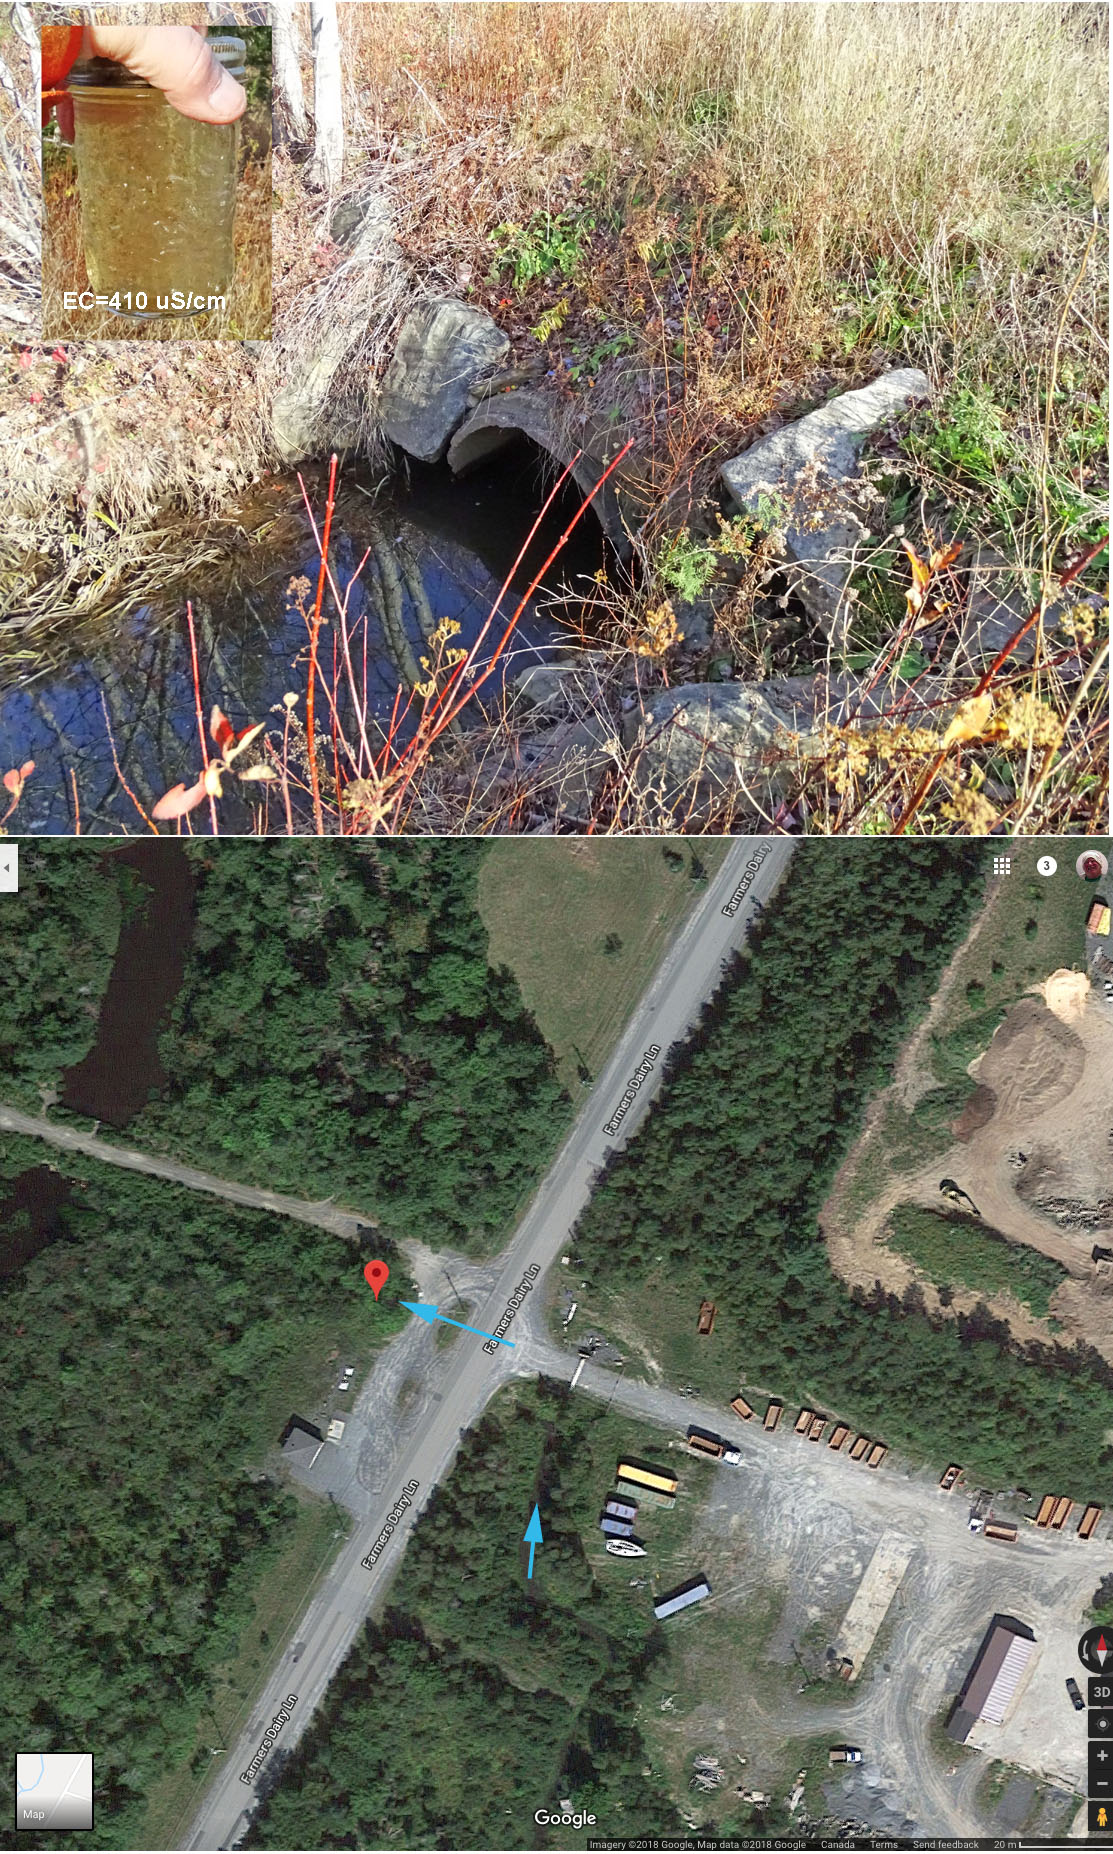 Also, the quality of water entering at site 4 (on Nov 8 with high electrical conductivity and very cloudy and full of particulate materials) should be further investigated. Is the cloudy water just temporary? What are the nutrient and bacteria levels? How does the flow rate change with seasons and relative to other flows into “Murphy’s Pit” and then into Sandy Lake, i.e. is it a significant source of pollutants for Sandy Lake?
View related photos: Sandy Lake: stream EC etc Nov 8, 2018
I repeated the set of observations described above on Dec 13, 2018:
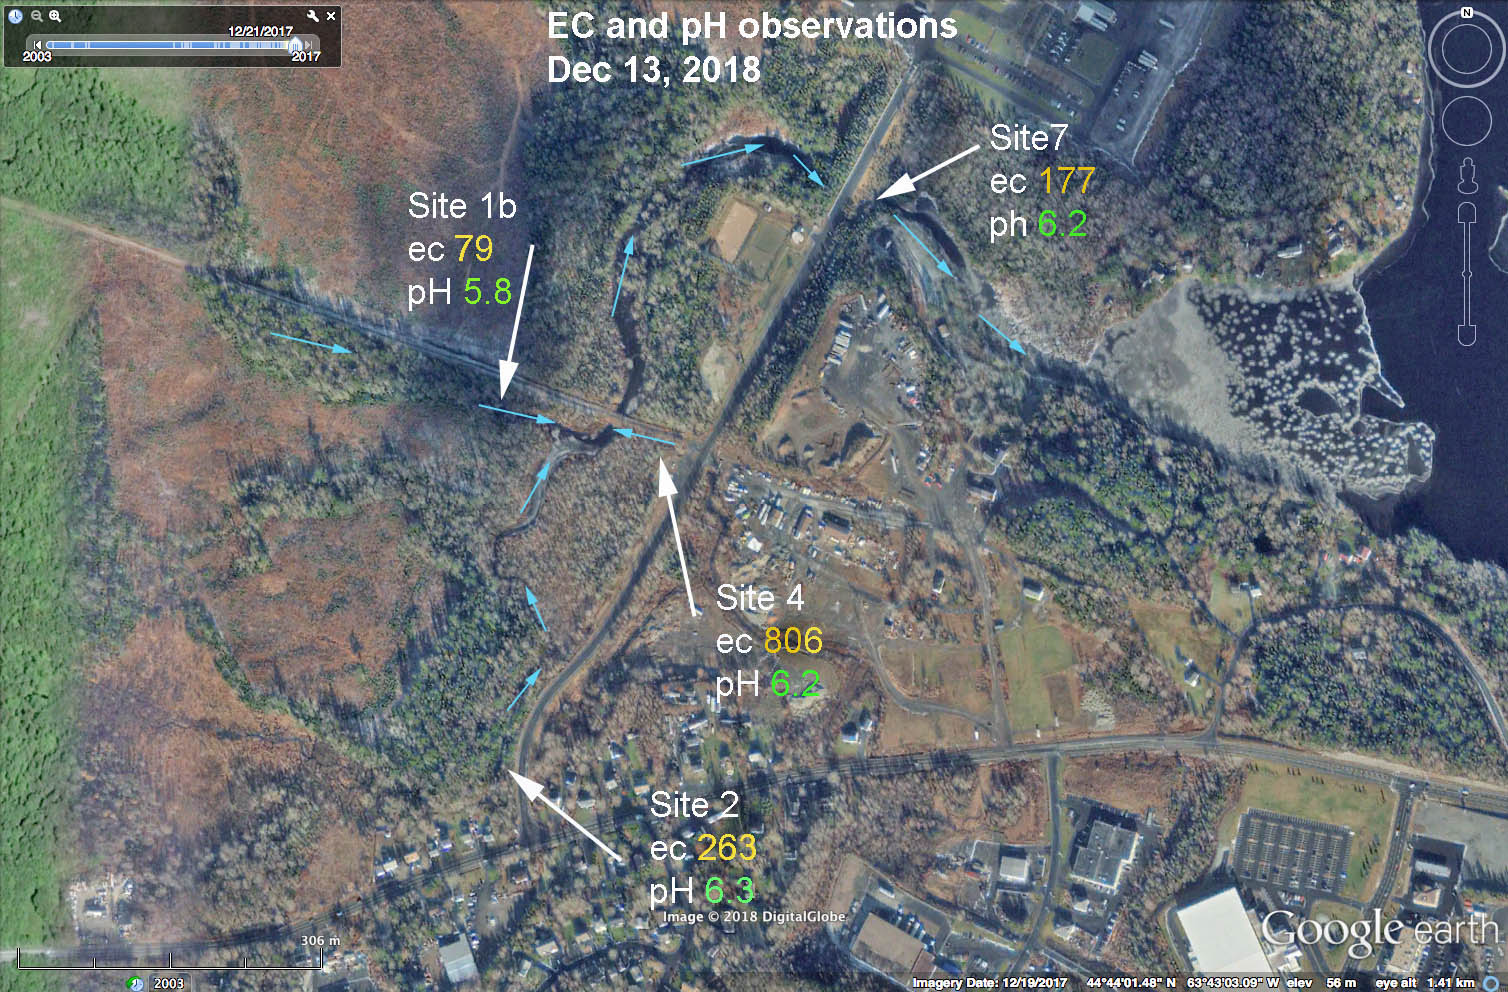
EC and pH values for streams associated with Johnson’s (Bob’s) Brook on Dec 13, 2018. EC (electrical conductivity) and pH values of samples are the values after samples had warmed to room temperature (18.5 deg C)
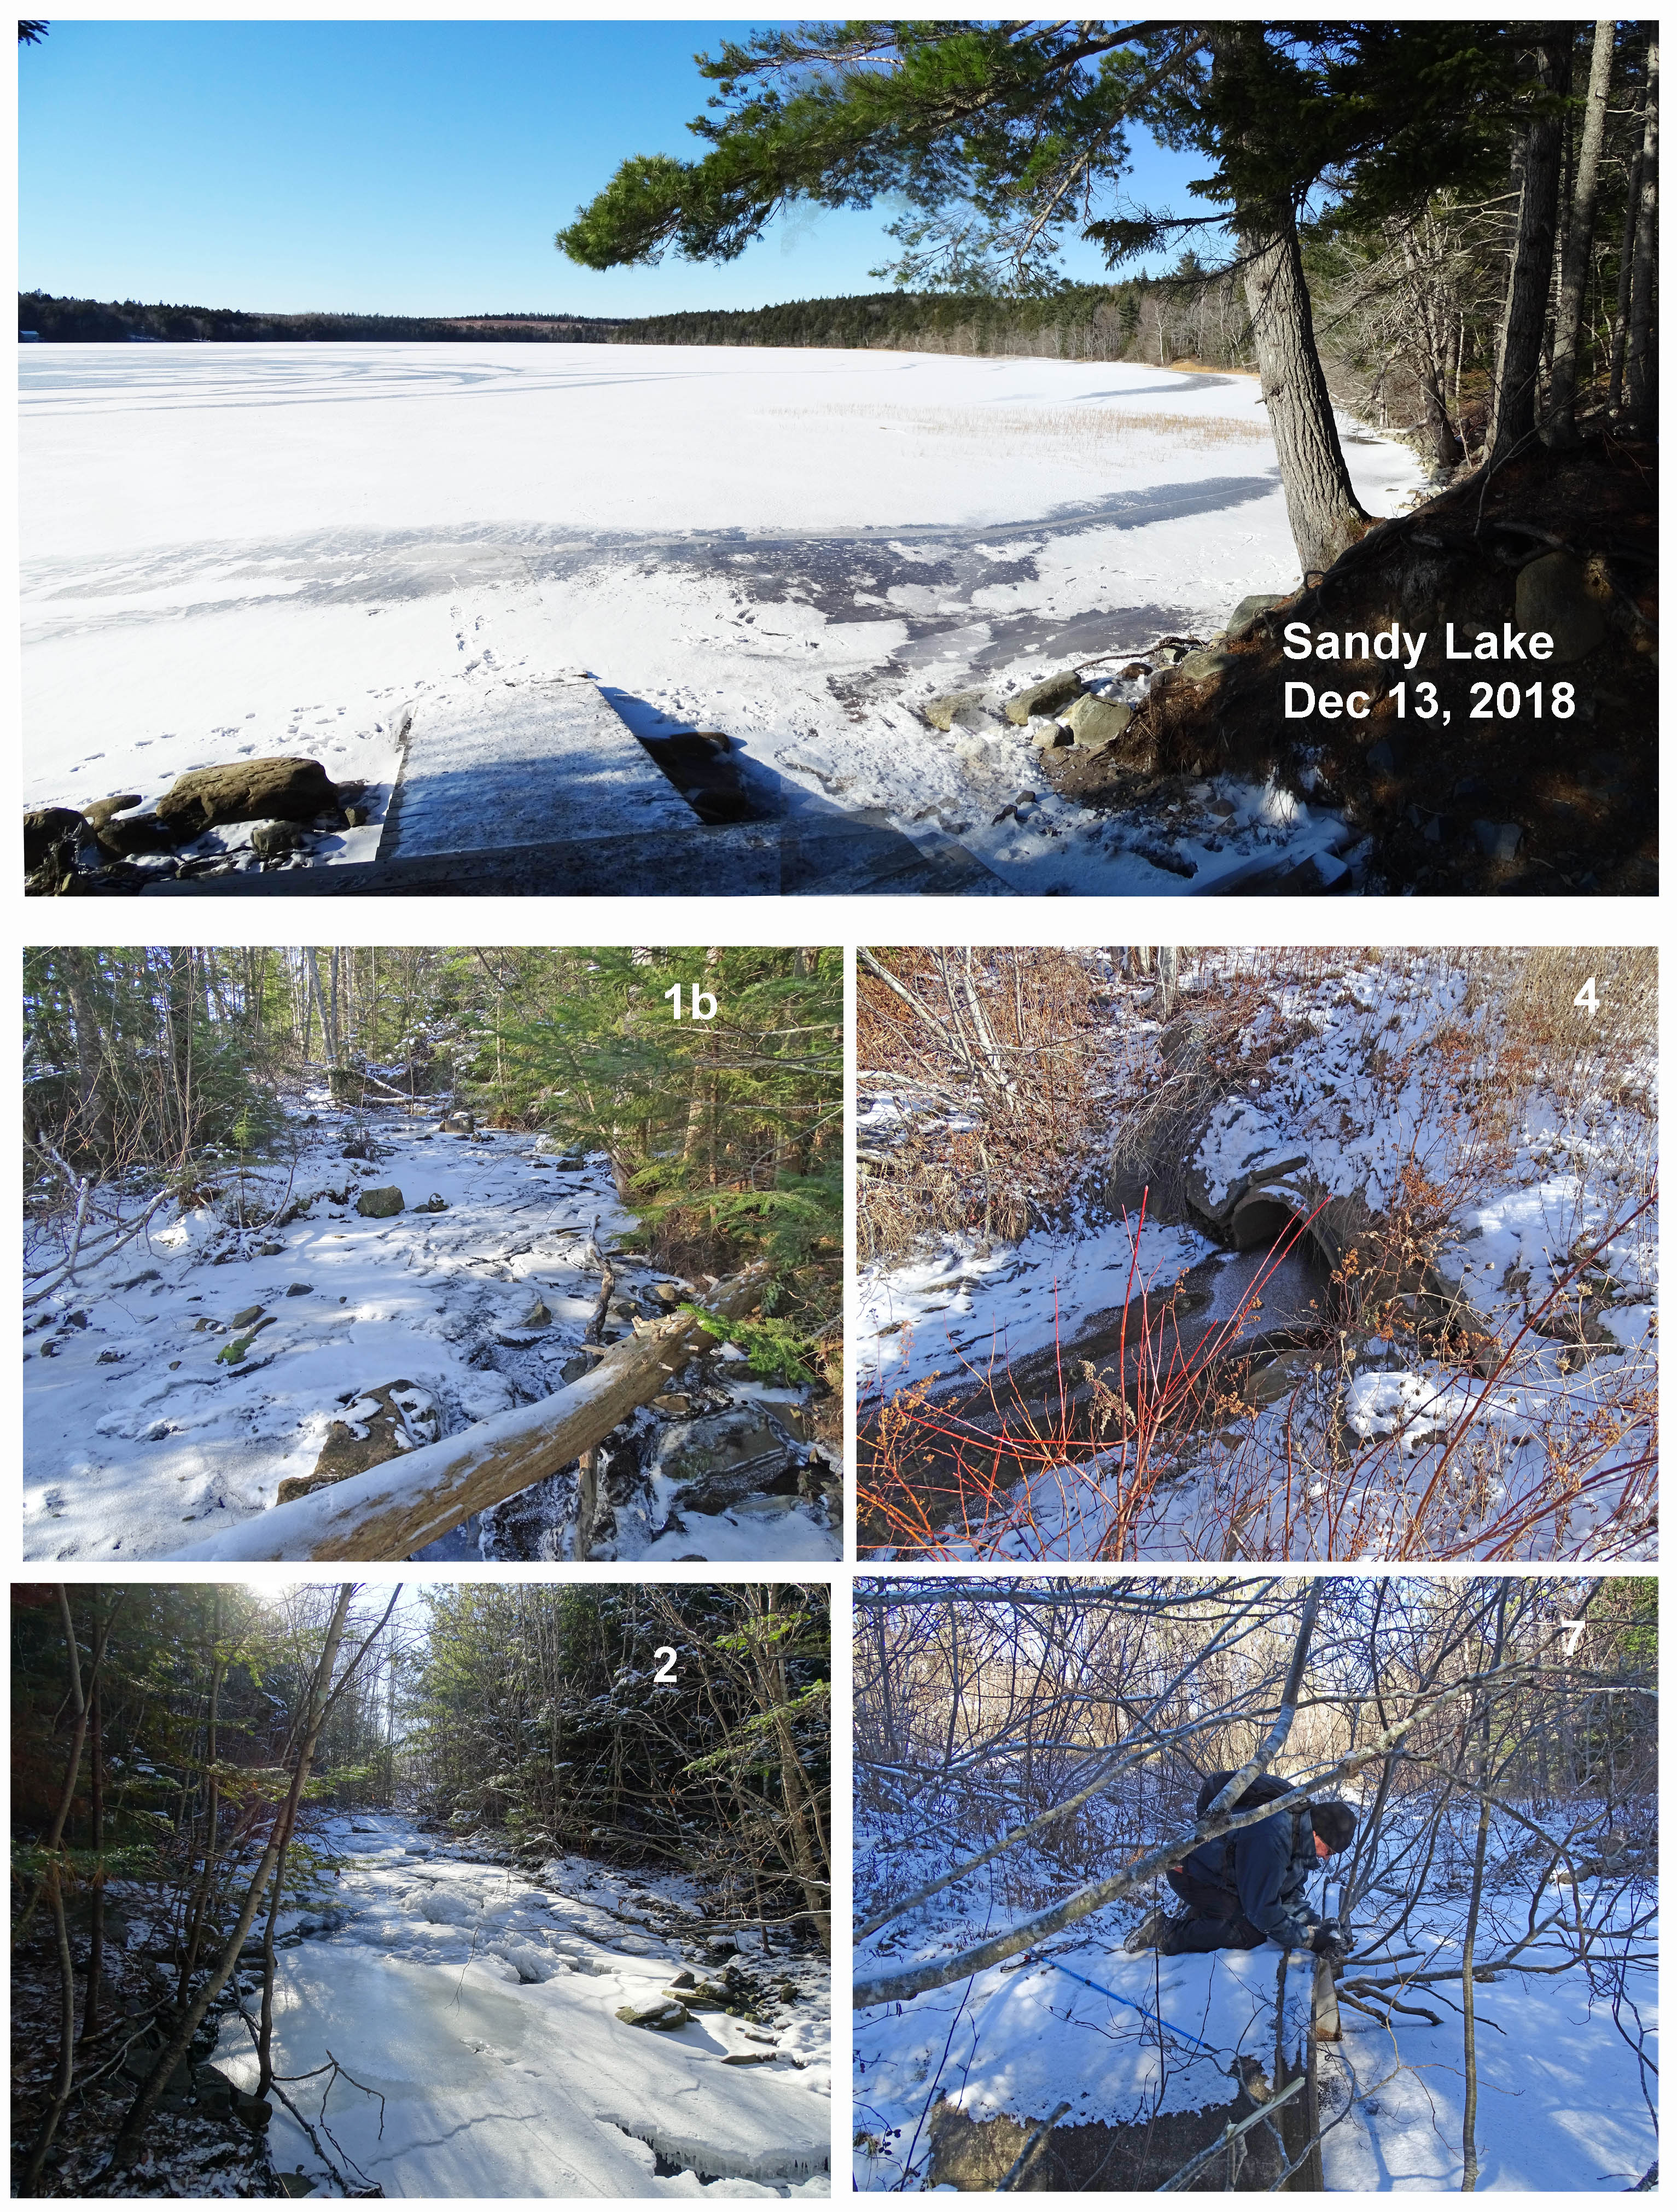
Sandy Lake and streams in Dec 13, 2018
Click on image for larger version
Between Nov 8 and Dec 13, electrical conductivity values increased in each of the three streams that converge before the water enters Sandy Lake, values for two of the three streams approximately doubling, and the other increasing by about 50%. EC values for the two dates are highlighted in red in the table below. The increase can be attributed to the initiation of road salting between those two dates as the cold weather set in. So the increase can be described as a “salting signal”.
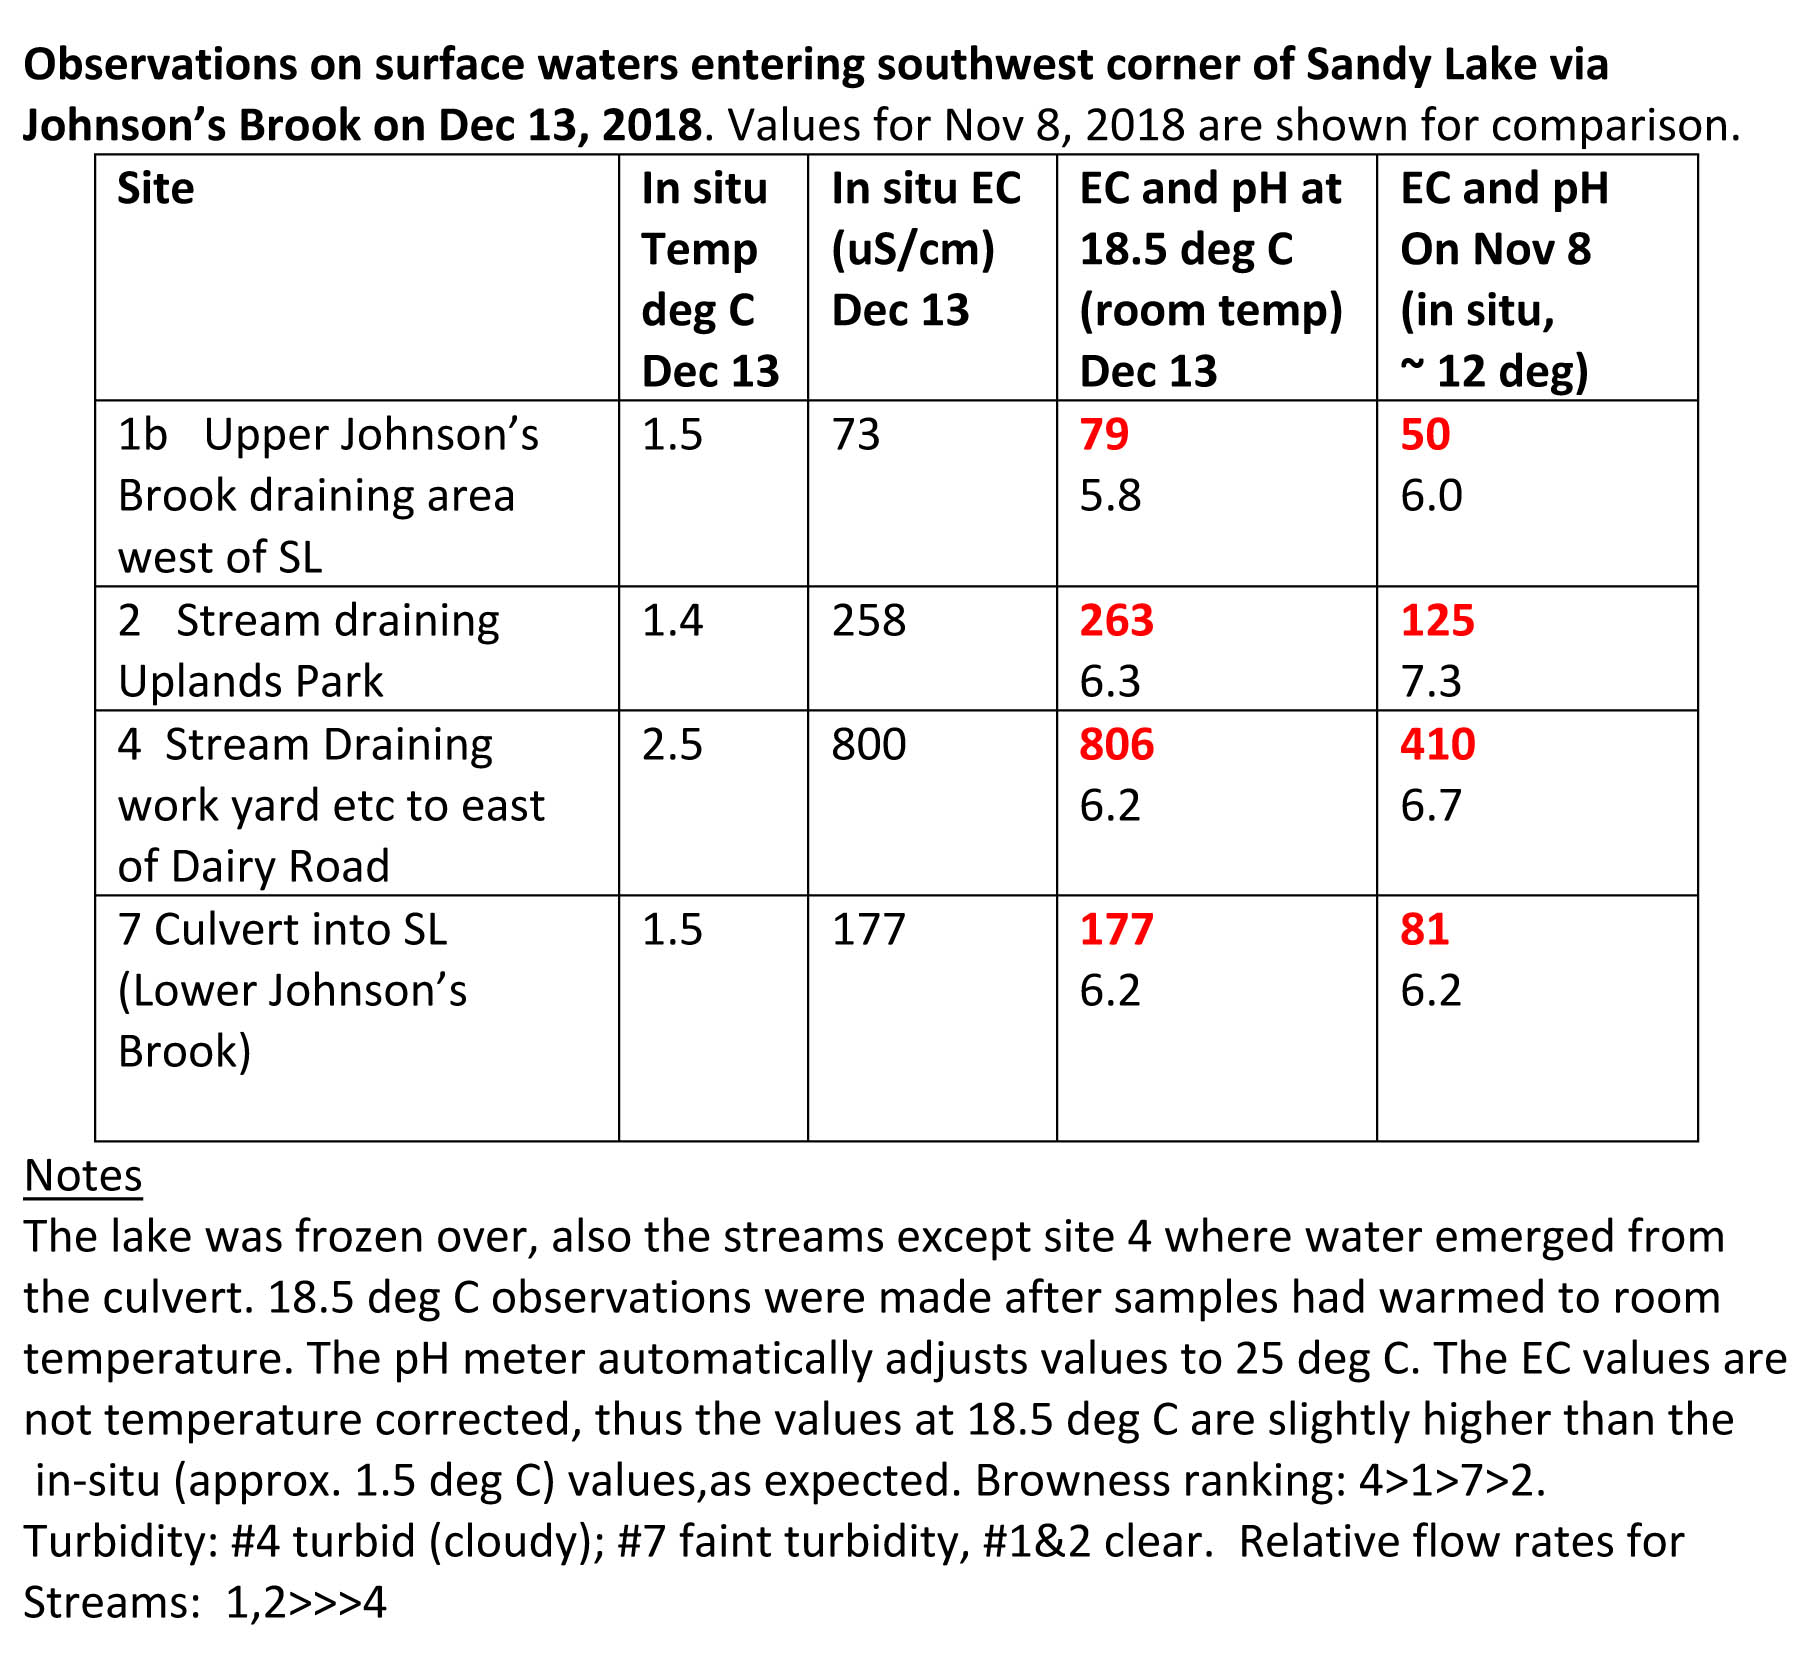 The flows on Dec 13 were definitely lower than on Nov 8, I would guess by a factor of 2 to 3, which is due to freezing of the ground and precipitation falling as snow rather than rain.
Peak salt input to the lake could probably be expected to occur when temperature starts to rise in the spring, the lake to melt and the surrounding lands to thaw, especially if there has been a lot of salting over the winter. It’s then that the incoming water could get very briny (e.g. EC 1000 uS/cm and above), and move in a layer to the bottom of the lake.
Water Colour
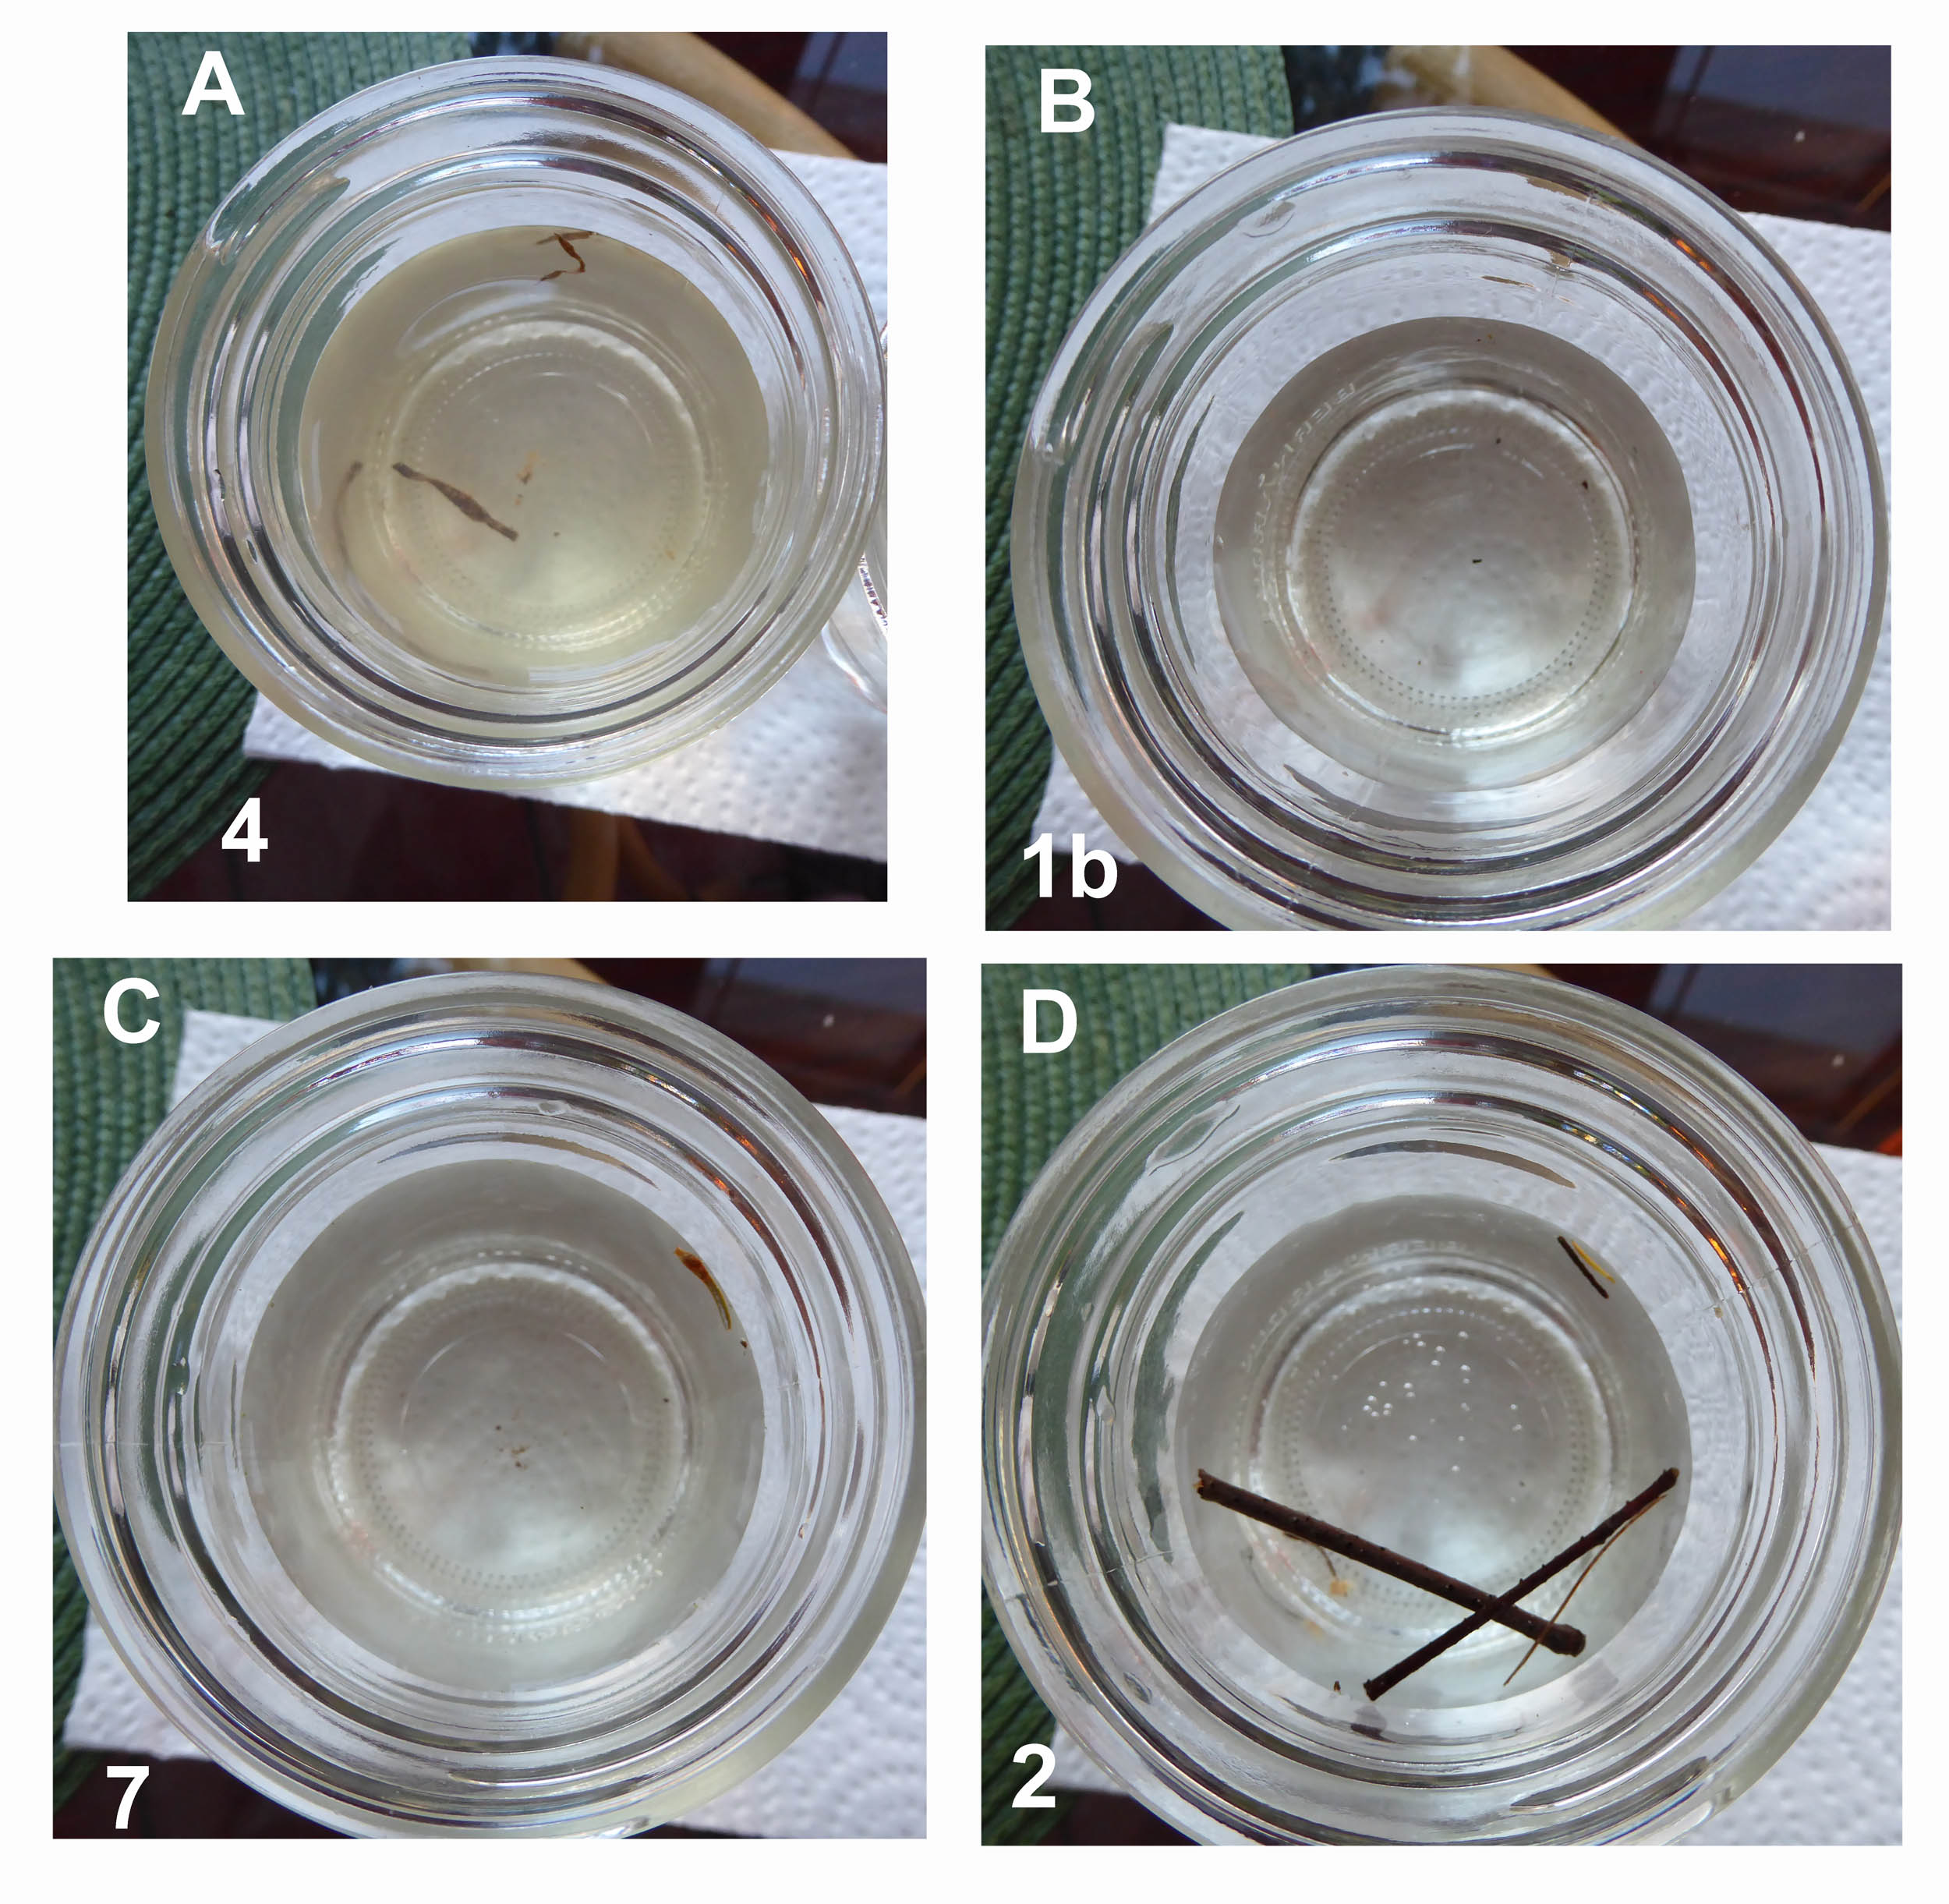
Water samples Dec 13, 2018. The “brownness” decreases in the order A, B, C, D. Numbers refer to the sites (see map above)
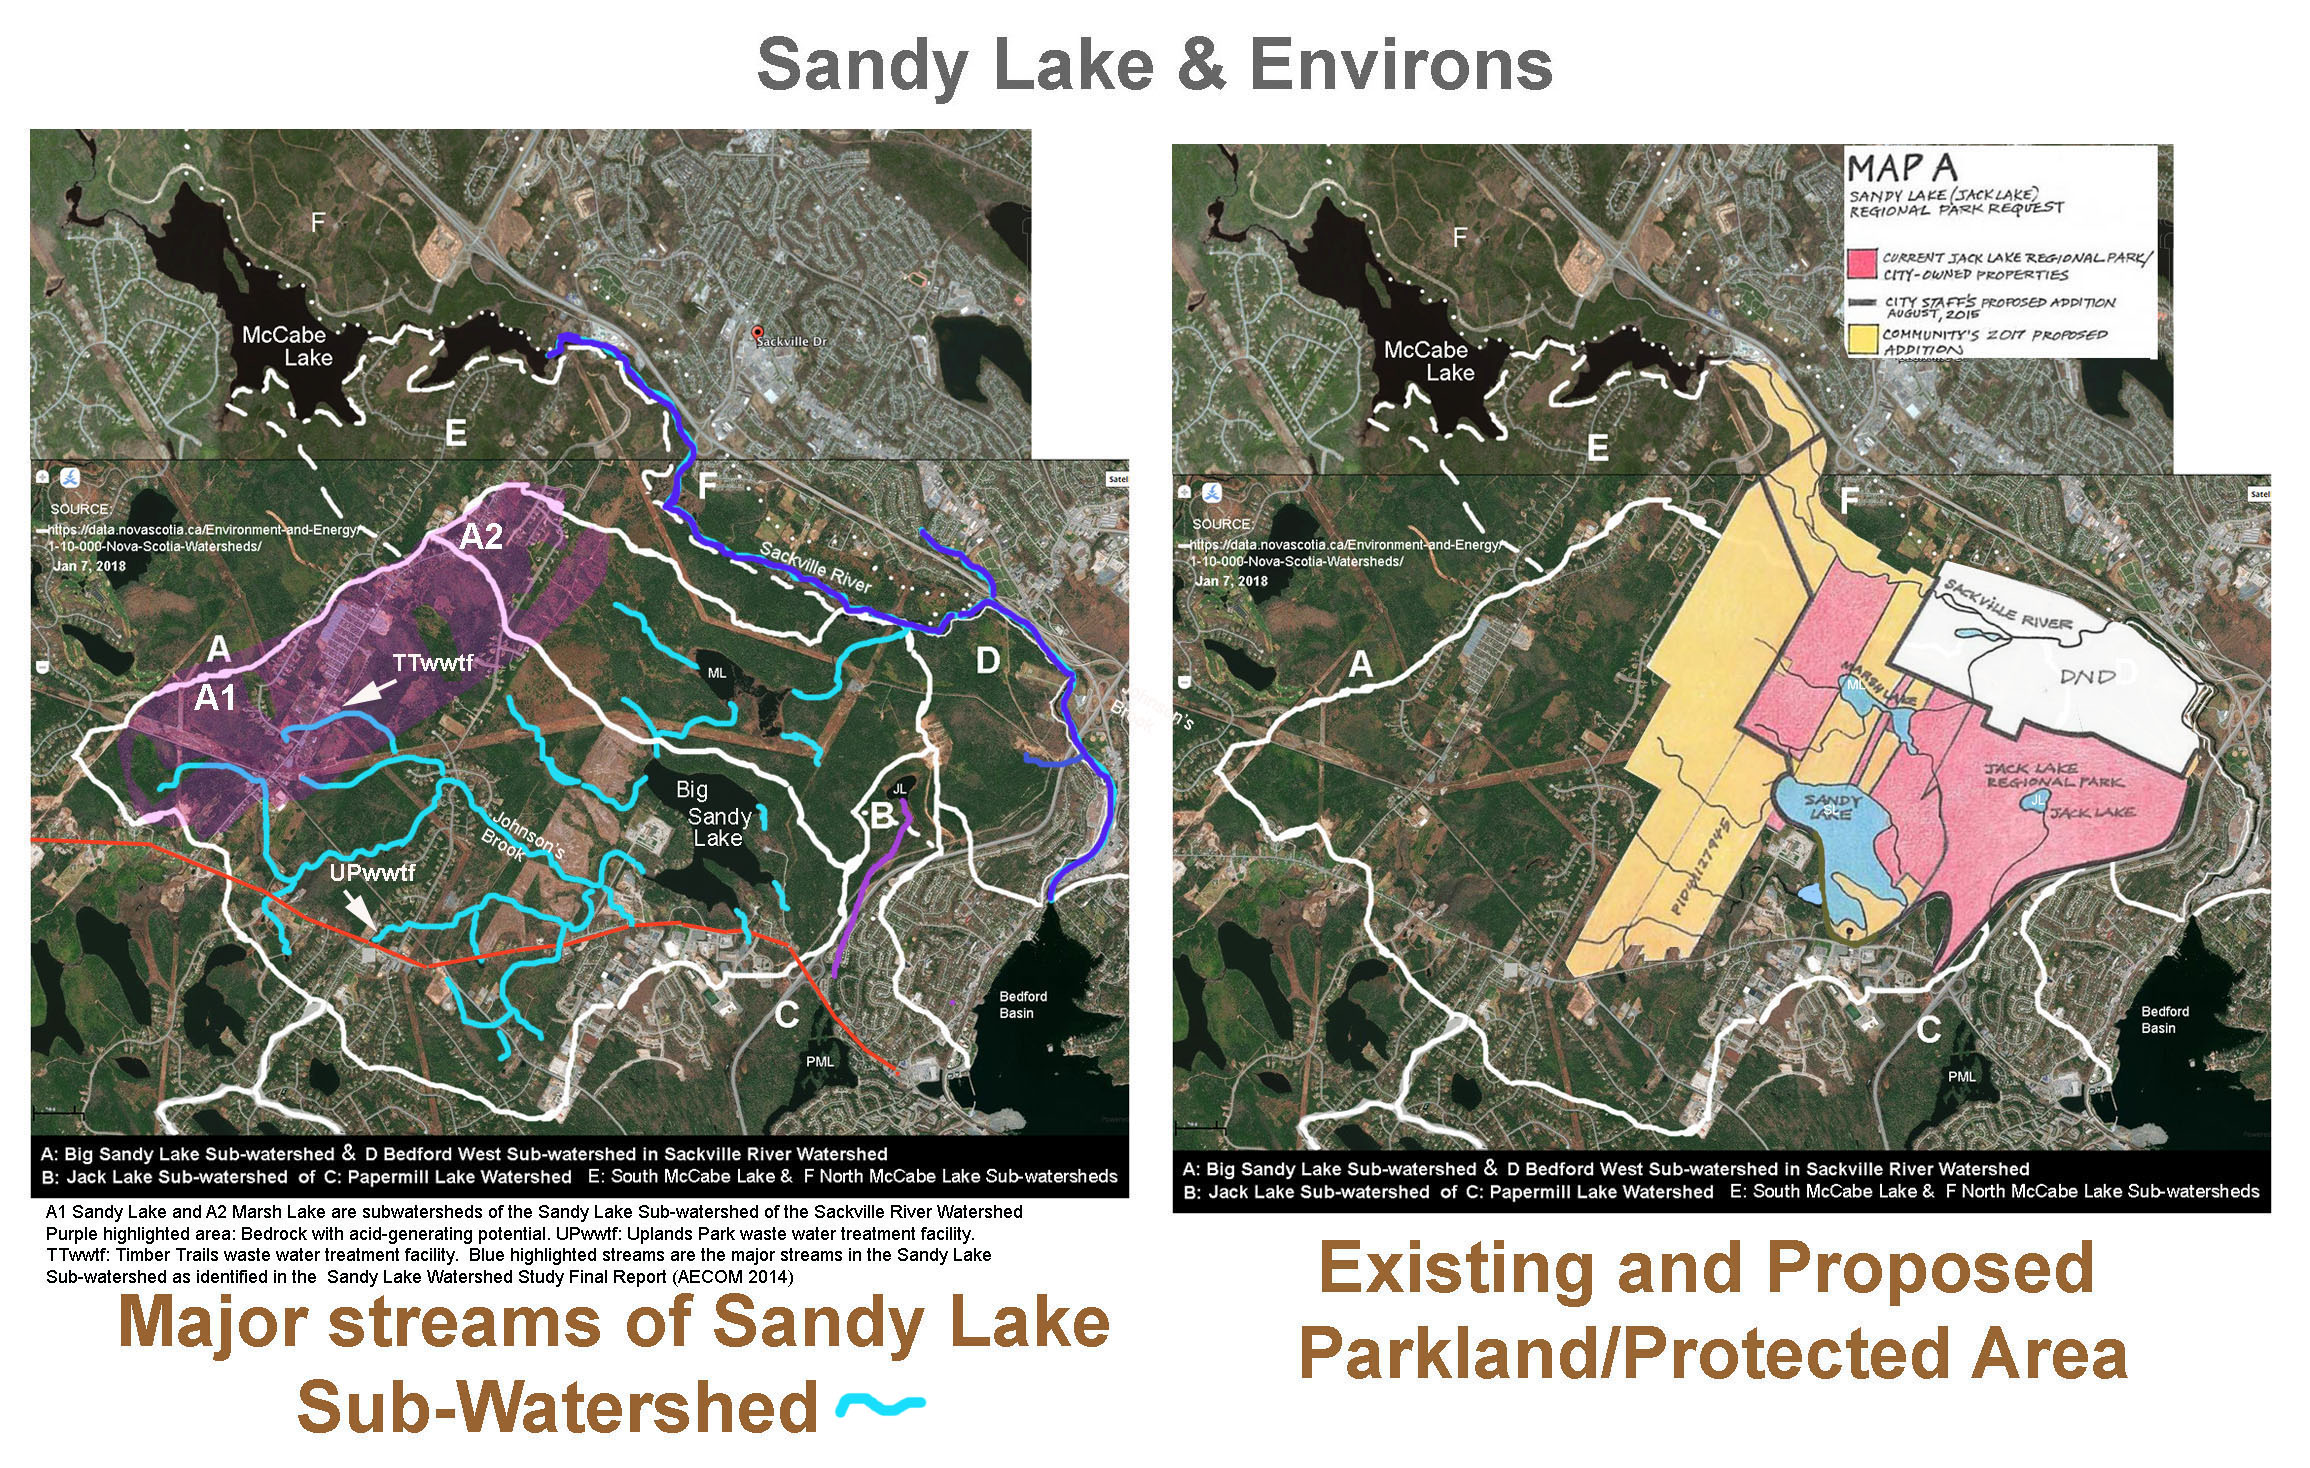
The maps below are for reference.