
NAVIGATION
This page is a sub-page of ObsBath, a top-level page on
the website Barbados Fringing Reefs and Seagrass Beds
(www.versicolor.ca/barbados).
Go to ObsBath for a list of other subpages in this section
of the website.
Source: Mostly to-date unpublished observations on Barbados seagrass beds by D. Patriquin in 1968/9; and by D. Patriquin with collaboration of R. Scheibling, L. Vermeer in 1994; and draft manuscripts by D. Patriquin. View ObsSG for details.
The extent, topography, and distribution of different bottom types and seagrass species at Bath were mapped in detail using aerial photographs (Hunting Surveys Ltd., taken in 1964) and ground truthing. The latter was conducted by measuring depths, and observing bottom types, seagrass species, and at other variables as indicated in the results, along transects traversing the beds from a shore position to the seaward margin of the seagrass beds or beyond.
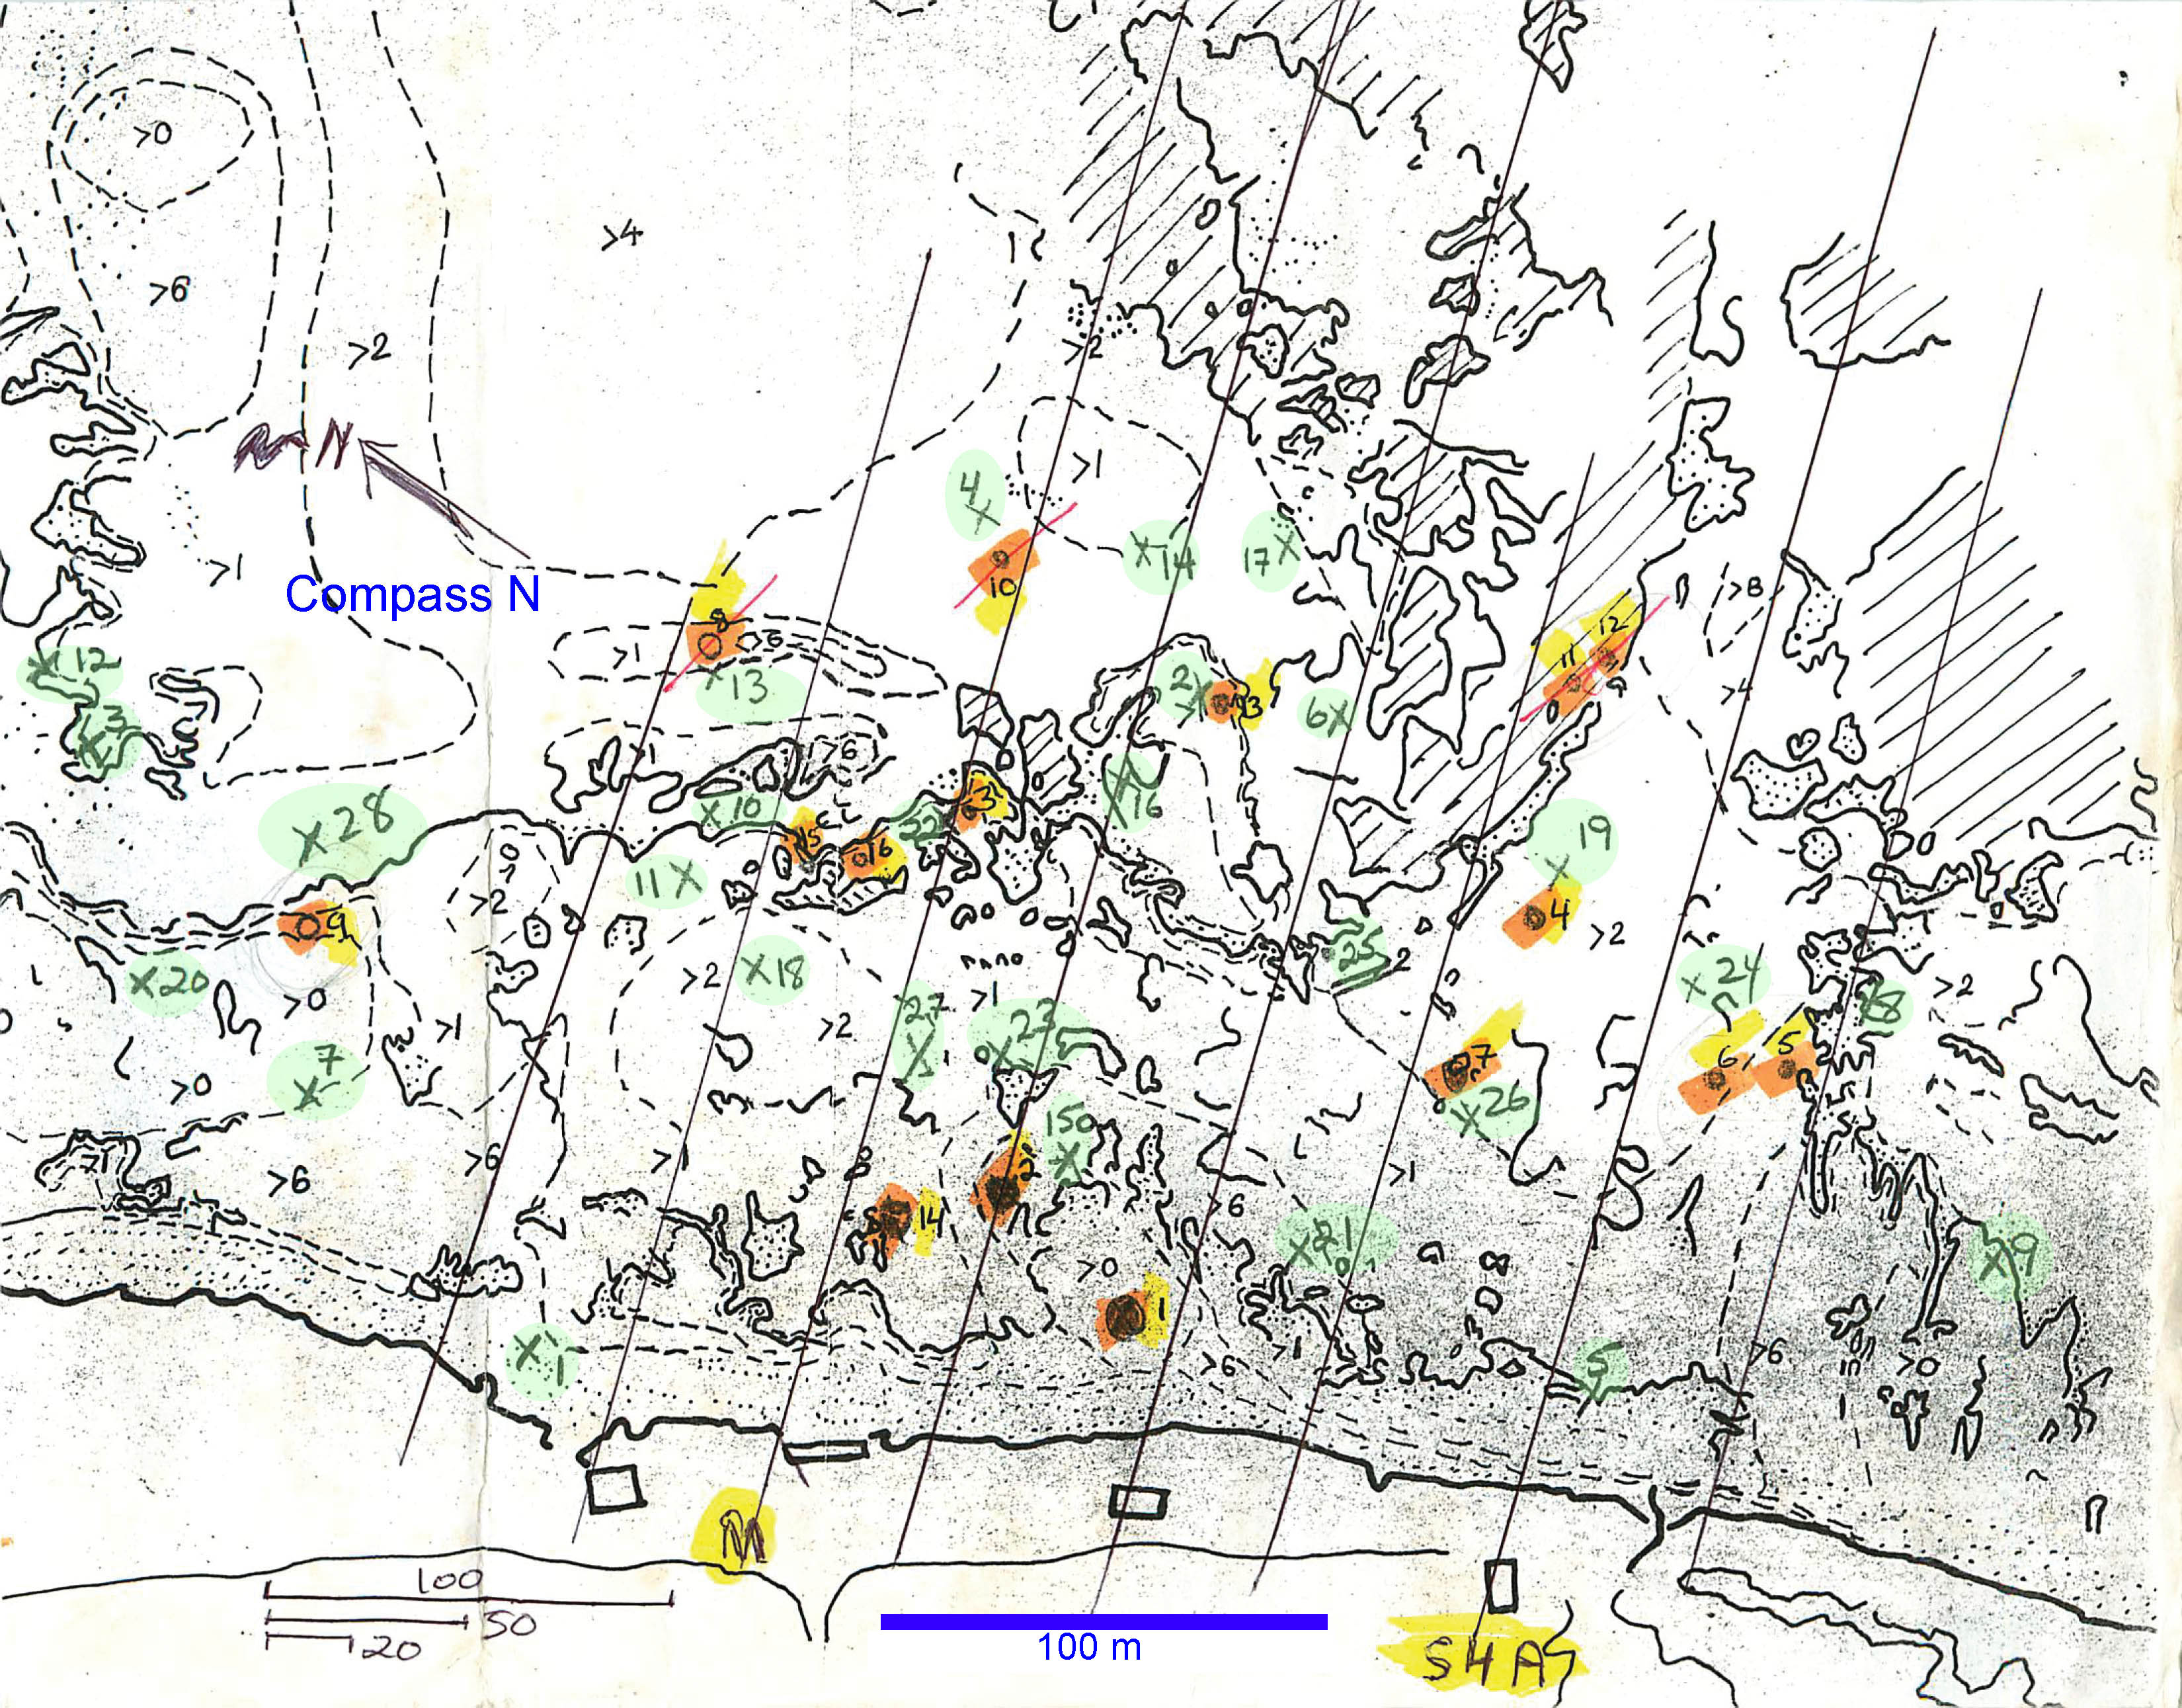
Working Map for Bath from 1969. “>X” refers to depths greater than X feet. Lines are transect lines, orientation 50 deg.. Green-highlighted numerals are the 28 random sampling points. Orange/yellow highlighted numerals are the 16 “Stations”, green highlighted are the 28 “Positions”. “M”: Main Transect. “S4A” – 4th transect towards the south from the M transect. Scales at bottom left in yards. Re: Mixed Units “Canada began its transition to the metric system (SI) in 1970, with the process largely taking place between 1975 and 1985. Key milestones included the introduction of Celsius in April 1975, followed by road signs and gasoline sales in the late 1970s, creating a hybrid system still used today” (From Google AI)
In 1969, a reference transect (“M”) was sited in between the corner of the foundation of a house, and a large rock offshore. Seven other transects were sited in at 40 m intervals to run parallel to this transect. Consistency of direction and lateral location were maintained by lining up two target posts on shore. Distances and depths were measured using a graduated 2 m pole. The locations of the transects were superimposed on outlines of the seagrass beds taken from aerial photographs and traced on plastic drafting paper. These were used in the field to confirm or adjust boundaries of the beds, and to locate further transects, observation points and sampling stations. Depths, substrate types and visibly prominent epiflora and fauna were recorded at 2 m intervals along the transects, or at shorter intervals where depths or flora or fauna changed sharply, or occasionally at longer intervals where changes in depth were gradual, or measurements were difficult because of strong currents or wave action.
Water height at a reference site was monitored during the field work at approximately 1/2 hour intervals. Depths were adjusted to MLW as indicated by Barbados Port Authority tide tables for 1969 (and later, for 1994 and 2015).
The Bath site is highly heterogeneous, with large changes in diversity of the benthic epifauna and flora occurring within distances of a few meters in some regions and without readily discernable overall gradients seaward or with depth, or with substrate types.
Substrate types (Predominantly Sand, Cobble-Sand, Cobble Framework, Porites Rubble Flats and Hard Bottom) varied on a larger scale (Patriquin 1975). In 1969, 28 points (“Positions”) were selected by use of random numbers on a grid of 40 x 40 m squares which covered the entire surveyed area of approximately XXX m2 including areas of seagrass (21 sites) and no seagrass beds (7 sites). At each site, presence or absence of different species of “epibenthic macroflora and macrofauna” (seagrass, corals, sponges, seaweeds) and of sea urchins were observed within a 10 x 10 m area. These data and other informal observations revealed that within each of the rubble-sand, Porites rubble and Cobble substrate type, there were sites of low diversity (S. filiforme or S. filiforme plus some T. testudinum but few other species) which appeared to be recently stabilized or restabilized by seagrass, regions of high diversity usually dominated by the green algae Avrainville rawsonii and A. nigricans, and regions of intermediate diversity.
To provide some quantitative description of these assemblages, 16 “Stations” were selected to represent the 5 different bottom types, and major differences in epibenthic flora and faunal diversity within each of the 5 substrate types. At each station, one corner of a 10 x 10 m plot was staked, and 12 sampling points were selected by use of random numbers on a grid made up of 2 x 2 m squares; the location was determined by use of a compass and graduated 2 m pole. At each point, presence or absence of epibenthic fauna and flora species were observed within a 1/4 m2 quadrat, giving frequency data for each of the documented species (no. quadrats out of 12 in which a species was observed). Seagrass was further sampled by throwing a 1/16 m2 quadrat into the area 3 times, and collecting seagrass within the quadrat after shearing it at substrate level. The seagrass was bagged, subsequently shaken to remove free water, and then weighed fresh. These weights include water, seagrass blades and attached epiphytes. Widths of thirty-five blades, selected randomly, were measured to the nearest 0.5 millimeter, and lengths of the longest-appearing 15 blades were measured to the nearest millimeter.
In 1994, and 2015 the end points of the 1969 reference transect were relocated, and the transect observations were repeated. In 1994 distances along transects were measured with both a 2 m pole as in 1969, and also using a 100 m measuring tape. The transect lines were used to relocate the 1969 sampling stations, and observations were repeated at the 16 stations as in 1969. Seagrass biomass samples were taken from within 1/16th m2 areas within each of 5 of the 12 quadrats The reference site used to monitor tidal height changes during the periods of observation was not the same as the one used in 1969; heights were adjusted to the same reference point (MLW for 1969) by reference to the depth of a large flat boulder observed in all years.